预约演示
Infrared Sensors Major Players for 2023 to 2027 in Germany and Globally researched by Technavio
2023-01-19
NEW YORK, Jan. 19, 2023 /PRNewswire/ -- According to Technavio, the
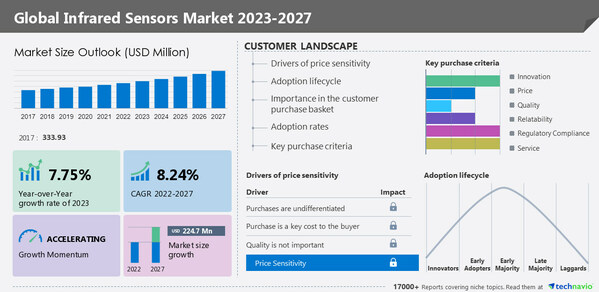
global infrared sensors market size is estimated to grow by
USD 224.7 million from 2022 to 2027. The market is estimated to grow at a
CAGR of 8.24% during the forecast period. APAC will account for 45% of the market's growth during the forecast period. ams OSRAM AG, Elmos Semiconductor AG, Excelitas Technologies Corp., FUJI and Co., Hamamatsu Photonics KK, Honeywell International Inc., InfraTec GmbH, L3Harris Technologies Inc., Leonardo Spa, Melexis NV, Nippon Avionics Co. Ltd., Nippon Ceramic Co. Ltd., OMRON Corp, Parallax Inc., Raytheon Technologies Corp., Teledyne Technologies Inc., Texas Instruments Inc., Thales Group, Zhengzhou Winsen Electronics Technology Co Ltd., and Murata Manufacturing Co. Ltd among the top players,
For insights on vendor offerings,
Request a sample report
Continue Reading
Preview
来源: PRNewswire
Technavio has announced its latest market research report titled Global Infrared Sensors Market 2023-2027
Global infrared (IR) sensors market - Five forces
The global infrared (IR) sensors market is fragmented, and the five forces analysis covers–
Bargaining Power of Buyers
The threat of New Entrants
Threat of Rivalry
Bargaining Power of Suppliers
Threat of Substitutes
Interpretation of porter's five models helps to strategize the business, for entire details –
buy the report!
Global infrared (IR) sensors market – Customer landscape
The report includes the market's adoption lifecycle, from the innovator's stage to the laggard's stage. It focuses on adoption rates in different regions based on penetration. Furthermore, the report also includes key purchase criteria and drivers of price sensitivity to help companies evaluate and develop their growth strategies.
Global infrared (IR) sensors market - Segmentation assessment
Segment overview
Technavio has segmented the market based on
application (commercial, healthcare, automotive, and others), technology (pyroelectric, thermopile, microbolometers, InGaAs, and MCT), and geography (APAC, North America, Europe, South America, and Middle East and Africa).
The market share growth of the
commercial
segment will be higher than the other segments during the forecast period. The increasing popularity of smartphones, tablets, gaming consoles, and bluetooth headsets has raised the demand for infrared sensors. Infrared sensors are used in a variety of applications, including cameras and gesture recognition systems. The market is being driven by rising smartphone and tablet penetration, as well as increased demand for high-quality cameras.
Geography overview
By geography, the global infrared sensors market is segmented into APAC, North America, Europe, South America, and Middle East and Africa. The report provides actionable insights and estimates the contribution of all regions to the growth of the global infrared sensors market.
APAC will account for 45% of the market's growth during the forecast period. The top producers of consumer electronics include nations like China, South Korea, and Japan. Companies have established their manufacturing facilities in the area due to the region's great supply of raw materials and its affordable labor and construction expenses. The demand for infrared sensors to be incorporated into consumer electronics will rise as demand for these products rises.
Download a Sample Report
Global infrared (IR) sensors market –
Market dynamics
Key factor driving market growth
The increase in the number of burglaries is a major factor driving the market growth.
Numerous nations, including the Netherlands, Denmark, Sweden, Belgium, Brazil, Costa Rica, and Australia, are experiencing an increase in burglaries. With the live video feed at their fingertips, homeowners can detect an intruder and take the appropriate action.
An alarm circuit integrated into the LED emits and senses presence, helping in intruder detection.
The need for smart homes is rising globally to prevent and reduce theft, which will drive the market during the forecast period.
Leading trends influencing the market
The adoption of night vision technologies in smart doorbells is another factor supporting the market growth.
Since most burglaries happen at night, it is essential to adopt devices that function properly there. Owners will be informed of any intrusion because these smart doorbells incorporate motion sensor technology.
Hence, more firms are concentrating on offering smart doorbells that offer clear HD vision both during the day and at night. The market will be driven by the inclusion of infrared sensors in smart doorbells due to features like night vision technology that will increase the demand for such integration.
Major challenges hindering the market growth
The impact of environmental conditions on infrared sensors will be a major challenge for market growth.
Rain, fog, dust, sunlight, and wind are a few examples of environmental factors that might affect the proper functioning of infrared sensors. The infrared sensors may pick up unwanted and confused signals due to atmospheric effects that scatter the transmitted infrared radiation or harsh sun glare. Infrared detection equipment is sensitive to rain, fog, dust, and smoke.
Therefore, any external interference to the infrared light that the target is emitting leads to inaccurate detection, which therefore results in faulty measurement. Therefore, such functional and operational problems and the inability of infrared sensors in crucial circumstances might result in a reduction in market share, which will hinder the market growth.
Driver, Trend & Challenges are the factor of market dynamics which states about consequences & sustainability of the businesses, find some insights from a sample report!
What are the key data covered in this infrared (IR) sensors market report?
CAGR of the market during the forecast period
Detailed information on factors that will drive the growth of the infrared (IR) sensors market between 2023 and 2027
Precise estimation of the size of the infrared (IR) sensors market and its contribution to the parent market
Accurate predictions about upcoming trends and changes in consumer behavior
Growth of the infrared (IR) sensors market across APAC, North America, Europe, South America, and Middle East and Africa
A thorough analysis of the market's competitive landscape and detailed information about vendors
Comprehensive analysis of factors that will challenge the growth of infrared (IR) sensors market vendors
Gain instant access to 17,000+ market research reports.
Technavio's SUBSCRIPTION platform
Related Reports:
Superconductor Market by Type, Product, and Geography - Forecast and Analysis 2023-2027: The superconductor market is estimated to grow at a
CAGR of 8.7% between 2022 and 2027. The size of the market is forecasted to increase by
USD 4,472.26 million. The development of smart grids is notably driving the market growth, although factors such as high lead time may impede the market growth.
Motherboard Market by Form Factor, End-user, and Geography - Forecast and Analysis 2023-2027: The motherboard market is estimated to grow at a
CAGR of 17.53% between 2022 and 2027. The size of the market is forecast to increase by
USD 10,466.71 million. The rising adoption of smartphones is notably driving the market growth, although factors such as the availability of substitutes may impede the market growth.
Browse for Technavio "Information Technology" Research Reports
Table of Contents
1 Executive Summary
1.1 Market overview
Exhibit 01: Executive Summary – Chart on Market Overview
Exhibit 02: Executive Summary – Data Table on Market Overview
Exhibit 03: Executive Summary – Chart on Global Market Characteristics
Exhibit 04: Executive Summary – Chart on Market by Geography
Exhibit 05: Executive Summary – Chart on Market Segmentation by Application
Exhibit 06: Executive Summary – Chart on Market Segmentation by Technology
Exhibit 07: Executive Summary – Chart on Incremental Growth
Exhibit 08: Executive Summary – Data Table on Incremental Growth
Exhibit 09: Executive Summary – Chart on Vendor Market Positioning
2 Market Landscape
2.1 Market ecosystem
Exhibit 10: Parent market
Exhibit 11: Market Characteristics
3 Market Sizing
3.1 Market definition
Exhibit 12: Offerings of vendors included in the market definition
3.2 Market segment analysis
Exhibit 13: Market segments
3.3 Market size 2022
3.4 Market outlook: Forecast for 2022-2027
Exhibit 14: Chart on Global - Market size and forecast 2022-2027 ($ million)
Exhibit 15: Data Table on Global - Market size and forecast 2022-2027 ($ million)
Exhibit 16: Chart on Global Market: Year-over-year growth 2022-2027 (%)
Exhibit 17: Data Table on Global Market: Year-over-year growth 2022-2027 (%)
4 Historic Market Size
4.1 Global infrared sensors market 2017 - 2021
Exhibit 18: Historic Market Size – Data Table on Global infrared sensors market 2017 - 2021 ($ million)
4.2 Application Segment Analysis 2017 - 2021
Exhibit 19: Historic Market Size – Application Segment 2017 - 2021 ($ million)
4.3 Technology Segment Analysis 2017 - 2021
Exhibit 20: Historic Market Size – Technology Segment 2017 - 2021 ($ million)
4.4 Geography Segment Analysis 2017 - 2021
Exhibit 21: Historic Market Size – Geography Segment 2017 - 2021 ($ million)
4.5 Country Segment Analysis 2017 - 2021
Exhibit 22: Historic Market Size – Country Segment 2017 - 2021 ($ million)
5 Five Forces Analysis
5.1 Five forces summary
Exhibit 23: Five forces analysis - Comparison between 2022 and 2027
5.2 Bargaining power of buyers
Exhibit 24: Chart on Bargaining power of buyers – Impact of key factors 2022 and 2027
5.3 Bargaining power of suppliers
Exhibit 25: Bargaining power of suppliers – Impact of key factors in 2022 and 2027
5.4 Threat of new entrants
Exhibit 26: Threat of new entrants – Impact of key factors in 2022 and 2027
5.5 Threat of substitutes
Exhibit 27: Threat of substitutes – Impact of key factors in 2022 and 2027
5.6 Threat of rivalry
Exhibit 28: Threat of rivalry – Impact of key factors in 2022 and 2027
5.7 Market condition
Exhibit 29: Chart on Market condition - Five forces 2022 and 2027
6 Market Segmentation by Application
6.1 Market segments
Exhibit 30: Chart on Application - Market share 2022-2027 (%)
Exhibit 31: Data Table on Application - Market share 2022-2027 (%)
6.2 Comparison by Application
Exhibit 32: Chart on Comparison by Application
Exhibit 33: Data Table on Comparison by Application
6.3 Commercial - Market size and forecast 2022-2027
Exhibit 34: Chart on Commercial - Market size and forecast 2022-2027 ($ million)
Exhibit 35: Data Table on Commercial - Market size and forecast 2022-2027 ($ million)
Exhibit 36: Chart on Commercial - Year-over-year growth 2022-2027 (%)
Exhibit 37: Data Table on Commercial - Year-over-year growth 2022-2027 (%)
6.4 Healthcare - Market size and forecast 2022-2027
Exhibit 38: Chart on Healthcare - Market size and forecast 2022-2027 ($ million)
Exhibit 39: Data Table on Healthcare - Market size and forecast 2022-2027 ($ million)
Exhibit 40: Chart on Healthcare - Year-over-year growth 2022-2027 (%)
Exhibit 41: Data Table on Healthcare - Year-over-year growth 2022-2027 (%)
6.5 Automotive - Market size and forecast 2022-2027
Exhibit 42: Chart on Automotive - Market size and forecast 2022-2027 ($ million)
Exhibit 43: Data Table on Automotive - Market size and forecast 2022-2027 ($ million)
Exhibit 44: Chart on Automotive - Year-over-year growth 2022-2027 (%)
Exhibit 45: Data Table on Automotive - Year-over-year growth 2022-2027 (%)
6.6 Others - Market size and forecast 2022-2027
Exhibit 46: Chart on Others - Market size and forecast 2022-2027 ($ million)
Exhibit 47: Data Table on Others - Market size and forecast 2022-2027 ($ million)
Exhibit 48: Chart on Others - Year-over-year growth 2022-2027 (%)
Exhibit 49: Data Table on Others - Year-over-year growth 2022-2027 (%)
6.7 Market opportunity by Application
Exhibit 50: Market opportunity by Application ($ million)
7 Market Segmentation by Technology
7.1 Market segments
Exhibit 51: Chart on Technology - Market share 2022-2027 (%)
Exhibit 52: Data Table on Technology - Market share 2022-2027 (%)
7.2 Comparison by Technology
Exhibit 53: Chart on Comparison by Technology
Exhibit 54: Data Table on Comparison by Technology
7.3 Pyroelectric - Market size and forecast 2022-2027
Exhibit 55: Chart on Pyroelectric - Market size and forecast 2022-2027 ($ million)
Exhibit 56: Data Table on Pyroelectric - Market size and forecast 2022-2027 ($ million)
Exhibit 57: Chart on Pyroelectric - Year-over-year growth 2022-2027 (%)
Exhibit 58: Data Table on Pyroelectric - Year-over-year growth 2022-2027 (%)
7.4 Thermopile - Market size and forecast 2022-2027
Exhibit 59: Chart on Thermopile - Market size and forecast 2022-2027 ($ million)
Exhibit 60: Data Table on Thermopile - Market size and forecast 2022-2027 ($ million)
Exhibit 61: Chart on Thermopile - Year-over-year growth 2022-2027 (%)
Exhibit 62: Data Table on Thermopile - Year-over-year growth 2022-2027 (%)
7.5 Microbolometers - Market size and forecast 2022-2027
Exhibit 63: Chart on Microbolometers - Market size and forecast 2022-2027 ($ million)
Exhibit 64: Data Table on Microbolometers - Market size and forecast 2022-2027 ($ million)
Exhibit 65: Chart on Microbolometers - Year-over-year growth 2022-2027 (%)
Exhibit 66: Data Table on Microbolometers - Year-over-year growth 2022-2027 (%)
7.6 InGaAs - Market size and forecast 2022-2027
Exhibit 67: Chart on InGaAs - Market size and forecast 2022-2027 ($ million)
Exhibit 68: Data Table on InGaAs - Market size and forecast 2022-2027 ($ million)
Exhibit 69: Chart on InGaAs - Year-over-year growth 2022-2027 (%)
Exhibit 70: Data Table on InGaAs - Year-over-year growth 2022-2027 (%)
7.7 MCT - Market size and forecast 2022-2027
Exhibit 71: Chart on MCT - Market size and forecast 2022-2027 ($ million)
Exhibit 72: Data Table on MCT - Market size and forecast 2022-2027 ($ million)
Exhibit 73: Chart on MCT - Year-over-year growth 2022-2027 (%)
Exhibit 74: Data Table on MCT - Year-over-year growth 2022-2027 (%)
7.8 Market opportunity by Technology
Exhibit 75: Market opportunity by Technology ($ million)
8 Customer Landscape
8.1 Customer landscape overview
Exhibit 76: Analysis of price sensitivity, lifecycle, customer purchase basket, adoption rates, and purchase criteria
9 Geographic Landscape
9.1 Geographic segmentation
Exhibit 77: Chart on Market share by geography 2022-2027 (%)
Exhibit 78: Data Table on Market share by geography 2022-2027 (%)
9.2 Geographic comparison
Exhibit 79: Chart on Geographic comparison
Exhibit 80: Data Table on Geographic comparison
9.3 APAC - Market size and forecast 2022-2027
Exhibit 81: Chart on APAC - Market size and forecast 2022-2027 ($ million)
Exhibit 82: Data Table on APAC - Market size and forecast 2022-2027 ($ million)
Exhibit 83: Chart on APAC - Year-over-year growth 2022-2027 (%)
Exhibit 84: Data Table on APAC - Year-over-year growth 2022-2027 (%)
9.4 North America - Market size and forecast 2022-2027
Exhibit 85: Chart on North America - Market size and forecast 2022-2027 ($ million)
Exhibit 86: Data Table on North America - Market size and forecast 2022-2027 ($ million)
Exhibit 87: Chart on North America - Year-over-year growth 2022-2027 (%)
Exhibit 88: Data Table on North America - Year-over-year growth 2022-2027 (%)
9.5 Europe - Market size and forecast 2022-2027
Exhibit 89: Chart on Europe - Market size and forecast 2022-2027 ($ million)
Exhibit 90: Data Table on Europe - Market size and forecast 2022-2027 ($ million)
Exhibit 91: Chart on Europe - Year-over-year growth 2022-2027 (%)
Exhibit 92: Data Table on Europe - Year-over-year growth 2022-2027 (%)
9.6 South America - Market size and forecast 2022-2027
Exhibit 93: Chart on South America - Market size and forecast 2022-2027 ($ million)
Exhibit 94: Data Table on South America - Market size and forecast 2022-2027 ($ million)
Exhibit 95: Chart on South America - Year-over-year growth 2022-2027 (%)
Exhibit 96: Data Table on South America - Year-over-year growth 2022-2027 (%)
9.7 Middle East and Africa - Market size and forecast 2022-2027
Exhibit 97: Chart on Middle East and Africa - Market size and forecast 2022-2027 ($ million)
Exhibit 98: Data Table on Middle East and Africa - Market size and forecast 2022-2027 ($ million)
Exhibit 99: Chart on Middle East and Africa - Year-over-year growth 2022-2027 (%)
Exhibit 100: Data Table on Middle East and Africa - Year-over-year growth 2022-2027 (%)
9.8 US - Market size and forecast 2022-2027
Exhibit 101: Chart on US - Market size and forecast 2022-2027 ($ million)
Exhibit 102: Data Table on US - Market size and forecast 2022-2027 ($ million)
Exhibit 103: Chart on US - Year-over-year growth 2022-2027 (%)
Exhibit 104: Data Table on US - Year-over-year growth 2022-2027 (%)
9.9 China - Market size and forecast 2022-2027
Exhibit 105: Chart on China - Market size and forecast 2022-2027 ($ million)
Exhibit 106: Data Table on China - Market size and forecast 2022-2027 ($ million)
Exhibit 107: Chart on China - Year-over-year growth 2022-2027 (%)
Exhibit 108: Data Table on China - Year-over-year growth 2022-2027 (%)
9.10 Japan - Market size and forecast 2022-2027
Exhibit 109: Chart on Japan - Market size and forecast 2022-2027 ($ million)
Exhibit 110: Data Table on Japan - Market size and forecast 2022-2027 ($ million)
Exhibit 111: Chart on Japan - Year-over-year growth 2022-2027 (%)
Exhibit 112: Data Table on Japan - Year-over-year growth 2022-2027 (%)
9.11 Germany - Market size and forecast 2022-2027
Exhibit 113: Chart on Germany - Market size and forecast 2022-2027 ($ million)
Exhibit 114: Data Table on Germany - Market size and forecast 2022-2027 ($ million)
Exhibit 115: Chart on Germany - Year-over-year growth 2022-2027 (%)
Exhibit 116: Data Table on Germany - Year-over-year growth 2022-2027 (%)
9.12 South Korea - Market size and forecast 2022-2027
Exhibit 117: Chart on South Korea - Market size and forecast 2022-2027 ($ million)
Exhibit 118: Data Table on South Korea - Market size and forecast 2022-2027 ($ million)
Exhibit 119: Chart on South Korea - Year-over-year growth 2022-2027 (%)
Exhibit 120: Data Table on South Korea - Year-over-year growth 2022-2027 (%)
9.13 Market opportunity by geography
Exhibit 121: Market opportunity by geography ($ million)
10 Drivers, Challenges, and Trends
10.1 Market drivers
10.2 Market challenges
10.3 Impact of drivers and challenges
Exhibit 122: Impact of drivers and challenges in 2022 and 2027
10.4 Market trends
11 Vendor Landscape
11.1 Overview
11.2 Vendor landscape
Exhibit 123: Overview on Criticality of inputs and Factors of differentiation
11.3 Landscape disruption
Exhibit 124: Overview on factors of disruption
11.4 Industry risks
Exhibit 125: Impact of key risks on business
12 Vendor Analysis
12.1 Vendors covered
Exhibit 126: Vendors covered
12.2 Market positioning of vendors
Exhibit 127: Matrix on vendor position and classification
12.3 ams OSRAM AG
Exhibit 128: ams OSRAM AG - Overview
Exhibit 129: ams OSRAM AG - Business segments
Exhibit 130: ams OSRAM AG - Key offerings
Exhibit 131: ams OSRAM AG - Segment focus
12.4 Elmos Semiconductor AG
Exhibit 132: Elmos Semiconductor AG - Overview
Exhibit 133: Elmos Semiconductor AG - Business segments
Exhibit 134: Elmos Semiconductor AG - Key offerings
Exhibit 135: Elmos Semiconductor AG - Segment focus
Exhibit 136: Excelitas Technologies Corp. - Overview
Exhibit 137: Excelitas Technologies Corp. - Product / Service
Exhibit 138: Excelitas Technologies Corp. - Key offerings
12.6 FUJI and Co.
Exhibit 139: FUJI and Co. - Overview
Exhibit 140: FUJI and Co. - Product / Service
Exhibit 141: FUJI and Co. - Key offerings
Exhibit 142: Hamamatsu Photonics KK - Overview
Exhibit 143: Hamamatsu Photonics KK - Business segments
Exhibit 144: Hamamatsu Photonics KK - Key offerings
Exhibit 145: Hamamatsu Photonics KK - Segment focus
Exhibit 146: Honeywell International Inc. - Overview
Exhibit 147: Honeywell International Inc. - Business segments
Exhibit 148: Honeywell International Inc. - Key news
Exhibit 149: Honeywell International Inc. - Key offerings
Exhibit 150: Honeywell International Inc. - Segment focus
12.9 InfraTec GmbH
Exhibit 151: InfraTec GmbH - Overview
Exhibit 152: InfraTec GmbH - Product / Service
Exhibit 153: InfraTec GmbH - Key offerings
12.10 Leonardo Spa
Exhibit 154: Leonardo Spa - Overview
Exhibit 155: Leonardo Spa - Business segments
Exhibit 156: Leonardo Spa - Key news
Exhibit 157: Leonardo Spa - Key offerings
Exhibit 158: Leonardo Spa - Segment focus
12.11 Murata Manufacturing Co. Ltd.
Exhibit 159: Murata Manufacturing Co. Ltd. - Overview
Exhibit 160: Murata Manufacturing Co. Ltd. - Business segments
Exhibit 161: Murata Manufacturing Co. Ltd. - Key news
Exhibit 162: Murata Manufacturing Co. Ltd. - Key offerings
Exhibit 163: Murata Manufacturing Co. Ltd. - Segment focus
12.12 OMRON Corp
Exhibit 164: OMRON Corp - Overview
Exhibit 165: OMRON Corp - Business segments
Exhibit 166: OMRON Corp - Key news
Exhibit 167: OMRON Corp - Key offerings
Exhibit 168: OMRON Corp - Segment focus
12.13 Parallax Inc.
Exhibit 169: Parallax Inc. - Overview
Exhibit 170: Parallax Inc. - Product / Service
Exhibit 171: Parallax Inc. - Key offerings
Exhibit 172: Raytheon Technologies Corp. - Overview
Exhibit 173: Raytheon Technologies Corp. - Business segments
Exhibit 174: Raytheon Technologies Corp. - Key news
Exhibit 175: Raytheon Technologies Corp. - Key offerings
Exhibit 176: Raytheon Technologies Corp. - Segment focus
12.15 Teledyne Technologies Inc.
Exhibit 177: Teledyne Technologies Inc. - Overview
Exhibit 178: Teledyne Technologies Inc. - Business segments
Exhibit 179: Teledyne Technologies Inc. - Key news
Exhibit 180: Teledyne Technologies Inc. - Key offerings
Exhibit 181: Teledyne Technologies Inc. - Segment focus
12.16 Texas Instruments Inc.
Exhibit 182: Texas Instruments Inc. - Overview
Exhibit 183: Texas Instruments Inc. - Business segments
Exhibit 184: Texas Instruments Inc. - Key news
Exhibit 185: Texas Instruments Inc. - Key offerings
Exhibit 186: Texas Instruments Inc. - Segment focus
12.17 Thales Group
Exhibit 187: Thales Group - Overview
Exhibit 188: Thales Group - Business segments
Exhibit 189: Thales Group - Key offerings
Exhibit 190: Thales Group - Segment focus
13 Appendix
13.1 Scope of the report
13.2 Inclusions and exclusions checklist
Exhibit 191: Inclusions checklist
Exhibit 192: Exclusions checklist
13.3 Currency conversion rates for US$
Exhibit 193: Currency conversion rates for US$
13.4 Research methodology
Exhibit 194: Research methodology
Exhibit 195: Validation techniques employed for market sizing
Exhibit 196: Information sources
13.5 List of abbreviations
Exhibit 197: List of abbreviations
About Us
Technavio is a leading global technology research and advisory company. Their research and analysis focuses on emerging market trends and provides actionable insights to help businesses identify market opportunities and develop effective strategies to optimize their market positions. With over 500 specialized analysts, Technavio's report library consists of more than 17,000 reports and counting, covering 800 technologies, spanning across 50 countries. Their client base consists of enterprises of all sizes, including more than 100 Fortune 500 companies. This growing client base relies on Technavio's comprehensive coverage, extensive research, and actionable market insights to identify opportunities in existing and potential markets and assess their competitive positions within changing market scenarios.
Contact
Technavio Research
Jesse Maida
Media & Marketing Executive
US: +1 844 364 1100
UK: +44 203 893 3200
Email: [email protected]
Website: www.technavio.com/
SOURCE Technavio
更多内容,请访问原始网站
文中所述内容并不反映新药情报库及其所属公司任何意见及观点,如有版权侵扰或错误之处,请及时联系我们,我们会在24小时内配合处理。
适应症
-靶点
-药物
-生物医药百科问答
全新生物医药AI Agent 覆盖科研全链路,让突破性发现快人一步


立即开始免费试用!
智慧芽新药情报库是智慧芽专为生命科学人士构建的基于AI的创新药情报平台,助您全方位提升您的研发与决策效率。
立即开始数据试用!
智慧芽新药库数据也通过智慧芽数据服务平台,以API或者数据包形式对外开放,助您更加充分利用智慧芽新药情报信息。