预约演示
更新于:2026-04-11
Changzhou Jiuhong Medical Instrument Co., Ltd.
更新于:2026-04-11
概览
关联
100 项与 常州市久虹医疗器械有限公司 相关的临床结果
登录后查看更多信息
0 项与 常州市久虹医疗器械有限公司 相关的专利(医药)
登录后查看更多信息
1
项与 常州市久虹医疗器械有限公司 相关的新闻(医药)2025-08-18
2022年11月1日起,行政相对人可登录国家药品监督管理局政务服务门户的法人空间查看电子证照,按照相关提示自行打印。序号受理号产品名称申请人代理人注册证编号批准日期1CQD2502352微波治疗机吉林省众驰医疗科技有限公司/国械注准202230911442025-8-142CQD2502353一次性使用防针刺静脉采血针扬州美德莱医疗用品股份有限公司/国械注准202032200042025-8-143CQD2502354非顺应性外周球囊扩张导管科塞尔医疗科技(苏州)有限公司/国械注准202330313082025-8-144CQD2502355软性亲水接触镜爱博诺德(苏州)医疗器械有限公司/国械注准202531608332025-8-145CQD2502356基台系统广东中科安齿生物科技有限公司/国械注准202131700092025-8-146CQD2502357气囊式体外反搏装置江西杰派科技发展有限公司/国械注准201630914252025-8-147CQD2502358一次性使用无菌注射器 带防针刺注射针扬州美德莱医疗用品股份有限公司/国械注准201831404972025-8-148CQD2502359一次性使用息肉切除器常州市久虹医疗器械有限公司/国械注准201730107362025-8-149CQD2502360一次性使用输液连接管常州医疗器材总厂股份有限公司/国械注准201731440282025-8-1410CQD2502361椎板固定板系统江苏维尔康医疗科技有限公司/国械注准202531315012025-8-1511CQD2502362复合式冷热消融设备海杰亚(北京)医疗器械有限公司/国械注准202430111132025-8-1512CQD2502363可吸收性外科缝线南京普立蒙医疗科技有限公司/国械注准202430219662025-8-1513CQD2502364一次性使用超声软组织手术刀头以诺康医疗科技(苏州)股份有限公司/国械注准202530115382025-8-1514CQD2502365射频治疗仪天津市赛盟医疗科技有限公司/国械注准201930117292025-8-1515CQD2502366多功能隐形眼镜护理液大晶眼健康科技(浙江)有限公司/国械注准201731642132025-8-1516CQD2502367一次性使用输液器 带针河南曙光健士实业发展有限公司/国械注准201531410902025-8-1517CQD2502368金属接骨螺钉山东含章医疗技术有限公司/国械注准202531312962025-8-1518CQD2502369一次性使用电动直线型切割吻合器和钉仓宁波海泰科迈医疗器械有限公司/国械注准202430126382025-8-1519CQD2502370万向金属锁定接骨板系统卓迈康(厦门)医疗器械有限公司/国械注准202531313542025-8-1520CQD2502371含利多卡因注射用透明质酸钠溶液济南格莱威医疗科技有限公司/国械注准202531314752025-8-1521CQD2502372可过活检孔道肠道支架套装南微医学科技股份有限公司/国械注准201931309492025-8-1522CQD2502373空心接骨螺钉(非锁定)江苏安格尔医疗器械有限公司/国械注准201931307952025-8-1523CQD2502374一次性使用输液器 带针河南曙光健士实业发展有限公司/国械注准201531422002025-8-1524CQD2502375胸腰椎后路内固定系统宁波华科润生物科技有限公司/国械注准202531313322025-8-1525CQD2502376一次性使用防针刺静脉留置针江西洪达医疗器械集团有限公司/国械注准201831403032025-8-1526CQD2502377一次性使用动静脉穿刺针江西洪达医疗器械集团有限公司/国械注准201531002032025-8-1527CQD2502378一次性电动腔镜用直线型切割吻合器钉仓组件江苏风和医疗器材股份有限公司/国械注准202130106692025-8-1828CQD2502379一次性使用消化道内窥镜组织钳深圳市罗伯医疗科技有限公司/国械注准202530111492025-8-1829CQD2502380肺结节CT影像辅助检测软件上海杏脉信息科技有限公司/国械注准202232106252025-8-1830CQD2502381X射线计算机体层摄影设备宽腾(北京)医疗技术有限公司/国械注准202430620192025-8-1831CQD2502382一次性使用精密过滤输液器 带针上海正邦医疗科技有限公司/国械注准201731442492025-8-1832CQX2400389胰岛素泵珠海福尼亚医疗设备有限公司/国械注准201931417232025-8-1433CQX2401129麻醉机天津易世恒医疗科技有限公司/国械注准202430800702025-8-1434CQX2401690全自动核酸检测分析系统北京博晖创新生物技术集团股份有限公司/国械注准202332206972025-8-1435CQX2500420输液用肝素帽圣光医用制品股份有限公司/国械注准201531422102025-8-1436CQX2500913一次性使用血浆胆红素吸附器健帆生物科技集团股份有限公司/国械注准201631003732025-8-1337CQY2500716一次性使用热活检钳北京中科盛康科技股份有限公司/国械注准202130100602025-8-1238CQY2500873半导体激光治疗仪安徽得邦激光技术有限公司/国械注准202030908432025-8-1239CSX2400140血小板抗体检测试剂盒(固相凝集法)深圳市爱康试剂有限公司/国械注准202234011842025-8-1440CSX2400143血小板抗体检测用指示红细胞(固相凝集法)深圳市爱康试剂有限公司/国械注准202234010912025-8-1441CSX2400466柯萨奇病毒 A16 型核酸检测试剂盒(PCR-荧光探针法)广州达安基因股份有限公司/国械注准201734001732025-8-1442CSX2500121乙型肝炎病毒核心抗体测定试剂盒(双抗原夹心磁微粒化学发光法)厦门万泰凯瑞生物技术有限公司/国械注准201734013782025-8-1443CSX2500131I型单纯疱疹病毒IgM抗体检测试剂盒(化学发光免疫分析法)深圳市新产业生物医学工程股份有限公司/国械注准202334015602025-8-1444CSX2500132幽门螺杆菌IgG抗体检测试剂盒(化学发光免疫分析法)深圳市新产业生物医学工程股份有限公司/国械注准202234002112025-8-1445CSX2500266CYP2C19基因检测试剂盒(PCR毛细电泳片段分析法)宁波海尔施基因科技股份有限公司/国械注准201634004622025-8-1446CSX2500306乙型肝炎病毒核心抗体检测试剂盒(化学发光免疫分析法)广州市达瑞生物技术股份有限公司/国械注准201634013102025-8-1447CSX2500340氨基酸和肉碱检测试剂盒(液相色谱-串联质谱法)华大生物科技(武汉)有限公司/国械注准201734031802025-8-1448CSX2500363人类NRAS基因突变检测试剂盒(荧光PCR法)厦门艾德生物医药科技股份有限公司/国械注准201534011252025-8-1449CSX2500369六项呼吸道病毒核酸检测试剂盒(PCR-熔解曲线法)成都博奥晶芯生物科技有限公司/国械注准202434026462025-8-1450CSY2500355新型冠状病毒2019-nCoV核酸检测试剂盒(荧光PCR法)迈克生物股份有限公司/国械注准202034001842025-8-1351JQD2500871血液透析干粉Vantive Health GmbH万益特医疗用品贸易(上海)有限公司国械注进201831021222025-8-1452JQD2500872软性亲水接触镜INTEROJO INC.上海茵洛光学产品有限公司国械注进201431650182025-8-1453JQD2500873双极器械Erbe Elektromedizin GmbH爱尔博(上海)医疗器械有限公司国械注进201430152862025-8-1454JQD2500874乳腺X射线图像密度评估软件Hologic, Inc.北京豪洛捷科技有限公司国械注进201522137022025-8-1455JQD2500875乳腺X射线图像CAD软件Hologic, Inc.北京豪洛捷科技有限公司国械注进201532136932025-8-1556JQD2500876连续性血液净化用透析滤过器及配套管路Vantive Health GmbH万益特医疗用品贸易(上海)有限公司国械注进202331001182025-8-1557JQD2500877连续性血液净化用透析滤过器及配套管路Vantive Health GmbH万益特医疗用品贸易(上海)有限公司国械注进202331000362025-8-1558JQD2500878血液透析滤过器Baxter Healthcare SA百特医疗用品贸易(上海)有限公司国械注进201731007012025-8-1559JQD2500879连续性血液净化透析滤过器及配套管路Vantive Health GmbH万益特医疗用品贸易(上海)有限公司国械注进202331000702025-8-1560JQD2500880中空纤维透析器Gambro Dialysatoren GmbH万益特医疗用品贸易(上海)有限公司国械注进201631021702025-8-1561JQD2500881中空纤维透析滤过器Vantive Health GmbH万益特医疗用品贸易(上海)有限公司国械注进201531005042025-8-1562JQD2500882硅凝胶Advanced Bio-Technologies, Inc.艾来茵生物技术(上海)有限公司国械注进202421401682025-8-1563JQD2500883软性亲水接触镜INTEROJO INC.上海茵洛光学产品有限公司国械注进201731666152025-8-1864JQD2500884腹膜透析螺旋帽钛接头Vantive US Healthcare LLC万益特医疗用品贸易(上海)有限公司国械注进201721017062025-8-1865JQD2500885整形用胶原和PMMA皮下植入物系统Suneva Medical, Inc.杭州瑞泉医疗器械有限公司国械注进202431300412025-8-1866JQX2401179电动马达CEFLA S.C.上海熠品质量技术服务有限公司国械注进201721717742025-8-1467JQX2401562人工髋关节部件-髋臼、股骨头联合骨科器材股份有限公司联贸医疗用品技术(上海)有限公司国械注许201831300542025-8-1468JQX2401577人工髋关节部件-髋臼内衬联合骨科器材股份有限公司联贸医疗用品技术(上海)有限公司国械注许202331300012025-8-1369JQX2500267客观听力测试仪MAICO Diagnostics GmbH奥迪康(上海)听力技术有限公司国械注进201720708332025-8-1470JQX2500958亲水加聚型硅橡胶印模材料3M Deutschland GmbH明州斯睿医疗产品(上海)有限公司国械注进201921715682025-8-1471JQY2500561裂隙灯显微镜意大利C.S.0.公司C.S.O. SRL广东燊必明医疗器械技术服务有限公司国械注进201521606202025-8-1272JSD2500130阴道毛滴虫核酸检测试剂盒(捕获杂交法)Hologic, Inc.豪洛捷医疗科技(北京)有限公司国械注进201734052182025-8-1573JSX2500121脑利钠肽前体检测用质控品Roche Diagnostics GmbH罗氏诊断产品(上海)有限公司国械注进201424057962025-8-1474JSX2500244乙型肝炎病毒核酸检测试剂盒(实时荧光转录介导扩增法)Hologic, Inc.豪洛捷医疗科技(北京)有限公司国械注进201934004982025-8-1475JSX2500249丙型肝炎病毒(HCV)核酸(RNA)检测试剂盒(实时荧光PCR法)Cepheid AB赛沛(上海)商贸有限公司国械注进202134000742025-8-1476JSX2500304C反应蛋白(hs-CRP)检测试剂盒(胶乳法)Roche Diagnostics GmbH罗氏诊断产品(上海)有限公司国械注进201724009822025-8-1477JSY2500500游离前列腺特异性抗原校准品Siemens Healthcare Diagnostics Products Limited西门子医学诊断产品(上海)有限公司国械注进202134000732025-8-12
申请上市临床申请
100 项与 常州市久虹医疗器械有限公司 相关的药物交易
登录后查看更多信息
100 项与 常州市久虹医疗器械有限公司 相关的转化医学
登录后查看更多信息
组织架构
使用我们的机构树数据加速您的研究。
登录
或
管线布局
2026年04月11日管线快照
无数据报导
登录后保持更新
药物交易
使用我们的药物交易数据加速您的研究。
登录
或
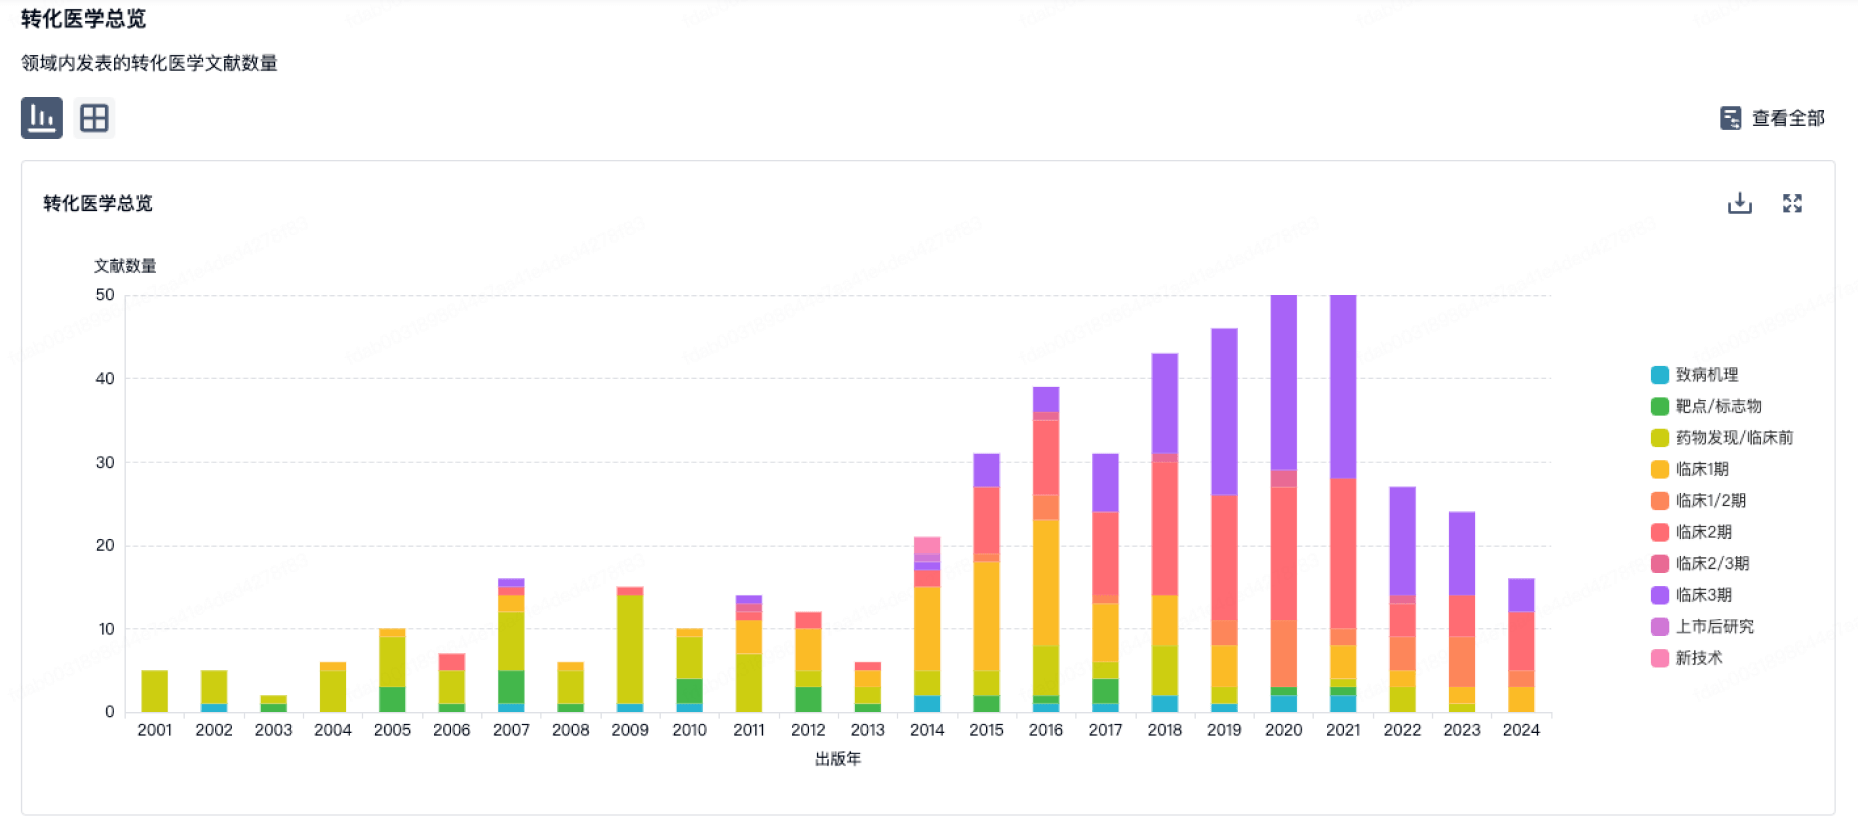
转化医学
使用我们的转化医学数据加速您的研究。
登录
或
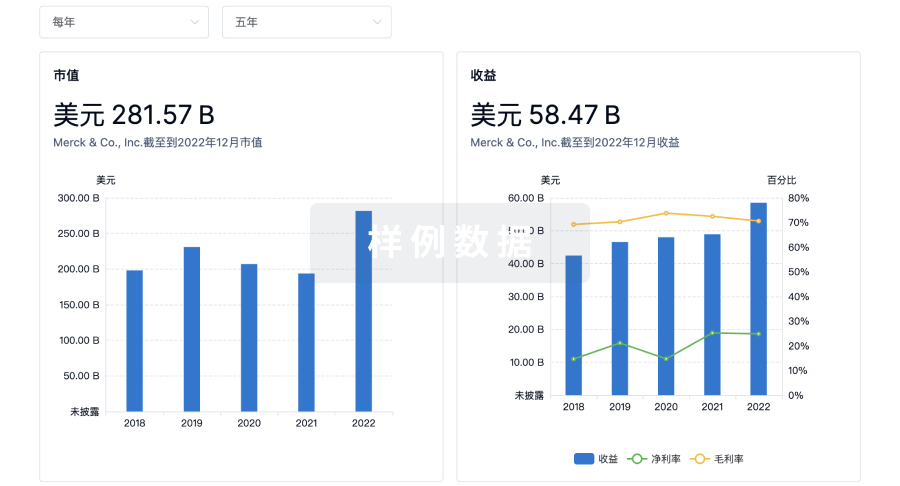
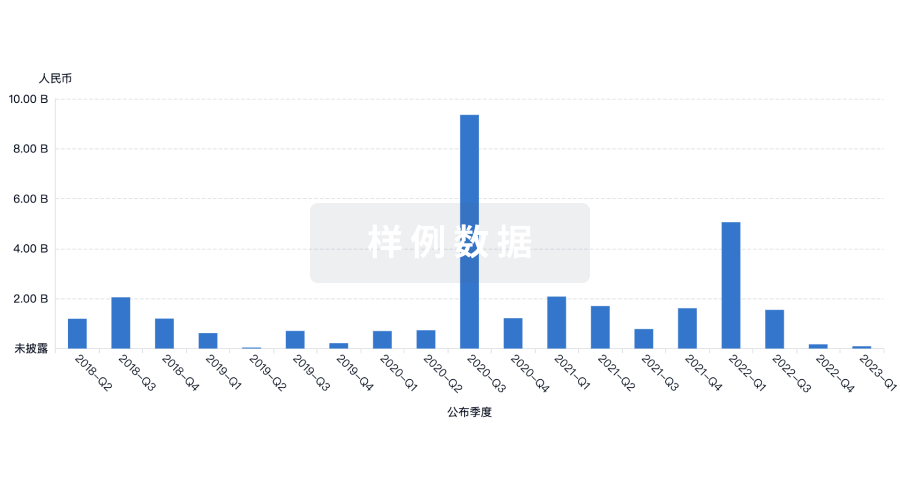
营收
使用 Synapse 探索超过 36 万个组织的财务状况。
登录
或
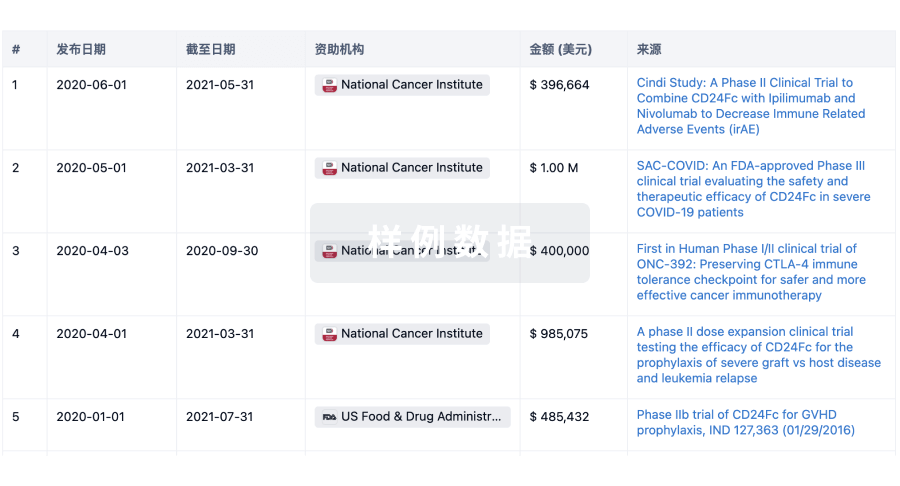
科研基金(NIH)
访问超过 200 万项资助和基金信息,以提升您的研究之旅。
登录
或
投资
深入了解从初创企业到成熟企业的最新公司投资动态。
登录
或
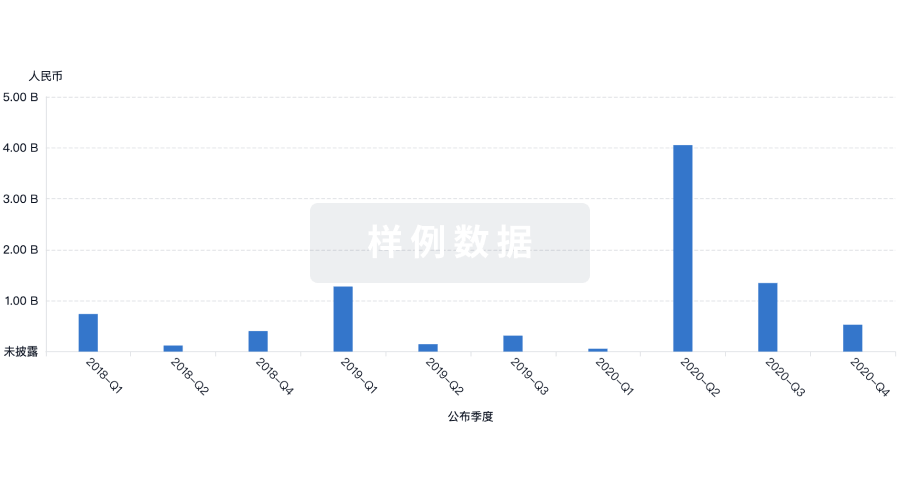
融资
发掘融资趋势以验证和推进您的投资机会。
登录
或
生物医药百科问答
全新生物医药AI Agent 覆盖科研全链路,让突破性发现快人一步
立即开始免费试用!
智慧芽新药情报库是智慧芽专为生命科学人士构建的基于AI的创新药情报平台,助您全方位提升您的研发与决策效率。
立即开始数据试用!
智慧芽新药库数据也通过智慧芽数据服务平台,以API或者数据包形式对外开放,助您更加充分利用智慧芽新药情报信息。
生物序列数据库
生物药研发创新
免费使用
化学结构数据库
小分子化药研发创新
免费使用