预约演示
更新于:2025-08-29
Life Optics
更新于:2025-08-29
概览
关联
100 项与 Life Optics 相关的临床结果
登录后查看更多信息
0 项与 Life Optics 相关的专利(医药)
登录后查看更多信息
5
项与 Life Optics 相关的新闻(医药)2024-01-22
ANN ARBOR, Mich., Jan. 22, 2024 (GLOBE NEWSWIRE) -- Kraig Biocraft Laboratories, Inc. (OTCQB: KBLB) ("the Company"), shares an update on near-term commercial applications and opportunities for recombinant spider silk as the Company prepares for expanding production in 2024. Spider silk has long been prized for its unique blend of chemical and mechanical properties, including strength and elasticity. Kraig Labs is currently in the process of ramping up production trials of its recombinant spider silk under the trademark Dragon Silk™. The move to ramp up production follows on the heels of the Company's successful early production test announced in December. During the ramp-up phase, while production quantities are relatively limited, the Company is targeting end-product applications in fashion and performance apparel. "Because production quantities will be relatively limited during the early stages of the production ramp-up, and because we will have control of that limited supply of Dragon Silk, it makes sense for us to focus on markets where we can control the end use of the Dragon Silk That will allow us to potentially share in a portion of the value-added manufacturing and distribution beyond the creation of the recombinant spider silk itself," said Company Founder and CEO, Kim Thompson. "In essence, we are looking for partial vertical integration in these early spider silk products to maximize our market position.” As production quantities increase, the Company expects to begin addressing demand from additional market segments, including: Engineering textilesCompositesCosmeticsDefensive and protective textilesBio-plastics that are biodegradable and bio-compatibleFiber opticsMedical textiles, fibers, ligaments, wound dressings, skin grafts, and tissue engineering The Company believes that the enhanced strength and toughness of its Dragon Silk line of materials, combined with their bio-degradable and biocompatible properties, will be able to address existing material needs in these markets and many more. Kraig Labs has already begun early-stage exploration into bio-plastics, medical textiles, cosmetics & defensive textile applications and expects to accelerate work in these fields as production of spider silk increases. To view the most recent news from Kraig Labs and/or to sign up for Company alerts, please go to www.KraigLabs.com/news
About Kraig Biocraft Laboratories, Inc. Kraig Biocraft Laboratories, Inc. (www.KraigLabs.com), a reporting biotechnology company is the leading developer of genetically engineered spider silk based fiber technologies. The Company has achieved a series of scientific breakthroughs in the area of spider silk technology with implications for the global textile industry. Cautionary Statement Regarding Forward Looking Information Statements in this press release about the Company's future and expectations other than historical facts are "forward-looking statements." These statements are made on the basis of management's current views and assumptions. As a result, there can be no assurance that management's expectations will necessarily come to pass. These forward-looking statements generally can be identified by phrases such as "believes," "plans," "expects," "anticipates," "foresees," "estimated," "hopes," "if," "develops," "researching," "research," "pilot," "potential," "could" or other words or phrases of similar import. Forward looking statements include descriptions of the Company's business strategy, outlook, objectives, plans, intentions and goals. All such forward-looking statements are subject to certain risks and uncertainties that could cause actual results to differ materially from those in forward-looking statements. This press release does not constitute an offer to sell or the solicitation of an offer to buy any security. Ben Hansel, Hansel Capital, LLC(720) 288-8495ir@KraigLabs.com
2021-07-06
Pune, India, July 06, 2021 (GLOBE NEWSWIRE) -- The global blockchain market size is projected to reach USD 69.04 billion by 2027, exhibiting a CAGR of 56.1% during the forecast period. In 2019, the value of the market was USD 2.01 billion. The open access to data facilitated by blockchain technologies will be the central growth determinant for this market. Fortune Business Insights shares this information in its report titled "Blockchain Market, 2021-2027."
Request a Sample Copy of Report:
Blockchain technology divides ledgers into nodes that can be accessed by several individuals. These nodes consist of an electronic device responsible for preserving the data and securing the network chain by advanced safety technologies using algorithms. The rising demand for advanced technological solutions that provide accurate market data to companies for making products based on the consumer’s needs. This technology is finding widening applications in different industries, such as BFSI and retail, where companies are deploying smart tools to monitor their transactions throughout the supply chain. For example, Unilever uses blockchain to control their tea trade by tracking the progress of transactions from the distribution network. Countries such as the US, Japan, South Korea, and others are also heavily investing in digital ledger technologies (DLT) to expand their uses across several sectors. For example, in 2019 the Republic of Korea spent USD 9 million for the expansion of the advanced ledger system throughout its public sector. As a result of the rising adoption of open-access technologies by various countries and companies, the market is anticipated to grow during the upcoming years.
List of Key Players Profiled in the Blockchain Market Report
Click here to get the short-term and long-term impact of COVID-19 on this market.
Please visit:
Impact of COVID-19
The COVID-19 pandemic has adversely affected production activities by reducing workers’ availability, leading to the temporary shutting down of plants and factories. However, because of the digitization of activities the blockchain market growth is anticipated to flourish as this technology enables swift digitization of balance sheets and reports. Further, it can enable the monitoring of data regarding public health, managing emergencies, tracking donations, and procuring medicines and other essential medical supplies. In addition, governments and global organizations are working on bringing transparency in the collection and dissemination of COVID-related information using advanced data tracking technologies. For example, the World Health Organization (WHO) launched a distributed ledger technology named "MiPasa' to track the rate of COVID-19 cases and highlight the worst-affected regions.
Segments
By component, the market is segmented into platforms/solutions and services. Based on type, it is segregated into public, private, and consortium. As per deployment, it is divided into proof of concept, pilot, and production. On the basis of application, it is categorized into digital identity, payments, smart connect, supply chain management, exchange, documents, and others. The market has been distributed by industry into BFSI, energy & utilities, government, healthcare & life sciences, manufacturing, and others. Geographically, it is grouped into North America, Europe, Asia Pacific, Latin America, and the Middle East & Africa.
Highlights of the report
The report supplies a thorough analysis of the top segments and the latest market trends. It comprehensively discusses the impact of COVID-19 and the driving and restraining factors shaping the growth of the market. Additionally, it holistically examines regional developments and the strategies implemented by the market's key players.
Speak To Our Analyst:
Drivers and Restraints
Rising Adoption of Data Analysis Technology for Monitoring Transactions to Propel Market
Distributed ledger technology is extensively used for tracking data related to monetary transactions with the utmost security and for the monitoring of the transfer and debit of currencies digitally. Germany, the US, and several other countries are providing DLT services to enhance the efficiency of banking transactions. For example, SAP SE, R3 Technology Inc., and Accenture plc engaged in a partnership in October 2019 to develop a real-time gross settlement (RTGS) solution offering consumers efficiency, speed, and security during digital payments. In addition, blockchain-based solutions are utilized by companies to enhance the safety of critical operations. For example, General Electric (GE) incorporated data analyzing technology in its manufacturing process in May 2020 for enhancing the quality of production and securing transactions. The rising adoption of advanced data analytics by a wide range of manufacturers across industries is thus aiding the speedy expansion of this market.
Regional Insights
Widespread Operations of Prominent Players in North America to Foster Market Growth
North America is projected to lead the blockchain market share for the upcoming years due to the strong presence and widening operations of tech giants such as Microsoft Corporation and IBM Corporation in the region. The increasing adoption of DLT-based solutions is another that is bolstering the market growth for the region. In 2019, the region’s market size was USD 0.95 billion.
The Asia Pacific region is projected to exhibit a substantial annual growth rate in the upcoming years backed by rising investments by governments and other business organizations in the region in advanced data analysis systems. The market in Europe is expected to grow on account of the increasing uptake of advanced virtual technologies by companies in the region. For example, companies in the UK made an investment of more than USD 130 million for utilizing products powered by data assembly technologies.
Competitive Landscape
Growing Focus on Operational Efficiency by Government Bodies to Encourage Innovation
Government agencies in North America are developing artificial intelligence-based technologies to improve their efficiency and lower operation costs. For example, the US Department of Health and Human Services (HHS) undertook an investment of USD 49 million for developing data-gathering artificial intelligence technologies in November 2019 to condense their operational costs. Further, companies are also actively partnering with their competitors to offer superior customer service and build enhanced portfolios.
Quick Buy - Blockchain Market Research Report:
Industry Development
March 2019: Microsoft Corporation, Tata Consultancy Services (TCS), and R3 technology (R3) developed a scalable cross-industry blockchain program for enabling end-users to enhance consumer experience and boost business value.
Major Table of Contents:
TOC Continued…!
Ask for Customization of this Report:
Have a Look at Related Research Insights:
Artificial Intelligence Market Size, Share & COVID-19 Impact Analysis, By Component (Hardware, Software, and Services), By Technology (Computer Vision, Machine Learning, Natural Language Processing, and Others), By Deployment (Cloud, On-premises), By Industry (Healthcare, Retail, IT & Telecom, BFSI, Automotive, Advertising & Media, Manufacturing, and Others) and Regional Forecast, 2020-2027
Product Life Cycle Management Market Size, Share & Industry Analysis, By Deployment (Cloud and On-Premises), By Industry (Discrete Industry and Process Industry), and Regional Forecast, 2019-2026
Facial Recognition Market Size, Share & Covid-19 Impact Analysis, By Component (Solutions, Services), By Technology (2D Facial Recognition, 3D Facial Recognition, Thermal Face Recognition, Skin Texture Analysis, and Others, By Application (Face Identification, Access Control, Security & Surveillance, and Others, By End-user (BFSI, Healthcare, Government & Defense, IT & Telecom, Retail & ecommerce), and Regional Forecast, 2020-2027
Smart Education and Learning Market Size, Share & COVID-19 Impact Analysis, By Component (Hardware, Software, Services), By Learning Mode (Collaborative Learning, Virtual Instructor Led Learning, Simulation-Based Learning, Social Learning, Blended Learning), By End User (Corporate, Academic, Government), and Regional Forecast, 2020-2027
Fiber Optics Market Size, Share & Industry Analysis, By Component (Hardware, Software, Services), By Application (Telecommunication, Smart Cities, Power Utilities, Aerospace and Defense, Industrial Automation and Control, Renewable Energy, Others), and Regional Forecast, 2020-2027
About us
Fortune Business Insights™ delivers accurate data and innovative corporate analysis, helping organizations of all sizes make appropriate decisions. We tailor novel solutions for our clients, assisting them to address various challenges distinct to their businesses. Our aim is to empower them with holistic market intelligence, providing a granular overview of the market they are operating in.
Contact Us:Fortune Business Insights™ Pvt. Ltd.308, Supreme Headquarters,Survey No. 36, Baner,Pune-Bangalore Highway,Pune - 411045, Maharashtra, India.Phone:US :+1 424 253 0390UK : +44 2071 939123APAC : +91 744 740 1245Email: sales@fortunebusinessinsights.com
You can also contact us/follow us on:
Facebook:
Twitter:
LinkedIn:
Read Press Release:
2021-06-24
New York, June 24, 2021 (GLOBE NEWSWIRE) -- Reportlinker.com announces the release of the report "Global Fiber Optics Industry" - 6 Billion in the year 2020, is projected to reach a revised size of US$8.6 Billion by 2027, growing at a CAGR of 9.3% over the period 2020-2027.Single Mode, one of the segments analyzed in the report, is projected to grow at a 9.5% CAGR to reach US$6.6 Billion by the end of the analysis period. After an early analysis of the business implications of the pandemic and its induced economic crisis, growth in the Multi Mode segment is readjusted to a revised 8.7% CAGR for the next 7-year period. This segment currently accounts for a 24.1% share of the global Fiber Optics market. - The U.S. Accounts for Over 13.9% of Global Market Size in 2020, While China is Forecast to Grow at a 11.1% CAGR for the Period of 2020-2027 - The Fiber Optics market in the U.S. is estimated at US$642.8 Million in the year 2020. The country currently accounts for a 13.89% share in the global market. China, the world second largest economy, is forecast to reach an estimated market size of US$2.5 Billion in the year 2027 trailing a CAGR of 11.1% through 2027. Among the other noteworthy geographic markets are Japan and Canada, each forecast to grow at 6.9% and 7.6% respectively over the 2020-2027 period. Within Europe, Germany is forecast to grow at approximately 7.8% CAGR while Rest of European market (as defined in the study) will reach US$2.5 Billion by the year 2027. - Select Competitors (Total 95 Featured)
Read the full report: CONTENTS I. METHODOLOGY II. EXECUTIVE SUMMARY 1. MARKET OVERVIEW Impact of COVID-19 Pandemic and Looming Global Recession: 2020 Marked as a Year of Disruption & Transformation EXHIBIT 1: World Economic Growth Projections (Real GDP, Annual % Change) for 2020 through 2022 Impact of the Pandemic on Fiber Optics Industry An Introduction to Fiber Optics Optical Fiber Fiber Optic Cable Fiber Optics: Incredibly Thin Fibers Lighting High-Speed Data Transmission Revolution EXHIBIT 2: World Fiber Optics Market by Cable Type (2021 & 2027): Percentage Breakdown of Sales for Single Mode, and Multi Mode EXHIBIT 3: World Fiber Optics Market by Fiber Type (2021 & 2027): Percentage Breakdown of Sales for Glass Optical Fiber, and Plastic Optical Fiber Limitations of Fiber Optics & Improvements Thereon Emerging Applications of Fiber Optics Global Market Prospects & Outlook Need for Higher Bandwidth in Modern Age Creates Ideal Fabric for Fiber Optics Market Focus on Scalable, High-Speed Communication Infrastructure Helps Fiber Optics Market Leap Forward Perceptible Factors Catalyzing Expansion of Global Fiber Optics Market Market Restrains Analysis by Application: Communication Remains Primary Application Segment Optical Fibers Need Further Improvements to Satiate Emerging Telecom Demands EXHIBIT 4: World Fiber Optics Market by Application (2021 & 2027): Percentage Breakdown of Sales for Communication, and Non-Communication Regional Analysis EXHIBIT 5: World Fiber Optics Market by Region: Percentage Breakdown of Sales for Developed and Developing Regions (2021 & 2027) EXHIBIT 6: World Fiber Optics Market - Geographic Regions Ranked by CAGR (Value) for 2020-2027: China, Asia-Pacific, Middle East, Latin America, Africa, USA, Canada, Europe, and Japan Competitive Landscape: Vendors Eye Product Development & Regional Expansion Recent Market Activity Select Global Brands 2. FOCUS ON SELECT PLAYERS 3. MARKET TRENDS & DRIVERS Increased Uptake Across Diverse End-user Industries Favors Present & Future Expansion of Fiber Optics Market Ongoing Expansion in Optical Communication Domain Underpins Revenue Growth Healthy Trajectory in OTN & FTTx Verticals Augurs Well Rising IP Traffic & Escalating Bandwidth Needs Bring Fiber Optics to the Fore EXHIBIT 7: Global IP Traffic Volume in Exabytes for the Years 2019 and 2022 A Look Into Global Internet User Base & Usage Patterns EXHIBIT 8: World Internet Penetration Rate (in %) by Geographic Region: March 2021 EXHIBIT 9: Smartphone, Tablets, and Laptops Shipments in Million Units for the Years 2019, 2021 and 2023 EXHIBIT 10: Smartphone Penetration Rate as Share of Total Population: 2016-2021 EXHIBIT 11: Global Wireless Communication Market (2019 & 2021): Percentage Breakdown of Traffic Volume by Mobile Device Type Proliferation of Bandwidth-Intensive Applications Steers Internet Consumption Volumes EXHIBIT 12: Breakdown of Global IP Traffic by Application Type (in %): 2019 & 2022 Robust Spending on Fiber Optic Infrastructure Across Telecom Verticals to Sustain Market Momentum Data Center Trends Elevate the Market Potential of Fiber Optics Emphasis on DCI Approach Generates Novel Opportunities Smart Cities Concept to Underpin Sales Growth in the Coming Years Smart Homes to Progressively Drive the Demand for Fiber Optics EXHIBIT 13: Global Smart Homes Market by Category in US$ Billion for the Years 2020 and 2022 Fiber Optic Technology Advances in Medical Industry Improve Patient Care Uptake of Loose-Tube & Tight-Buffered Cable Designs Remains Robust Sustained Demand for Single-Mode, Multi-Mode & POF Cables Augurs Well Glass Fiber Optics Remains the Dominant Category Novel Opportunities for Plastic Fibers Growing Demand for Active Optical Cables Bodes Well Rapidly Evolving Use Case of Fiber Optic Sensors Gives Impetus to Market Expansion EXHIBIT 14: Global Fiber Optic Sensors Market (2019 & 2024): Breakdown of Sales in US$ Million by Geographic Region Technology Improvements & Innovative Applications to Widen the Addressable Market Advanced Components & Sophisticated Working Principle Augment Demand Twisted Fiber Optic Light Enhances Internet Speed Advancements in PIC Technology 4. GLOBAL MARKET PERSPECTIVE Table 1: World Current & Future Analysis for Fiber Optics by Geographic Region - USA, Canada, Japan, China, Europe, Asia-Pacific, Latin America, Middle East and Africa Markets - Independent Analysis of Annual Sales in US$ Thousand for Years 2020 through 2027 and % CAGR Table 2: World Historic Review for Fiber Optics by Geographic Region - USA, Canada, Japan, China, Europe, Asia-Pacific, Latin America, Middle East and Africa Markets - Independent Analysis of Annual Sales in US$ Thousand for Years 2012 through 2019 and % CAGR Table 3: World 15-Year Perspective for Fiber Optics by Geographic Region - Percentage Breakdown of Value Sales for USA, Canada, Japan, China, Europe, Asia-Pacific, Latin America, Middle East and Africa Markets for Years 2012, 2020 & 2027 Table 4: World Current & Future Analysis for Single Mode by Geographic Region - USA, Canada, Japan, China, Europe, Asia-Pacific, Latin America, Middle East and Africa Markets - Independent Analysis of Annual Sales in US$ Thousand for Years 2020 through 2027 and % CAGR Table 5: World Historic Review for Single Mode by Geographic Region - USA, Canada, Japan, China, Europe, Asia-Pacific, Latin America, Middle East and Africa Markets - Independent Analysis of Annual Sales in US$ Thousand for Years 2012 through 2019 and % CAGR Table 6: World 15-Year Perspective for Single Mode by Geographic Region - Percentage Breakdown of Value Sales for USA, Canada, Japan, China, Europe, Asia-Pacific, Latin America, Middle East and Africa for Years 2012, 2020 & 2027 Table 7: World Current & Future Analysis for Multi Mode by Geographic Region - USA, Canada, Japan, China, Europe, Asia-Pacific, Latin America, Middle East and Africa Markets - Independent Analysis of Annual Sales in US$ Thousand for Years 2020 through 2027 and % CAGR Table 8: World Historic Review for Multi Mode by Geographic Region - USA, Canada, Japan, China, Europe, Asia-Pacific, Latin America, Middle East and Africa Markets - Independent Analysis of Annual Sales in US$ Thousand for Years 2012 through 2019 and % CAGR Table 9: World 15-Year Perspective for Multi Mode by Geographic Region - Percentage Breakdown of Value Sales for USA, Canada, Japan, China, Europe, Asia-Pacific, Latin America, Middle East and Africa for Years 2012, 2020 & 2027 Table 10: World Current & Future Analysis for Glass Optical Fiber by Geographic Region - USA, Canada, Japan, China, Europe, Asia-Pacific, Latin America, Middle East and Africa Markets - Independent Analysis of Annual Sales in US$ Thousand for Years 2020 through 2027 and % CAGR Table 11: World Historic Review for Glass Optical Fiber by Geographic Region - USA, Canada, Japan, China, Europe, Asia-Pacific, Latin America, Middle East and Africa Markets - Independent Analysis of Annual Sales in US$ Thousand for Years 2012 through 2019 and % CAGR Table 12: World 15-Year Perspective for Glass Optical Fiber by Geographic Region - Percentage Breakdown of Value Sales for USA, Canada, Japan, China, Europe, Asia-Pacific, Latin America, Middle East and Africa for Years 2012, 2020 & 2027 Table 13: World Current & Future Analysis for Plastic Optical Fiber by Geographic Region - USA, Canada, Japan, China, Europe, Asia-Pacific, Latin America, Middle East and Africa Markets - Independent Analysis of Annual Sales in US$ Thousand for Years 2020 through 2027 and % CAGR Table 14: World Historic Review for Plastic Optical Fiber by Geographic Region - USA, Canada, Japan, China, Europe, Asia-Pacific, Latin America, Middle East and Africa Markets - Independent Analysis of Annual Sales in US$ Thousand for Years 2012 through 2019 and % CAGR Table 15: World 15-Year Perspective for Plastic Optical Fiber by Geographic Region - Percentage Breakdown of Value Sales for USA, Canada, Japan, China, Europe, Asia-Pacific, Latin America, Middle East and Africa for Years 2012, 2020 & 2027 Table 16: World Current & Future Analysis for Communication by Geographic Region - USA, Canada, Japan, China, Europe, Asia-Pacific, Latin America, Middle East and Africa Markets - Independent Analysis of Annual Sales in US$ Thousand for Years 2020 through 2027 and % CAGR Table 17: World Historic Review for Communication by Geographic Region - USA, Canada, Japan, China, Europe, Asia-Pacific, Latin America, Middle East and Africa Markets - Independent Analysis of Annual Sales in US$ Thousand for Years 2012 through 2019 and % CAGR Table 18: World 15-Year Perspective for Communication by Geographic Region - Percentage Breakdown of Value Sales for USA, Canada, Japan, China, Europe, Asia-Pacific, Latin America, Middle East and Africa for Years 2012, 2020 & 2027 Table 19: World Current & Future Analysis for Non-Communication by Geographic Region - USA, Canada, Japan, China, Europe, Asia-Pacific, Latin America, Middle East and Africa Markets - Independent Analysis of Annual Sales in US$ Thousand for Years 2020 through 2027 and % CAGR Table 20: World Historic Review for Non-Communication by Geographic Region - USA, Canada, Japan, China, Europe, Asia-Pacific, Latin America, Middle East and Africa Markets - Independent Analysis of Annual Sales in US$ Thousand for Years 2012 through 2019 and % CAGR Table 21: World 15-Year Perspective for Non-Communication by Geographic Region - Percentage Breakdown of Value Sales for USA, Canada, Japan, China, Europe, Asia-Pacific, Latin America, Middle East and Africa for Years 2012, 2020 & 2027 III. MARKET ANALYSIS UNITED STATES Table 22: USA Current & Future Analysis for Fiber Optics by Cable Type - Single Mode and Multi Mode - Independent Analysis of Annual Sales in US$ Thousand for the Years 2020 through 2027 and % CAGR Table 23: USA Historic Review for Fiber Optics by Cable Type - Single Mode and Multi Mode Markets - Independent Analysis of Annual Sales in US$ Thousand for Years 2012 through 2019 and % CAGR Table 24: USA 15-Year Perspective for Fiber Optics by Cable Type - Percentage Breakdown of Value Sales for Single Mode and Multi Mode for the Years 2012, 2020 & 2027 Table 25: USA Current & Future Analysis for Fiber Optics by Fiber Type - Glass Optical Fiber and Plastic Optical Fiber - Independent Analysis of Annual Sales in US$ Thousand for the Years 2020 through 2027 and % CAGR Table 26: USA Historic Review for Fiber Optics by Fiber Type - Glass Optical Fiber and Plastic Optical Fiber Markets - Independent Analysis of Annual Sales in US$ Thousand for Years 2012 through 2019 and % CAGR Table 27: USA 15-Year Perspective for Fiber Optics by Fiber Type - Percentage Breakdown of Value Sales for Glass Optical Fiber and Plastic Optical Fiber for the Years 2012, 2020 & 2027 Table 28: USA Current & Future Analysis for Fiber Optics by Application - Communication and Non-Communication - Independent Analysis of Annual Sales in US$ Thousand for the Years 2020 through 2027 and % CAGR Table 29: USA Historic Review for Fiber Optics by Application - Communication and Non-Communication Markets - Independent Analysis of Annual Sales in US$ Thousand for Years 2012 through 2019 and % CAGR Table 30: USA 15-Year Perspective for Fiber Optics by Application - Percentage Breakdown of Value Sales for Communication and Non-Communication for the Years 2012, 2020 & 2027 CANADA Table 31: Canada Current & Future Analysis for Fiber Optics by Cable Type - Single Mode and Multi Mode - Independent Analysis of Annual Sales in US$ Thousand for the Years 2020 through 2027 and % CAGR Table 32: Canada Historic Review for Fiber Optics by Cable Type - Single Mode and Multi Mode Markets - Independent Analysis of Annual Sales in US$ Thousand for Years 2012 through 2019 and % CAGR Table 33: Canada 15-Year Perspective for Fiber Optics by Cable Type - Percentage Breakdown of Value Sales for Single Mode and Multi Mode for the Years 2012, 2020 & 2027 Table 34: Canada Current & Future Analysis for Fiber Optics by Fiber Type - Glass Optical Fiber and Plastic Optical Fiber - Independent Analysis of Annual Sales in US$ Thousand for the Years 2020 through 2027 and % CAGR Table 35: Canada Historic Review for Fiber Optics by Fiber Type - Glass Optical Fiber and Plastic Optical Fiber Markets - Independent Analysis of Annual Sales in US$ Thousand for Years 2012 through 2019 and % CAGR Table 36: Canada 15-Year Perspective for Fiber Optics by Fiber Type - Percentage Breakdown of Value Sales for Glass Optical Fiber and Plastic Optical Fiber for the Years 2012, 2020 & 2027 Table 37: Canada Current & Future Analysis for Fiber Optics by Application - Communication and Non-Communication - Independent Analysis of Annual Sales in US$ Thousand for the Years 2020 through 2027 and % CAGR Table 38: Canada Historic Review for Fiber Optics by Application - Communication and Non-Communication Markets - Independent Analysis of Annual Sales in US$ Thousand for Years 2012 through 2019 and % CAGR Table 39: Canada 15-Year Perspective for Fiber Optics by Application - Percentage Breakdown of Value Sales for Communication and Non-Communication for the Years 2012, 2020 & 2027 JAPAN Table 40: Japan Current & Future Analysis for Fiber Optics by Cable Type - Single Mode and Multi Mode - Independent Analysis of Annual Sales in US$ Thousand for the Years 2020 through 2027 and % CAGR Table 41: Japan Historic Review for Fiber Optics by Cable Type - Single Mode and Multi Mode Markets - Independent Analysis of Annual Sales in US$ Thousand for Years 2012 through 2019 and % CAGR Table 42: Japan 15-Year Perspective for Fiber Optics by Cable Type - Percentage Breakdown of Value Sales for Single Mode and Multi Mode for the Years 2012, 2020 & 2027 Table 43: Japan Current & Future Analysis for Fiber Optics by Fiber Type - Glass Optical Fiber and Plastic Optical Fiber - Independent Analysis of Annual Sales in US$ Thousand for the Years 2020 through 2027 and % CAGR Table 44: Japan Historic Review for Fiber Optics by Fiber Type - Glass Optical Fiber and Plastic Optical Fiber Markets - Independent Analysis of Annual Sales in US$ Thousand for Years 2012 through 2019 and % CAGR Table 45: Japan 15-Year Perspective for Fiber Optics by Fiber Type - Percentage Breakdown of Value Sales for Glass Optical Fiber and Plastic Optical Fiber for the Years 2012, 2020 & 2027 Table 46: Japan Current & Future Analysis for Fiber Optics by Application - Communication and Non-Communication - Independent Analysis of Annual Sales in US$ Thousand for the Years 2020 through 2027 and % CAGR Table 47: Japan Historic Review for Fiber Optics by Application - Communication and Non-Communication Markets - Independent Analysis of Annual Sales in US$ Thousand for Years 2012 through 2019 and % CAGR Table 48: Japan 15-Year Perspective for Fiber Optics by Application - Percentage Breakdown of Value Sales for Communication and Non-Communication for the Years 2012, 2020 & 2027 CHINA Table 49: China Current & Future Analysis for Fiber Optics by Cable Type - Single Mode and Multi Mode - Independent Analysis of Annual Sales in US$ Thousand for the Years 2020 through 2027 and % CAGR Table 50: China Historic Review for Fiber Optics by Cable Type - Single Mode and Multi Mode Markets - Independent Analysis of Annual Sales in US$ Thousand for Years 2012 through 2019 and % CAGR Table 51: China 15-Year Perspective for Fiber Optics by Cable Type - Percentage Breakdown of Value Sales for Single Mode and Multi Mode for the Years 2012, 2020 & 2027 Table 52: China Current & Future Analysis for Fiber Optics by Fiber Type - Glass Optical Fiber and Plastic Optical Fiber - Independent Analysis of Annual Sales in US$ Thousand for the Years 2020 through 2027 and % CAGR Table 53: China Historic Review for Fiber Optics by Fiber Type - Glass Optical Fiber and Plastic Optical Fiber Markets - Independent Analysis of Annual Sales in US$ Thousand for Years 2012 through 2019 and % CAGR Table 54: China 15-Year Perspective for Fiber Optics by Fiber Type - Percentage Breakdown of Value Sales for Glass Optical Fiber and Plastic Optical Fiber for the Years 2012, 2020 & 2027 Table 55: China Current & Future Analysis for Fiber Optics by Application - Communication and Non-Communication - Independent Analysis of Annual Sales in US$ Thousand for the Years 2020 through 2027 and % CAGR Table 56: China Historic Review for Fiber Optics by Application - Communication and Non-Communication Markets - Independent Analysis of Annual Sales in US$ Thousand for Years 2012 through 2019 and % CAGR Table 57: China 15-Year Perspective for Fiber Optics by Application - Percentage Breakdown of Value Sales for Communication and Non-Communication for the Years 2012, 2020 & 2027 EUROPE Table 58: Europe Current & Future Analysis for Fiber Optics by Geographic Region - France, Germany, Italy, UK, Spain, Russia and Rest of Europe Markets - Independent Analysis of Annual Sales in US$ Thousand for Years 2020 through 2027 and % CAGR Table 59: Europe Historic Review for Fiber Optics by Geographic Region - France, Germany, Italy, UK, Spain, Russia and Rest of Europe Markets - Independent Analysis of Annual Sales in US$ Thousand for Years 2012 through 2019 and % CAGR Table 60: Europe 15-Year Perspective for Fiber Optics by Geographic Region - Percentage Breakdown of Value Sales for France, Germany, Italy, UK, Spain, Russia and Rest of Europe Markets for Years 2012, 2020 & 2027 Table 61: Europe Current & Future Analysis for Fiber Optics by Cable Type - Single Mode and Multi Mode - Independent Analysis of Annual Sales in US$ Thousand for the Years 2020 through 2027 and % CAGR Table 62: Europe Historic Review for Fiber Optics by Cable Type - Single Mode and Multi Mode Markets - Independent Analysis of Annual Sales in US$ Thousand for Years 2012 through 2019 and % CAGR Table 63: Europe 15-Year Perspective for Fiber Optics by Cable Type - Percentage Breakdown of Value Sales for Single Mode and Multi Mode for the Years 2012, 2020 & 2027 Table 64: Europe Current & Future Analysis for Fiber Optics by Fiber Type - Glass Optical Fiber and Plastic Optical Fiber - Independent Analysis of Annual Sales in US$ Thousand for the Years 2020 through 2027 and % CAGR Table 65: Europe Historic Review for Fiber Optics by Fiber Type - Glass Optical Fiber and Plastic Optical Fiber Markets - Independent Analysis of Annual Sales in US$ Thousand for Years 2012 through 2019 and % CAGR Table 66: Europe 15-Year Perspective for Fiber Optics by Fiber Type - Percentage Breakdown of Value Sales for Glass Optical Fiber and Plastic Optical Fiber for the Years 2012, 2020 & 2027 Table 67: Europe Current & Future Analysis for Fiber Optics by Application - Communication and Non-Communication - Independent Analysis of Annual Sales in US$ Thousand for the Years 2020 through 2027 and % CAGR Table 68: Europe Historic Review for Fiber Optics by Application - Communication and Non-Communication Markets - Independent Analysis of Annual Sales in US$ Thousand for Years 2012 through 2019 and % CAGR Table 69: Europe 15-Year Perspective for Fiber Optics by Application - Percentage Breakdown of Value Sales for Communication and Non-Communication for the Years 2012, 2020 & 2027 FRANCE Table 70: France Current & Future Analysis for Fiber Optics by Cable Type - Single Mode and Multi Mode - Independent Analysis of Annual Sales in US$ Thousand for the Years 2020 through 2027 and % CAGR Table 71: France Historic Review for Fiber Optics by Cable Type - Single Mode and Multi Mode Markets - Independent Analysis of Annual Sales in US$ Thousand for Years 2012 through 2019 and % CAGR Table 72: France 15-Year Perspective for Fiber Optics by Cable Type - Percentage Breakdown of Value Sales for Single Mode and Multi Mode for the Years 2012, 2020 & 2027 Table 73: France Current & Future Analysis for Fiber Optics by Fiber Type - Glass Optical Fiber and Plastic Optical Fiber - Independent Analysis of Annual Sales in US$ Thousand for the Years 2020 through 2027 and % CAGR Table 74: France Historic Review for Fiber Optics by Fiber Type - Glass Optical Fiber and Plastic Optical Fiber Markets - Independent Analysis of Annual Sales in US$ Thousand for Years 2012 through 2019 and % CAGR Table 75: France 15-Year Perspective for Fiber Optics by Fiber Type - Percentage Breakdown of Value Sales for Glass Optical Fiber and Plastic Optical Fiber for the Years 2012, 2020 & 2027 Table 76: France Current & Future Analysis for Fiber Optics by Application - Communication and Non-Communication - Independent Analysis of Annual Sales in US$ Thousand for the Years 2020 through 2027 and % CAGR Table 77: France Historic Review for Fiber Optics by Application - Communication and Non-Communication Markets - Independent Analysis of Annual Sales in US$ Thousand for Years 2012 through 2019 and % CAGR Table 78: France 15-Year Perspective for Fiber Optics by Application - Percentage Breakdown of Value Sales for Communication and Non-Communication for the Years 2012, 2020 & 2027 GERMANY Table 79: Germany Current & Future Analysis for Fiber Optics by Cable Type - Single Mode and Multi Mode - Independent Analysis of Annual Sales in US$ Thousand for the Years 2020 through 2027 and % CAGR Table 80: Germany Historic Review for Fiber Optics by Cable Type - Single Mode and Multi Mode Markets - Independent Analysis of Annual Sales in US$ Thousand for Years 2012 through 2019 and % CAGR Table 81: Germany 15-Year Perspective for Fiber Optics by Cable Type - Percentage Breakdown of Value Sales for Single Mode and Multi Mode for the Years 2012, 2020 & 2027 Table 82: Germany Current & Future Analysis for Fiber Optics by Fiber Type - Glass Optical Fiber and Plastic Optical Fiber - Independent Analysis of Annual Sales in US$ Thousand for the Years 2020 through 2027 and % CAGR Table 83: Germany Historic Review for Fiber Optics by Fiber Type - Glass Optical Fiber and Plastic Optical Fiber Markets - Independent Analysis of Annual Sales in US$ Thousand for Years 2012 through 2019 and % CAGR Table 84: Germany 15-Year Perspective for Fiber Optics by Fiber Type - Percentage Breakdown of Value Sales for Glass Optical Fiber and Plastic Optical Fiber for the Years 2012, 2020 & 2027 Table 85: Germany Current & Future Analysis for Fiber Optics by Application - Communication and Non-Communication - Independent Analysis of Annual Sales in US$ Thousand for the Years 2020 through 2027 and % CAGR Table 86: Germany Historic Review for Fiber Optics by Application - Communication and Non-Communication Markets - Independent Analysis of Annual Sales in US$ Thousand for Years 2012 through 2019 and % CAGR Table 87: Germany 15-Year Perspective for Fiber Optics by Application - Percentage Breakdown of Value Sales for Communication and Non-Communication for the Years 2012, 2020 & 2027 ITALY Table 88: Italy Current & Future Analysis for Fiber Optics by Cable Type - Single Mode and Multi Mode - Independent Analysis of Annual Sales in US$ Thousand for the Years 2020 through 2027 and % CAGR Table 89: Italy Historic Review for Fiber Optics by Cable Type - Single Mode and Multi Mode Markets - Independent Analysis of Annual Sales in US$ Thousand for Years 2012 through 2019 and % CAGR Table 90: Italy 15-Year Perspective for Fiber Optics by Cable Type - Percentage Breakdown of Value Sales for Single Mode and Multi Mode for the Years 2012, 2020 & 2027 Table 91: Italy Current & Future Analysis for Fiber Optics by Fiber Type - Glass Optical Fiber and Plastic Optical Fiber - Independent Analysis of Annual Sales in US$ Thousand for the Years 2020 through 2027 and % CAGR Table 92: Italy Historic Review for Fiber Optics by Fiber Type - Glass Optical Fiber and Plastic Optical Fiber Markets - Independent Analysis of Annual Sales in US$ Thousand for Years 2012 through 2019 and % CAGR Table 93: Italy 15-Year Perspective for Fiber Optics by Fiber Type - Percentage Breakdown of Value Sales for Glass Optical Fiber and Plastic Optical Fiber for the Years 2012, 2020 & 2027 Table 94: Italy Current & Future Analysis for Fiber Optics by Application - Communication and Non-Communication - Independent Analysis of Annual Sales in US$ Thousand for the Years 2020 through 2027 and % CAGR Table 95: Italy Historic Review for Fiber Optics by Application - Communication and Non-Communication Markets - Independent Analysis of Annual Sales in US$ Thousand for Years 2012 through 2019 and % CAGR Table 96: Italy 15-Year Perspective for Fiber Optics by Application - Percentage Breakdown of Value Sales for Communication and Non-Communication for the Years 2012, 2020 & 2027 UNITED KINGDOM Table 97: UK Current & Future Analysis for Fiber Optics by Cable Type - Single Mode and Multi Mode - Independent Analysis of Annual Sales in US$ Thousand for the Years 2020 through 2027 and % CAGR Table 98: UK Historic Review for Fiber Optics by Cable Type - Single Mode and Multi Mode Markets - Independent Analysis of Annual Sales in US$ Thousand for Years 2012 through 2019 and % CAGR Table 99: UK 15-Year Perspective for Fiber Optics by Cable Type - Percentage Breakdown of Value Sales for Single Mode and Multi Mode for the Years 2012, 2020 & 2027 Table 100: UK Current & Future Analysis for Fiber Optics by Fiber Type - Glass Optical Fiber and Plastic Optical Fiber - Independent Analysis of Annual Sales in US$ Thousand for the Years 2020 through 2027 and % CAGR Table 101: UK Historic Review for Fiber Optics by Fiber Type - Glass Optical Fiber and Plastic Optical Fiber Markets - Independent Analysis of Annual Sales in US$ Thousand for Years 2012 through 2019 and % CAGR Table 102: UK 15-Year Perspective for Fiber Optics by Fiber Type - Percentage Breakdown of Value Sales for Glass Optical Fiber and Plastic Optical Fiber for the Years 2012, 2020 & 2027 Table 103: UK Current & Future Analysis for Fiber Optics by Application - Communication and Non-Communication - Independent Analysis of Annual Sales in US$ Thousand for the Years 2020 through 2027 and % CAGR Table 104: UK Historic Review for Fiber Optics by Application - Communication and Non-Communication Markets - Independent Analysis of Annual Sales in US$ Thousand for Years 2012 through 2019 and % CAGR Table 105: UK 15-Year Perspective for Fiber Optics by Application - Percentage Breakdown of Value Sales for Communication and Non-Communication for the Years 2012, 2020 & 2027 SPAIN Table 106: Spain Current & Future Analysis for Fiber Optics by Cable Type - Single Mode and Multi Mode - Independent Analysis of Annual Sales in US$ Thousand for the Years 2020 through 2027 and % CAGR Table 107: Spain Historic Review for Fiber Optics by Cable Type - Single Mode and Multi Mode Markets - Independent Analysis of Annual Sales in US$ Thousand for Years 2012 through 2019 and % CAGR Table 108: Spain 15-Year Perspective for Fiber Optics by Cable Type - Percentage Breakdown of Value Sales for Single Mode and Multi Mode for the Years 2012, 2020 & 2027 Table 109: Spain Current & Future Analysis for Fiber Optics by Fiber Type - Glass Optical Fiber and Plastic Optical Fiber - Independent Analysis of Annual Sales in US$ Thousand for the Years 2020 through 2027 and % CAGR Table 110: Spain Historic Review for Fiber Optics by Fiber Type - Glass Optical Fiber and Plastic Optical Fiber Markets - Independent Analysis of Annual Sales in US$ Thousand for Years 2012 through 2019 and % CAGR Table 111: Spain 15-Year Perspective for Fiber Optics by Fiber Type - Percentage Breakdown of Value Sales for Glass Optical Fiber and Plastic Optical Fiber for the Years 2012, 2020 & 2027 Table 112: Spain Current & Future Analysis for Fiber Optics by Application - Communication and Non-Communication - Independent Analysis of Annual Sales in US$ Thousand for the Years 2020 through 2027 and % CAGR Table 113: Spain Historic Review for Fiber Optics by Application - Communication and Non-Communication Markets - Independent Analysis of Annual Sales in US$ Thousand for Years_x000DRead the full report: ReportlinkerReportLinker is an award-winning market research solution. Reportlinker finds and organizes the latest industry data so you get all the market research you need - instantly, in one place.__________________________
100 项与 Life Optics 相关的药物交易
登录后查看更多信息
100 项与 Life Optics 相关的转化医学
登录后查看更多信息
组织架构
使用我们的机构树数据加速您的研究。
登录
或
管线布局
2026年02月09日管线快照
无数据报导
登录后保持更新
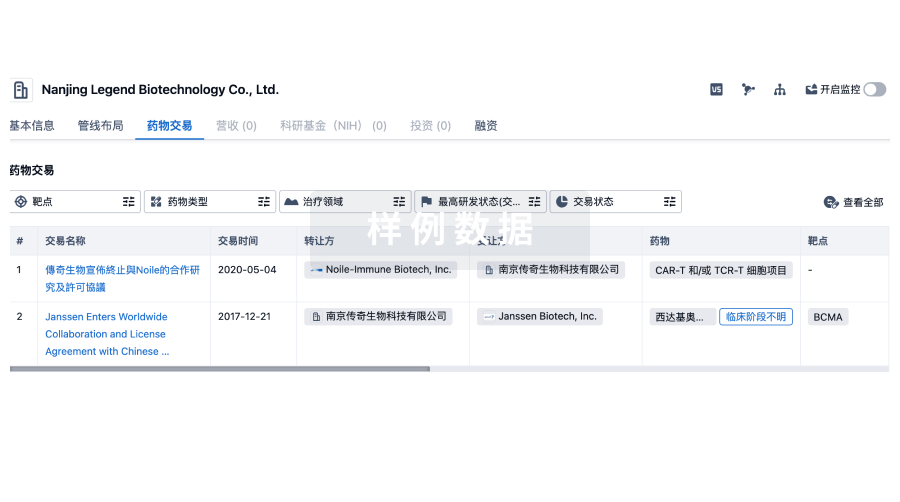
药物交易
使用我们的药物交易数据加速您的研究。
登录
或
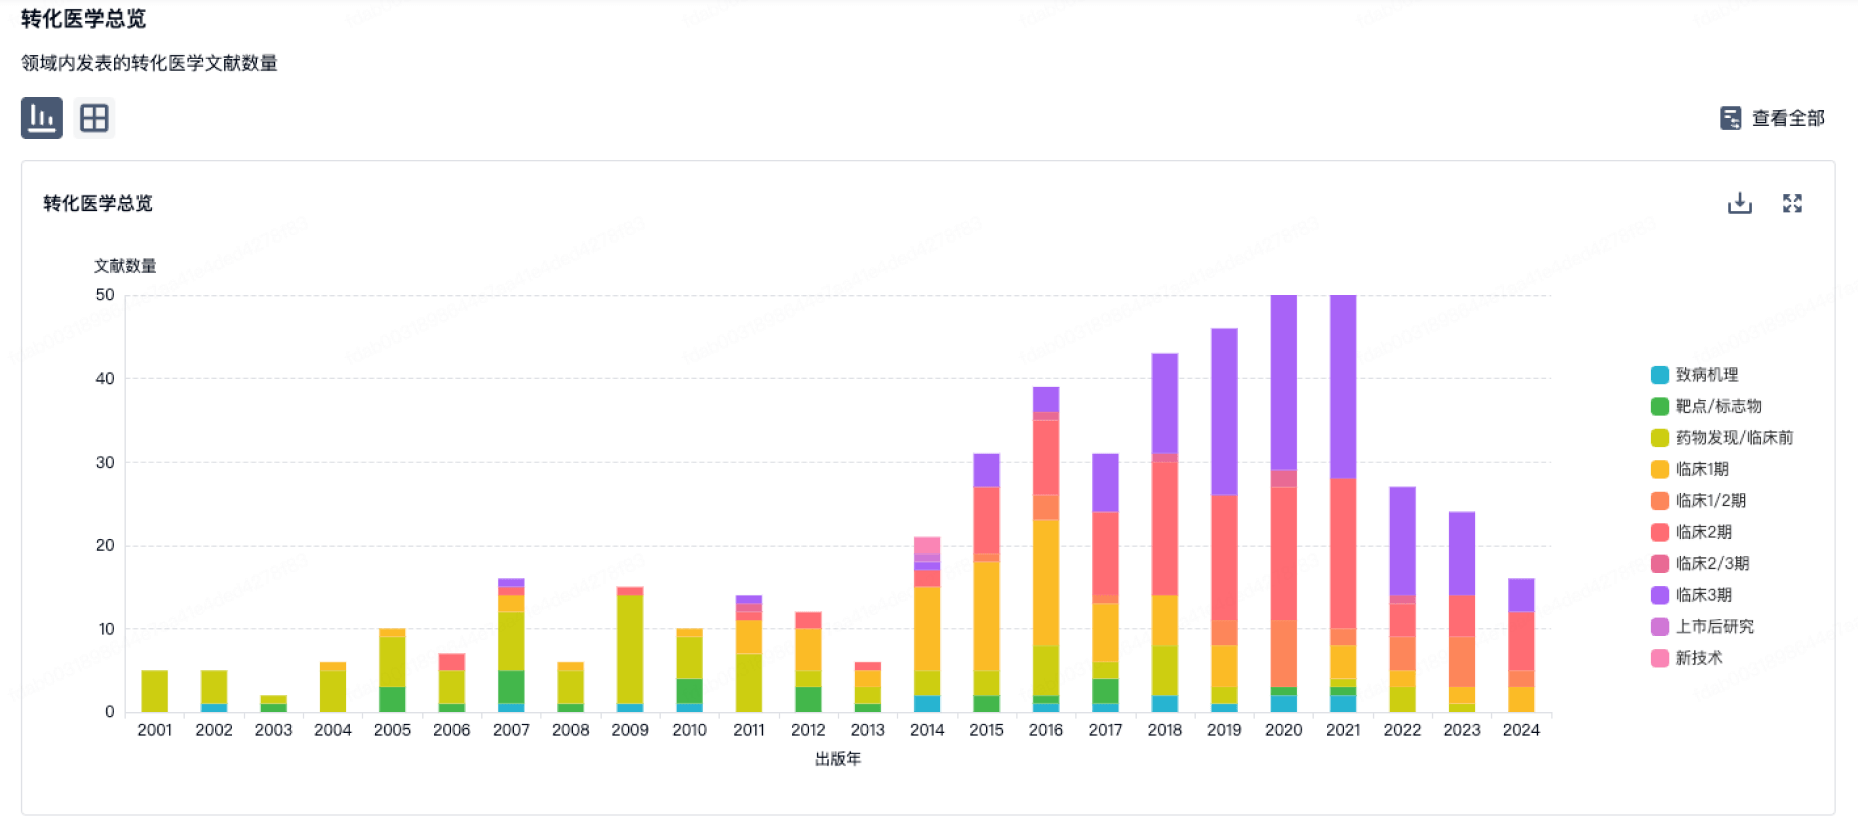
转化医学
使用我们的转化医学数据加速您的研究。
登录
或
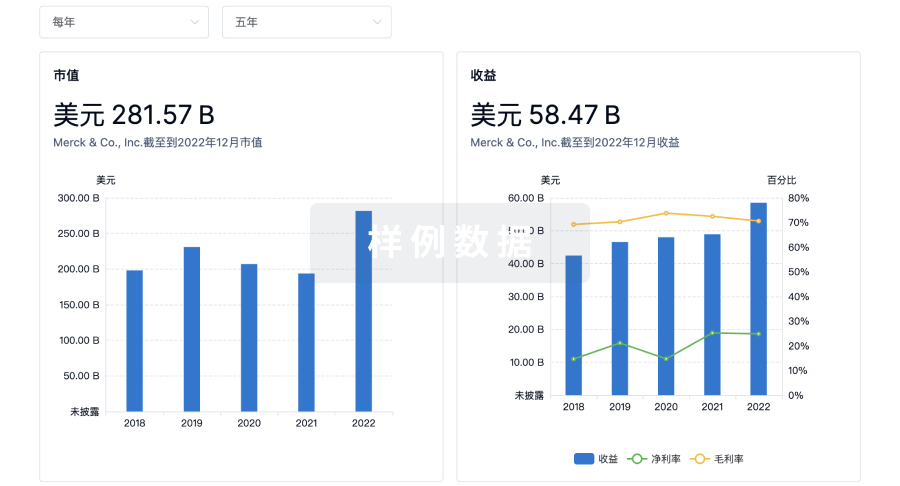
营收
使用 Synapse 探索超过 36 万个组织的财务状况。
登录
或
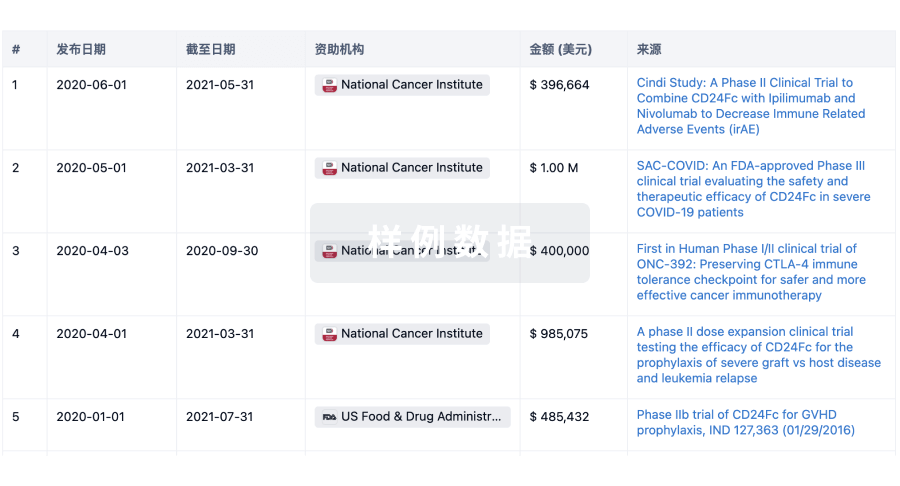
科研基金(NIH)
访问超过 200 万项资助和基金信息,以提升您的研究之旅。
登录
或
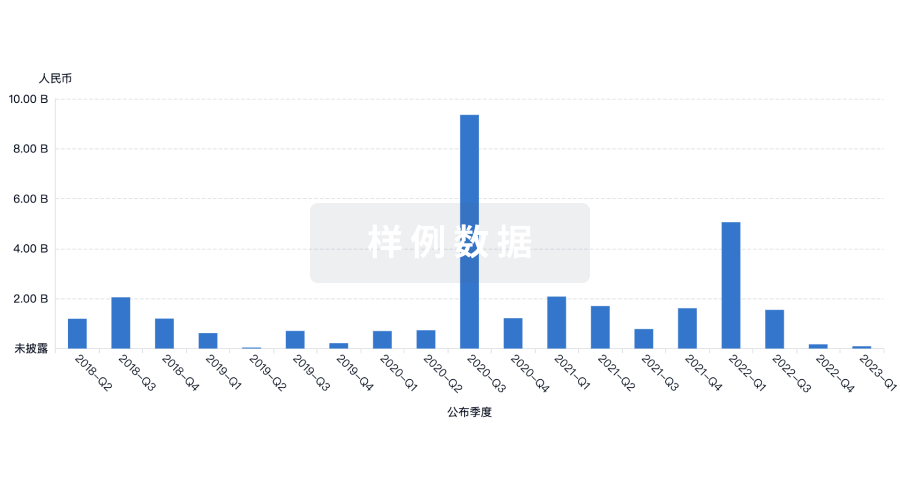
投资
深入了解从初创企业到成熟企业的最新公司投资动态。
登录
或
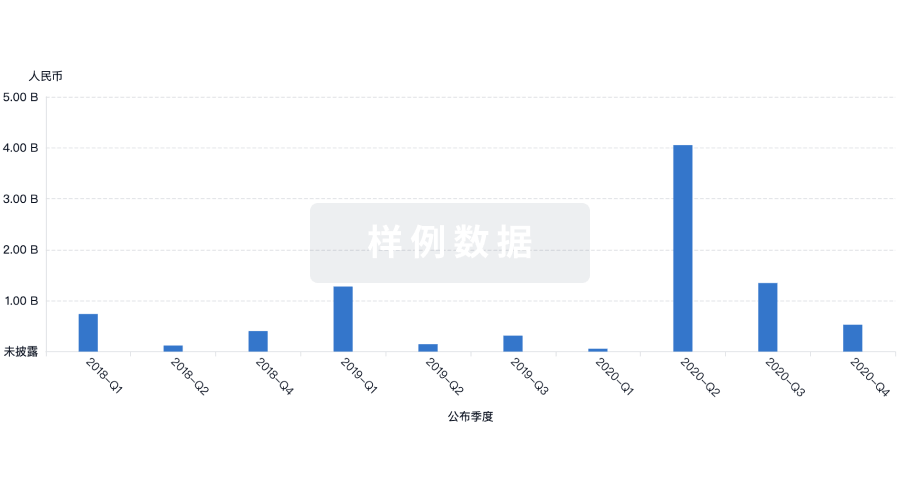
融资
发掘融资趋势以验证和推进您的投资机会。
登录
或
生物医药百科问答
全新生物医药AI Agent 覆盖科研全链路,让突破性发现快人一步
立即开始免费试用!
智慧芽新药情报库是智慧芽专为生命科学人士构建的基于AI的创新药情报平台,助您全方位提升您的研发与决策效率。
立即开始数据试用!
智慧芽新药库数据也通过智慧芽数据服务平台,以API或者数据包形式对外开放,助您更加充分利用智慧芽新药情报信息。
生物序列数据库
生物药研发创新
免费使用
化学结构数据库
小分子化药研发创新
免费使用