预约演示
更新于:2025-05-07
The Monterey Stockholders Group LLC
私营公司|Massachusetts, United States
私营公司|Massachusetts, United States
更新于:2025-05-07
概览
关联
100 项与 The Monterey Stockholders Group LLC 相关的临床结果
登录后查看更多信息
0 项与 The Monterey Stockholders Group LLC 相关的专利(医药)
登录后查看更多信息
1
项与 The Monterey Stockholders Group LLC 相关的新闻(医药)2018-08-01
TAMPA, Fla., Aug. 01, 2018 (GLOBE NEWSWIRE) -- Kforce Inc. (Nasdaq: KFRC), a provider of professional staffing services and solutions, today announced results for its second quarter of 2018. Revenues for the quarter ended June 30, 2018 were $358.6 million compared to $340.3 million for the quarter ended June 30, 2017, an increase of 5.4%. Net income for the quarter ended June 30, 2018 was $16.3 million, or $0.65 per share, as compared to $11.1 million, or $0.44 per share, for the quarter ended June 30, 2017. David L. Dunkel, Chairman and CEO, commented, “We are very pleased with our second quarter results as our year-over-year growth rate in our largest business, Tech Flex, meaningfully accelerated to 9.8% from 6.7% in the first quarter of 2018 while also improving our Tech Flex gross profit margin by 30 basis points year-over-year. We reached the first milestone in our continued objective of providing greater levels of profitability as our business grows with operating margins in the second quarter of 6.4%. We are firmly on the path of reaching our next milestone of achieving an operating margin of at least 7.5% when quarterly revenues reach $400 million. As we head into the second half of 2018, we expect continued strength in our Tech Flex business, as companies continue to invest in technology to more effectively and efficiently meet the needs of their customers and improve their profitability, and are also focused on positioning our FA Flex business for future growth. I want to thank all of our clients, consultants and core employees for making our mutual success possible." Joseph J. Liberatore, President, said, “We believe that the broad-based growth we are experiencing in Tech Flex is a result of the actions taken and investments made over the last couple of years to better segment our client portfolio, optimize the alignment of our revenue-generating associates within our client portfolios, and improve the productivity of our associates. The productivity of our revenue-generating associates has improved approximately 14% on a year-over-year basis. We expect to further accelerate Tech Flex revenue growth in the third quarter of 2018, while also continuing to improve productivity." Mr. Liberatore noted additional operational results for the second quarter include: Flex revenues of $342.1 million in Q2 2018 increased 5.6% from $324.0 million in Q2 2017.Quarterly year-over-year growth in Flex revenues for Tech and GS was 9.8% and 18.2%, respectively, while FA experienced a decrease of 9.4%. David M. Kelly, Chief Financial Officer, said, “Our Flex gross profit margins in Tech improved 30 basis points on a year-over-year basis in the second quarter, which we believe is reflective of strong demand and our focus around pricing discipline as well as the mix of growth that we are experiencing within our client portfolio." Mr. Kelly continued, "Operating cash flows were $28 million in the quarter and our profitability continues to improve as revenues grow. We are pleased to announce that our Board of Directors has approved a 50% increase in our quarterly dividend, which better aligns to our objective of efficiently and consistently returning capital to shareholders. The third quarter cash dividend of $0.18 per share, up from $0.12 per share in the second quarter, will be payable on September 21, 2018 to shareholders of record as of the close of business on September 7, 2018." Looking forward to the third quarter of 2018, there will be 63 billing days, which is the same as the third quarter of 2017, as compared to 64 billing days in second quarter of 2018. The revenue per billing day in the second quarter of 2018 was $5.6 million. Current estimates for the third quarter of 2018 are: Revenue of $359 million to $364 million Earnings per share of $0.65 to $0.67Gross profit margin of 29.7% to 29.9%Flex gross profit margin of 26.9% to 27.1%SG&A expense as a percent of revenue of 22.7% to 22.9%Operating margin of 6.4% to 6.6%Effective tax rate of 25.7% On Wednesday, August 1, 2018, Kforce will host a conference call to discuss these results. The call will begin at 8:30 a.m. Eastern Time. The prepared remarks for this call are available on the Investor Relations page of the Kforce Inc. website (http://investor.kforce.com/) under Events & Presentations. The dial-in number is (877) 344-3890. The conference passcode is Kforce. The replay of the call will be available from 11:30 a.m. Eastern Time, Wednesday, August 1, 2018 through August 8, 2018 by dialing (855) 859-2056, passcode 1596885. This call is being webcast by Shareholder.com and can be accessed on the Investor Relations page of the Kforce Inc. website (http://investor.kforce.com/). The webcast replay will be available until August 8, 2018. About KforceKforce (Nasdaq: KFRC) is a professional staffing services and solutions firm that specializes in the areas of Technology and Finance & Accounting. Each year, our network of over 50 offices and two national recruiting centers provide opportunities for 36,000 highly skilled professionals who work with over 4,000 clients, including 70% of the Fortune 100. At Kforce, our promise is to deliver great results through strategic partnership and knowledge sharing. For more information, please visit our Web site at http://www.kforce.com. Certain of the above statements contained in this press release, including earnings projections, are forward-looking statements that involve a number of risks and uncertainties. Such forward-looking statements are within the meaning of that term in Section 27A of the Securities Act of 1933, as amended, and Section 21E of the Securities Exchange Act of 1934, as amended. Factors that could cause actual results to differ materially include the following: business conditions, growth in temporary staffing and the general economy; competitive factors, risks due to shifts in the market demand; a reduction in the supply of candidates or the Firm's ability to attract such candidates; the success of the Firm in attracting and retaining revenue-generating talent; changes in the service mix; ability of the Firm to repurchase shares; the occurrence of unanticipated expenses; the effect of adverse weather conditions; changes in our effective tax rate; changes in government regulations, laws and policies that are adverse to our businesses; risk of contract performance, delays or termination or the failure to obtain awards, task orders or funding under contracts; changes in client demand and our ability to adapt to such changes; continued performance of and improvements to our enterprise information systems, and the risk factors listed from time to time in the Firm’s reports filed with the Securities and Exchange Commission, including the Firm’s Form 10-K for the fiscal year ending December 31, 2017, as well as assumptions regarding the foregoing. In particular, the Firm makes no assurances that the estimates of continuing operations will be achieved or that we will continue to increase our market share, successfully manage risks to our revenue stream, successfully put into place the people and processes that will create future success or further accelerate our revenue. The terms “should,” “believe,” “estimate,” “expect,” “intend,” “anticipate,” “foresee,” “plan” and similar expressions and variations thereof contained in this press release identify certain of such forward-looking statements, which speak only as of the date of this press release. As a result, such forward-looking statements are not guarantees of future performance and involve risks and uncertainties. Future events and actual results may differ materially from those indicated in the forward-looking statements. Readers are cautioned not to place undue reliance on these forward-looking statements and the Firm undertakes no obligation to update any forward-looking statements. Kforce Inc.Summary of Operations(In Thousands, Except Per Share Amounts)(Unaudited) Three Months Ended June 30, 2018 Mar. 31, 2018 June 30, 2017Revenue by segment: Technology $249,763 $236,497 $228,369 Finance and accounting 79,772 80,944 88,266 Government solutions 29,089 28,852 23,674 Total Revenue 358,624 346,293 340,309 Direct costs 251,141 246,105 236,390 Gross profit 107,483 100,188 103,919 GP % 30.0% 28.9% 30.5%Flex GP % (1) 27.1% 26.3% 27.4%Selling, general and administrative expenses 82,448 84,592 82,506 Depreciation and amortization 1,937 2,008 2,053 Income from operations 23,098 13,588 19,360 Other expense, net 1,256 1,339 1,357 Income before income taxes 21,842 12,249 18,003 Income tax expense 5,570 3,074 6,859 Net income $16,272 $9,175 $11,144 Earnings per share - diluted $0.65 $0.37 $0.44 Weighted average shares outstanding - diluted 25,178 25,094 25,482 Adjusted EBITDA $27,428 $17,921 $23,258 Billing days 64 64 64 (1) Beginning in Q1 2018, Flex GP% excludes GS Product; prior quarters have been adjusted to align with this presentation. Kforce Inc.Consolidated Balance Sheets(In Thousands)(Unaudited) June 30, 2018 December 31, 2017ASSETS Current assets: Cash and cash equivalents$473 $379 Trade receivables, net of allowances239,083 225,865 Income tax refund receivable946 7,116 Prepaid expenses and other current assets13,988 12,085 Total current assets254,490 245,445 Fixed assets, net38,568 39,680 Other assets, net40,491 38,598 Deferred tax assets, net11,578 11,316 Intangible assets, net3,125 3,297 Goodwill45,968 45,968 Total assets$394,220 $384,304 LIABILITIES AND STOCKHOLDERS’ EQUITY Current liabilities: Accounts payable and other accrued liabilities$37,960 $34,873 Accrued payroll costs46,603 46,886 Other current liabilities1,824 1,960 Income taxes payable5,387 — Total current liabilities91,774 83,719 Long-term debt – credit facility100,600 116,523 Long-term debt – other2,114 2,597 Other long-term liabilities49,426 47,188 Total liabilities243,914 250,027 Commitments and contingencies Stockholders’ equity: Preferred stock— — Common stock716 715 Additional paid-in capital442,460 437,394 Accumulated other comprehensive income797 100 Retained earnings214,143 195,143 Treasury stock, at cost(507,810) (499,075)Total stockholders’ equity150,306 134,277 Total liabilities and stockholders’ equity$394,220 $384,304 Kforce Inc.Key Statistics(Unaudited) Q2 2018 Q1 2018 Q2 2017Total Firm Total Revenue (000’s) $358,624 $346,293 $340,309 GP % 30.0% 28.9% 30.5%Flex revenue (000’s) (1) $342,105 $332,817 $324,015 Flex GP % (1) 27.1% 26.3% 27.4%Direct Hire revenue (000’s) $12,536 $11,395 $13,853 Placements 847 853 974 Average fee $14,802 $13,362 $14,227 Product revenue (000's) $3,983 $2,081 $2,441 Billing days 64 64 64 Technology Flex revenue (000’s) $244,509 $231,496 $222,744 Hours (000’s) 3,294 3,178 3,234 Flex GP % 27.2% 26.1% 26.9%Direct Hire revenue (000’s) $5,254 $5,001 $5,625 Placements 282 278 317 Average fee $18,635 $18,021 $17,753 Finance and Accounting Flex revenue (000’s) $72,490 $74,550 $80,038 Hours (000’s) 2,076 2,196 2,398 Flex GP % 29.1% 27.9% 28.8%Direct Hire revenue (000’s) $7,282 $6,394 $8,228 Placements 565 575 657 Average fee $12,889 $11,115 $12,526 Government Solutions Total Revenue (000's) $29,089 $28,852 $23,674 GP % 25.0% 26.6% 29.8%Flex revenue (000’s) (1) $25,106 $26,771 $21,233 Flex GP% (1) 19.8% 24.5% 26.7%Product revenue (000's) $3,983 $2,081 $2,441 Product GP % 57.2% 54.3% 56.8% (1) Beginning in Q1 2018, Flex revenue and Flex GP% exclude GS Product; prior quarters have been adjusted to align with this presentation. Kforce Inc.Revenue Growth Rates(Per Billing Day)(Unaudited) Year-Over-Year Revenue Growth Rates (Per Billing Day) Q2 2018 Q1 2018 Q4 2017 Q3 2017 Q2 2017Billing days 64 64 61 63 64 Tech Flex 9.8% 6.7% 5.4% 3.3% 1.5%FA Flex (9.4)% (7.9)% 0.3% 4.1% 4.3%GS Flex (1) 18.2% 24.5% 27.9% 12.7% 1.2%Total Flex (1) 5.6% 4.2% 5.5% 4.2% 2.2%Total Firm 5.4% 3.7% 5.1% 3.0% 1.6% (1) Beginning in Q1 2018, Flex revenue excludes GS Product; prior quarters have been adjusted to align with this presentation. Kforce Inc.Non-GAAP Financial Measures(In Thousands, Except Per Share Amounts)(Unaudited) The following non-GAAP financial measures presented may not provide information that is directly comparable to that provided by other companies, as other companies may calculate such financial results differently. The Company’s non-GAAP financial measures are not measurements of financial performance under GAAP and should not be considered as alternatives to amounts presented in accordance with GAAP. The Company views these non-GAAP financial measures as supplemental and they are not intended to be a substitute for, or superior to, the information provided by GAAP financial results. A reconciliation of the non-GAAP financial measures to the most directly comparable GAAP financial measures is provided below. Free Cash Flow “Free Cash Flow”, a non-GAAP financial measure, is defined by Kforce as net cash provided by operating activities determined in accordance with GAAP, less capital expenditures. Management believes this provides an additional way of viewing our liquidity that, when viewed with our GAAP results, provides a more complete understanding of factors and trends affecting our cash flows and is useful information to investors as it provides a measure of the amount of cash generated from the business that can be used for strategic opportunities including investing in our business, making acquisitions, repurchasing common stock or paying dividends. Free Cash Flow has limitations due to the fact that it does not represent the residual cash flow available for discretionary expenditures. Therefore, we believe it is important to view Free Cash Flow as a complement to our financial statements. Six Months Ended June 30, 2018 2017Net income$25,447 $17,046 Non-cash provisions and other10,545 12,451 Changes in operating assets/liabilities2,267 (23,958)Net cash provided by operating activities38,259 5,539 Capital expenditures(3,116) (4,344)Free cash flow35,143 1,195 Change in debt(15,923) 12,582 Repurchases of common stock(12,129) (2,952)Cash dividends(5,943) (6,080)Other(1,054) (2,695)Change in cash and cash equivalents$94 $2,050 Adjusted EBITDA “Adjusted EBITDA”, a non-GAAP financial measure, is defined by Kforce as net income before depreciation and amortization, stock-based compensation expense, interest expense, net and income tax expense. Adjusted EBITDA should not be considered a measure of financial performance under GAAP. Items excluded from Adjusted EBITDA are significant components in understanding and assessing our past and future financial performance, and this presentation should not be construed as an inference by us that our future results will be unaffected by those items excluded from Adjusted EBITDA. Adjusted EBITDA is a key measure used by management to assess our operations including our ability to generate cash flows and our ability to repay our debt obligations. Management believes it is useful information to investors as it provides a good metric of our core profitability in comparing our performance to our competitors, as well as our performance over different time periods. The measure should not be considered in isolation or as an alternative to net income, cash flows or other financial statement information presented in the consolidated financial statements as indicators of financial performance or liquidity. The measure is not determined in accordance with GAAP and is susceptible to varying calculations, and as presented, may not be comparable to similarly titled measures of other companies. Three Months Ended, June 30, 2018 Mar. 31, 2018 June 30, 2017Net income $16,272 $9,175 $11,144 Depreciation and amortization 2,057 2,115 2,105 Stock-based compensation expense 2,292 2,260 1,805 Interest expense, net 1,237 1,297 1,345 Income tax expense 5,570 3,074 6,859 Adjusted EBITDA $27,428 $17,921 $23,258 AT THE FIRM Michael R. BlackmanChief Corporate Development Officer(813) 552-2927
财报并购
100 项与 The Monterey Stockholders Group LLC 相关的药物交易
登录后查看更多信息
100 项与 The Monterey Stockholders Group LLC 相关的转化医学
登录后查看更多信息
组织架构
使用我们的机构树数据加速您的研究。
登录
或
管线布局
2026年02月08日管线快照
无数据报导
登录后保持更新
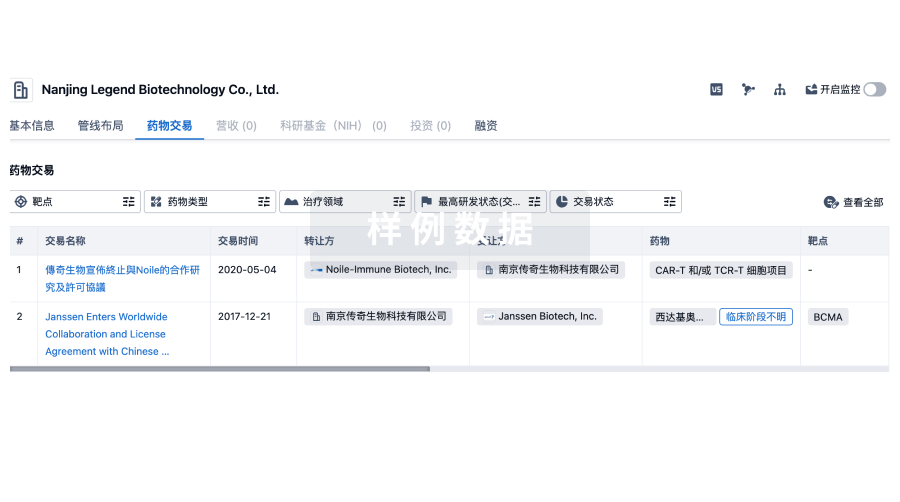
药物交易
使用我们的药物交易数据加速您的研究。
登录
或
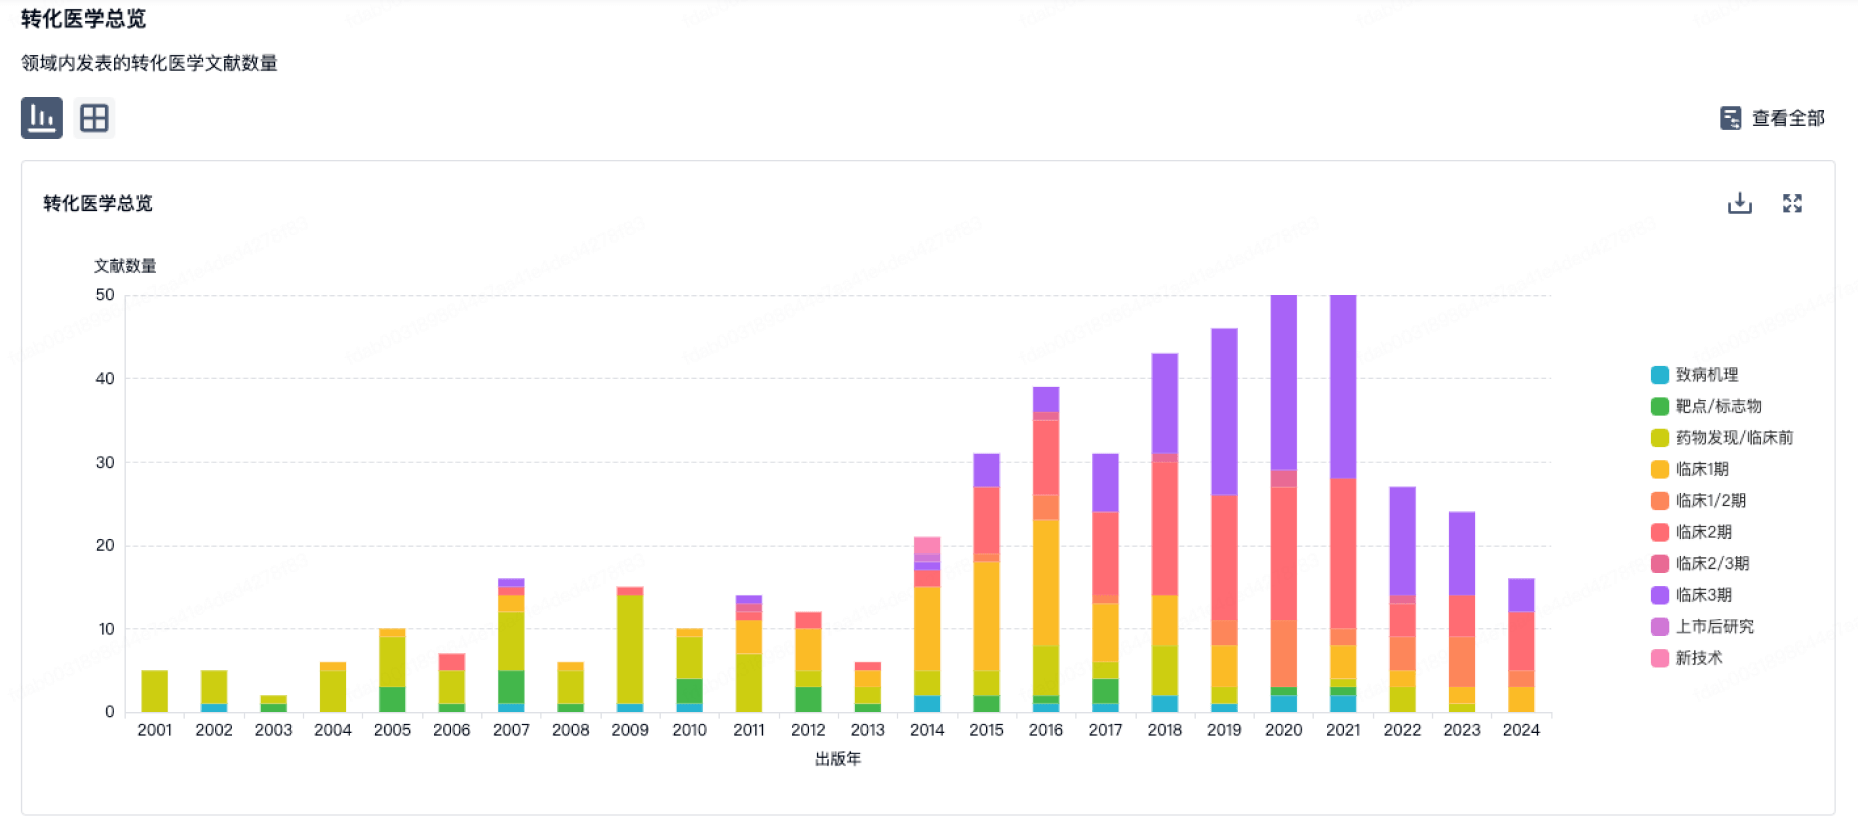
转化医学
使用我们的转化医学数据加速您的研究。
登录
或
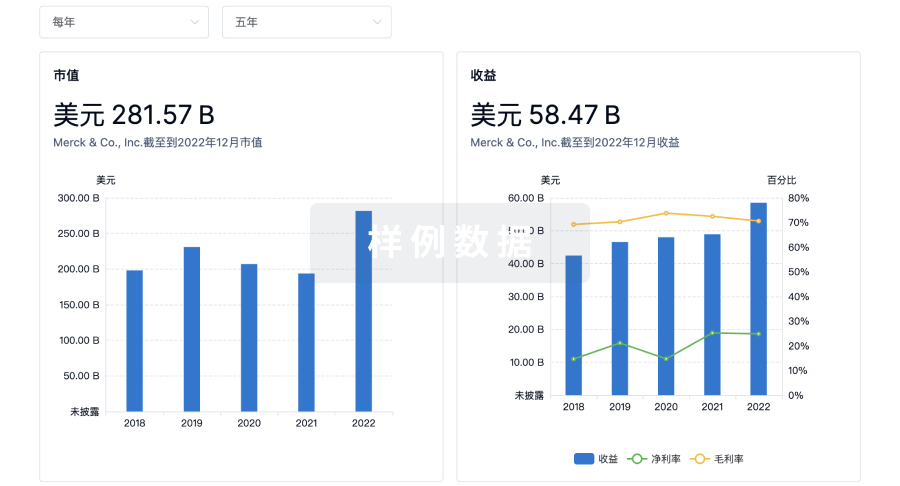
营收
使用 Synapse 探索超过 36 万个组织的财务状况。
登录
或
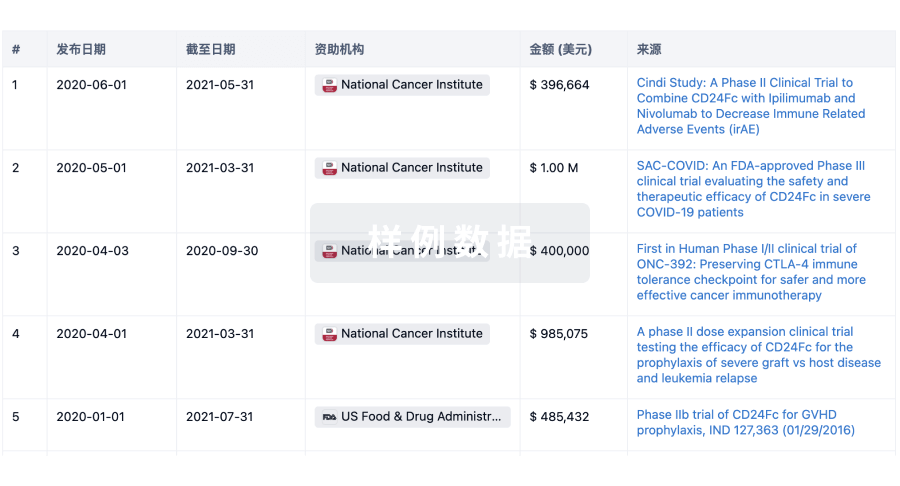
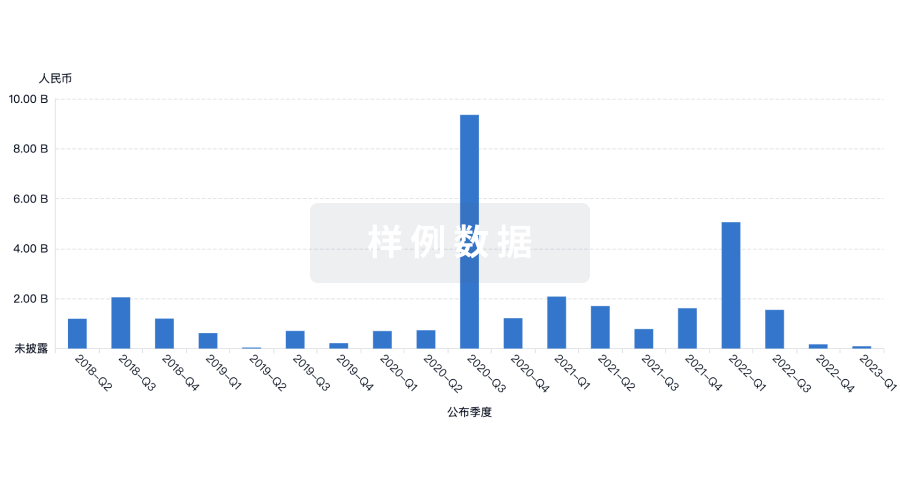
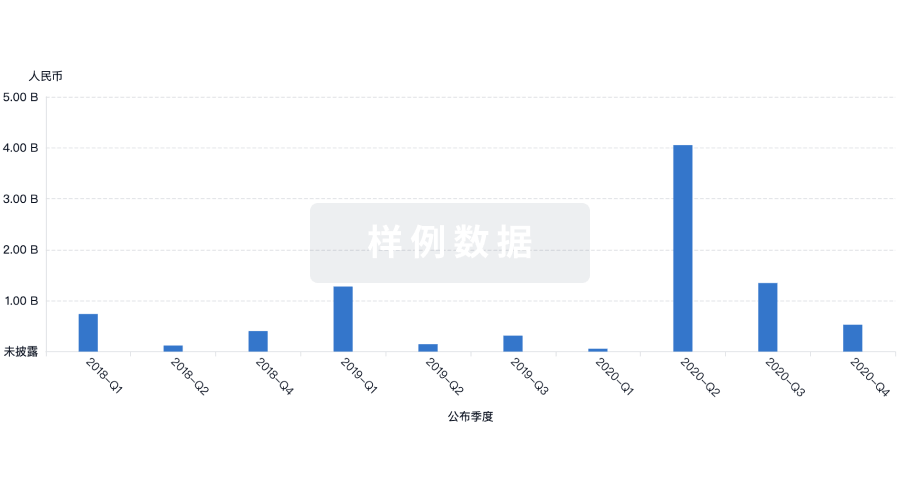
科研基金(NIH)
访问超过 200 万项资助和基金信息,以提升您的研究之旅。
登录
或
投资
深入了解从初创企业到成熟企业的最新公司投资动态。
登录
或
融资
发掘融资趋势以验证和推进您的投资机会。
登录
或
生物医药百科问答
全新生物医药AI Agent 覆盖科研全链路,让突破性发现快人一步
立即开始免费试用!
智慧芽新药情报库是智慧芽专为生命科学人士构建的基于AI的创新药情报平台,助您全方位提升您的研发与决策效率。
立即开始数据试用!
智慧芽新药库数据也通过智慧芽数据服务平台,以API或者数据包形式对外开放,助您更加充分利用智慧芽新药情报信息。
生物序列数据库
生物药研发创新
免费使用
化学结构数据库
小分子化药研发创新
免费使用