预约演示
更新于:2025-07-29

Straight Smile, LLC.
更新于:2025-07-29
概览
关联
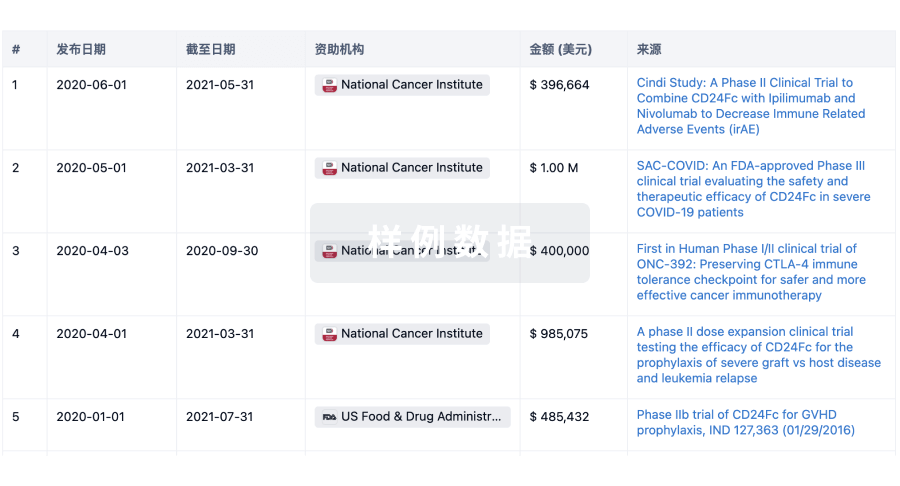
100 项与 Straight Smile, LLC. 相关的临床结果
登录后查看更多信息
0 项与 Straight Smile, LLC. 相关的专利(医药)
登录后查看更多信息
4
项与 Straight Smile, LLC. 相关的新闻(医药)2024-12-31
NEW YORK, Dec. 31, 2024 /PRNewswire/ -- Levi & Korsinsky, LLP notifies investors in
Dentsply Sirona Inc. ("Dentsply" or the "Company") (NASDAQ: XRAY) of a class action securities lawsuit.
CLASS DEFINITION: The lawsuit seeks to recover losses on behalf of Dentsply investors who were adversely affected by alleged securities fraud between May 6, 2021 and November 6, 2024. Follow the link below to get more information and be contacted by a member of our team:
XRAY investors may also contact Joseph E. Levi, Esq. via email at [email protected] or by telephone at (212) 363-7500.
CASE DETAILS: The filed complaint alleges that defendants made false statements and/or concealed that: (1) Dentsply targeted low-income people who did not have access to good oral hygiene education, a dentist, or dental insurance, which often meant patients signing up for Byte, a DTC aligner solution, had underlying dental issues that would have made them ineligible for treatment; (2) the push for Byte growth and sales commissions caused sales employees to sell to contraindicated patients; (3) as a result of the above, the Byte patient onboarding workflow did not provide adequate assurance that contraindicated patients did not enter treatment; (4) before and during the Class Period, reports of Byte patient injuries were pouring in; (5) Dentsply knew that its Byte aligners were causing severe patient injuries for years but did little to investigate those injuries or notify the FDA; (6) Dentsply had no systems in place to notify the FDA of these injuries, which the Company is required to do within 30 days of learning of a problem; (7) the FDA had received a sharp uptick in reports of serious injuries from Byte patients; (8) as a result of the above, Dentsply materially overstated the goodwill value of Byte; (9) as a result of the above, defendants' positive statements about the Company's business, operations, and prospects were materially false and misleading and/or lacked a reasonable basis at all relevant times.
WHAT'S NEXT? If you suffered a loss in Dentsply during the relevant time frame, you have until
January 27, 2025 to request that the Court appoint you as lead plaintiff. Your ability to share in any recovery doesn't require that you serve as a lead plaintiff.
NO COST TO YOU: If you are a class member, you may be entitled to compensation without payment of any out-of-pocket costs or fees.
There is no cost or obligation to participate.
WHY LEVI & KORSINSKY: Over the past 20 years, the team at Levi & Korsinsky has secured hundreds of millions of dollars for aggrieved shareholders and built a track record of winning high-stakes cases. Our firm has extensive expertise representing investors in complex securities litigation and a team of over 70 employees to serve our clients. For seven years in a row, Levi & Korsinsky has ranked in ISS Securities Class Action Services' Top 50 Report as one of the top securities litigation firms in the United States.
CONTACT:
Levi & Korsinsky, LLP
Joseph E. Levi, Esq.
Ed Korsinsky, Esq.
33 Whitehall Street, 17th Floor
New York, NY 10004
[email protected]
Tel: (212) 363-7500
Fax: (212) 363-7171
SOURCE Levi & Korsinsky, LLP
WANT YOUR COMPANY'S NEWS FEATURED ON PRNEWSWIRE.COM?
440k+
Newsrooms &
Influencers
9k+
Digital Media
Outlets
270k+
Journalists
Opted In
GET STARTED
专利侵权
2021-06-07
The acquisition will allow Dentsply Sirona to further expand its presence in the clear aligner market
Propel Orthodontics’ VPro vibratory orthodontic device. (Credit: Dentsply Sirona)
Dental products and technologies provider Dentsply Sirona has purchased all the assets of orthodontic solutions provider Propel Orthodontics in an all-cash deal for $131m.
Propel Orthodontics is engaged in the manufacturing and marketing of in-office and at-home orthodontic solutions to dentists and their patients.
The acquired assets consist of VPro vibratory orthodontic device and the Fastrack Mobile App.
Propel’s at-home high frequency vibration (HFV) product line includes VPro5, VPro+ and VPro, which are suitable for both active treatment and retention at five minutes per day.
VPro device helps to properly seat aligners in five minutes. Featuring patented high-frequency vibrational technology, the device will help increase patient comfort and minimise overall treatment time when used as part of an orthodontic treatment plan.
The acquisition of Propel Orthodontics will allow Dentsply Sirona to further expand its presence in the clear aligner market, as well as complement the Byte and SureSmile businesses.
Dentsply also stated that it will continue to improve the VPro Fastrack App, which enables patients and providers to remotely monitor the orthodontic treatment plan.
Dentsply Sirona CEO Don Casey said: “With the acquisition of the assets of Propel Orthodontics, Dentsply Sirona takes another step to position the company as a leading innovator in the fast-growing clear aligner market.
“It is the perfect match to Byte, and our SureSmile business, and is also a strong strategic fit with Dentsply Sirona.
“The acquisition supports innovation in the orthodontics space of Dentsply Sirona as well as the capacity to further invest in the future product development in this area.”
In January this year, Dentsply Sirona acquired US-based dental aligner maker Byte in an all-cash deal for $1.04bn.
并购
2021-03-01
Q4 revenue decreased 2.6% to $1.08 billion. Organic revenue decreased 3.3%
Q4 GAAP EPS decreased 2.2% to $0.45
Q4 Non-GAAP EPS increased 19.2% to $0.87
Q4 GAAP operating income decreased 1.5% to $135 million
Q4 Non-GAAP operating income increased 13.1% to $251 million
FY20 Generated strong operating cash flow of $635 million
FY20 GAAP EPS loss of $(0.38)
FY20 Non-GAAP EPS of $1.79
Provides FY21 Non-GAAP EPS outlook range of $2.60 to $2.80
CHARLOTTE, N.C., March 01, 2021 (GLOBE NEWSWIRE) -- DENTSPLY SIRONA Inc. (“Dentsply Sirona” or the "Company") (Nasdaq: XRAY), The Dental Solutions Company, today announced its financial results for the fourth quarter and full year 2020.
Fourth quarter net sales of $1.08 billion decreased 2.6%, compared to $1.1 billion in the fourth quarter of 2019. Net income for the fourth quarter of 2020 was $99 million, or $0.45 per diluted share, compared to $102 million, or $0.46 per diluted share in the fourth quarter of 2019. On an adjusted basis Non-GAAP net earnings per diluted share grew 19.2% to $0.87 compared to $0.73 in the fourth quarter of 2019. A reconciliation of the Non-GAAP measures to earnings per share calculated on a GAAP basis is provided in the attached table.
Don Casey, Chief Executive Officer, commented “Our fourth quarter results reflect the continued focus on disciplined execution and the gradual recovery in global dental markets. Our team delivered strong operational performance, exceeding our expectations across most metrics including operating margin expansion, healthy EPS growth and cash flow generation. We capped off the year with the strategic acquisition of Byte, a rapidly growing direct-to-consumer, doctor-directed clear aligner company. This acquisition is key to accelerating our growth in the clear aligner space. While uncertainty remains on the timing and extent of a full recovery in the dental market, our 2021 outlook reflects our confidence in our portfolio and our commitment to driving growth through strategic investments.”
Q4 20 and FY 20 Summary Results (GAAP)
(in millions, except per share amount and percentages)
Q4 20
Q4 19
YoY
FY 20
FY 19
YoY
Net Sales
1,082
1,111
(2.6
%)
3,342
4,029
(17.1
%)
Operating income (loss)
135
137
(1.5
%)
(12
)
361
(103.3
%)
Operating income %
12.5
%
12.3
%
(0.4
%)
9.0
%
Diluted EPS
0.45
0.46
(2.2
%)
(0.38
)
1.17
(132.5
%)
Q4 20 and FY 20 Summary Results (Non-GAAP)[1]
(in millions, except per share amount and percentages)
Q4 20
Q4 19
YoY
FY 20
FY 19
YoY
Net Sales
1,082
1,111
(2.6
%)
3,342
4,029
(17.1
%)
Organic Sales Growth %
(3.3
%)
(16.7
%)
Operating income
251
222
13.1
%
537
742
(27.6
%)
Operating income %
23.2
%
20.0
%
16.1
%
18.4
%
Diluted EPS
0.87
0.73
19.2
%
1.79
2.45
(26.9
%)
[1] Organic sales growth, Non-GAAP operating income, and Non-GAAP EPS are Non-GAAP financial measures which exclude certain items. Please refer to "Non-GAAP Financial Measures" below for a description of these measures and to the tables at the end of this release for a reconciliation between GAAP and Non-GAAP measures.
Segment Results
Consumables
Fourth quarter 2020 net sales were $449 million, up 1.6% versus prior year. Currency favorably impacted sales by 1.8%, while divestitures and discontinued products negatively impacted sales by 1.3%. On an organic basis, net sales increased by 1.1%. Sales of Restorative and Preventive consumables rebounded in the quarter but were partially offset by declines in Lab.
Technologies & Equipment
Fourth quarter 2020 net sales were $633 million, down 5.4% versus prior year. Currency favorably impacted sales by 3.0%, while divestitures and discontinued products decreased sales growth by 2.2%. On an organic basis, net sales declined by 6.2% as compared to prior year. The decline in organic sales was driven by the difficult CAD/CAM comp in 2019, partially offset by growth in clear aligners.
Cash Flow and Liquidity
Operating cash flow in the fourth quarter of 2020 was $263 million, as compared to $299 million in the prior year. Full year 2020 operating cash flow was consistent with full year 2019. In the fourth quarter, the Company paid $22 million in dividends, bringing a total of $228 million returned to shareholders in 2020. At December 31, 2020, the Company had $438 million of cash available on its balance sheet.
Fiscal Year 2021 Outlook
We expect fiscal year 2021 revenue in the range of $4.0B to $4.3B, up 20% to 30% on a reported basis and up 15% to 25% on an organic basis1. We expect adjusted operating income margin2 of at least 20%. FY2021 non-GAAP EPS is expected to be in the range of $2.60 to $2.80.
Further 2021 planning assumptions are included in the Q4 FY2020 Earnings Presentation posted at The Company does not provide forward-looking estimates on a GAAP basis as certain information is not available and cannot be reasonably estimated.
_____________________________
1 Organic sales growth, Non-GAAP operating income, and Non-GAAP EPS are Non-GAAP financial measures which exclude certain items. Please refer to "Non-GAAP Financial Measures" below for a description of these measures and to the tables at the end of this release for a reconciliation between GAAP and Non-GAAP measures.
2 Dentsply Sirona does not provide GAAP figures for these financial measures on a forward-looking basis, because the Company believes it is unable to provide a meaningful or accurate calculation or estimation of reconciling items and the information is not available without unreasonable effort. These reconciling items include the impact of prospective acquisitions, acquisitions announced but not yet closed and other non-GAAP items, including restructuring costs and various other factors, many of which are difficult to predict.
Recent Announcements & Additional Highlights
Announced quarterly dividend of $0.10 payable on April 9th, 2021 to holders of record at the close of business on March 26th, 2021
Strategic Inorganic Investments
Byte Acquisition - The December 31, 2020 acquisition of Byte for $1.04 billion directly supports our focus on innovation and revenue growth by enhancing our scale in the clear aligner category and provides future access to potential new customers to our existing dental partners. Byte has a strong consumer brand and comes with a robust marketing and data analytics platform offering multiple strategic benefits. Combined with our SureSmile solution, we believe this acquisition will deepen our connection with dental professionals and consumers worldwide and extend access to additional patients. We expect this deal to be accretive to our long-term financial targets and Non-GAAP EPS.
Datum Dental, Ltd. Acquisition - The January 21, 2021 acquisition of Datum Dental for $95 million, with the potential for additional earn-out provision payments of up to $10 million, is part of our commitment to prioritizing deploying clinical innovations to our customers. Datum Dental is an Israel-based company known for its innovative dental regeneration products. The acquisition adds the clinically superior proprietary technology GLYMATRIX® and its strong OSSIX® biomaterial to our portfolio. Datum Dental complements Dentsply Sirona’s existing implant dentistry strategy around Ankylos, Astra Tech Implant System, Xive and Atlantis, focusing on established quality and meaningful innovation. In addition, Datum Dental has a strong R&D pipeline with many promising products with differentiated value propositions and Dentsply Sirona has the capacity to further invest in its future development.
Select Strategic New Product Launches
Axeos - This Q4 launch delivers a meaningful advancement in technologies to our portfolio. This 3D/2D imaging system offers enhanced clinical confidence, smart connectivity, and an exceptional experience, with the largest field of view of any Dentsply Sirona 3D/2D system. Axeos uses intelligent low dose exposure to capture high-quality images while providing easy-to-use features to enhance patient comfort, such as smart height adjustment and quick scan times, that lead to exceptional patient experiences with high infection prevention standards.
Surefil one - Innovative restorative filling material providing the first ever self-adhesive composite hybrid. This aesthetically pleasing option combines the simplicity of a glass ionomer and the durability of a resin-based composite to create an entirely new material class. Surefil one has an unlimited depth of cure - providing assurance in very deep cavities that a complete cure will be obtained without layering. It can also be light cured, so the restoration can be finished and polished immediately after surface light curing.
Conference Call/Webcast Information
Dentsply Sirona’s management team will host an investor conference call and live webcast on March 1, 2021 at 8:30 am ET. A presentation will also be available on in the Investors section.
Investors can access the webcast via a link on Dentsply Sirona’s web site at For those planning to participate on the call, please dial +1-877-370-7637 for domestic calls, or +1-629-228-0723 for international calls. The Conference ID # is 8540717. A replay of the conference call will be available online on the Dentsply Sirona web site, and a dial-in replay will be available for one week following the call at +1-855-859-2056 (for domestic calls) or +1-404-537-3406 (for international calls), replay passcode # 8540717.
About Dentsply Sirona
Dentsply Sirona is the world’s largest manufacturer of professional dental products and technologies, with a 134-year history of innovation and service to the dental industry and patients worldwide. Dentsply Sirona develops, manufactures, and markets a comprehensive solutions offering including dental and oral health products as well as other consumable medical devices under a strong portfolio of world class brands. As The Dental Solutions Company, Dentsply Sirona’s products provide innovative, high-quality and effective solutions to advance patient care and deliver better, safer and faster dentistry. The Company’s shares of common stock are listed in the United States on Nasdaq under the symbol XRAY. Visit for more information about Dentsply Sirona and its products.
Contact Information:
Investors:
Kari Dixon
Vice President, Financial Planning & Analysis
+1-704-805-1281
Kari.Dixon@dentsplysirona.com
Forward-Looking Statements and Associated Risks
All statements in this press release that do not directly and exclusively relate to historical facts constitute “forward-looking statements.” These statements represent current expectations and beliefs, and no assurance can be given that the results described in such statements will be achieved. Such statements are subject to numerous assumptions, risks, uncertainties and other factors that could cause actual results to differ materially from those described in such statements, many of which are outside of our control. Furthermore, many of these risks and uncertainties are currently amplified by and may continue to be amplified by or may, in the future, be amplified by, the novel coronavirus (“COVID-19”) pandemic and the impact of varying private and governmental responses that affect our customers, employees, vendors and the economies and communities where they operate. For a written description of these factors, see the section titled “Risk Factors” in Dentsply Sirona’s Annual Report on Form 10-K for the fiscal year ended December 31, 2020. No assurance can be given that any expectation, belief, goal or plan set forth in any forward-looking statement can or will be achieved, and readers are cautioned not to place undue reliance on such statements which speak only as of the date they are made. We do not undertake any obligation to update or release any revisions to any forward-looking statement or to report any events or circumstances after the date of this press release or to reflect the occurrence of unanticipated events.
DENTSPLY SIRONA INC. AND SUBSIDIARIES
CONSOLIDATED STATEMENTS OF OPERATIONS
(In millions, except per share amounts and percentages)
(unaudited)
Three Months Ended
Year Ended
December 31,
December 31,
2020
2019
2020
2019
Net sales
$
1,082
$
1,111
$
3,342
$
4,029
Cost of products sold
511
501
1,685
1,864
Gross profit
571
610
1,657
2,165
Selling, general and administrative expenses
421
460
1,435
1,723
Goodwill impairment
—
—
157
—
Restructuring and other costs
15
13
77
81
Operating income (loss)
135
137
(12
)
361
Net interest and other expense
12
—
48
16
Income (loss) before income taxes
123
137
(60
)
345
Provision for income taxes
24
35
23
82
Net income (loss)
99
102
(83
)
263
Less: Net income (loss) attributable to noncontrolling interests
—
—
—
—
Net income (loss) attributable to Dentsply Sirona
$
99
$
102
$
(83
)
$
263
Net income (loss) per common share attributable to Dentsply Sirona:
Basic
$
0.45
$
0.46
$
(0.38
)
$
1.18
Diluted
$
0.45
$
0.46
$
(0.38
)
$
1.17
Weighted average common shares outstanding:
Basic
218.6
222.7
219.2
223.1
Diluted
219.5
223.5
219.2
224.4
DENTSPLY SIRONA INC. AND SUBSIDIARIES
CONDENSED CONSOLIDATED BALANCE SHEETS
(In millions)
(unaudited)
December 31, 2020
December 31, 2019
Assets
Current Assets:
Cash and cash equivalents
$
438
$
405
Accounts and notes receivable-trade, net
673
782
Inventories, net
466
562
Prepaid expenses and other current assets, net
214
251
Total Current Assets
1,791
2,000
Property, plant and equipment, net
791
802
Operating lease right-of-use assets, net
176
159
Identifiable intangible assets, net
2,504
2,176
Goodwill, net
3,986
3,397
Other noncurrent assets, net
94
69
Total Assets
$
9,342
$
8,603
Liabilities and Equity
Current liabilities:
Accounts payable
$
305
$
308
Accrued liabilities
653
629
Income taxes payable
60
56
Notes payable and current portion of long-term debt
299
2
Total Current Liabilities
1,317
995
Long-term debt
1,978
1,433
Operating lease liabilities
130
120
Deferred income taxes
393
480
Other noncurrent liabilities
554
480
Total Liabilities
4,372
3,508
Total Equity
4,970
5,095
Total Liabilities and Equity
$
9,342
$
8,603
DENTSPLY SIRONA INC. AND SUBSIDIARIES
CONSOLIDATED STATEMENTS OF CASH FLOWS
(In millions) (unaudited)
Year Ended December 31,
2020
2019
Cash flows from operating activities:
Net (loss) income
$
(83
)
$
263
Adjustments to reconcile net income to net cash provided by operating activities:
Depreciation
142
133
Amortization of intangible assets
192
190
Amortization of deferred financing costs
5
3
Fixed asset impairment
3
33
Goodwill impairment
157
—
Indefinite lived intangible asset impairment
39
5
Definite-lived intangible asset impairment
—
4
Deferred income taxes
(64
)
(37
)
Stock based compensation expense
47
66
Restructuring and other costs - non-cash
10
16
Other non-cash (income) expense
(14
)
(20
)
Loss on disposal of property, plant and equipment
1
4
Gain on divestiture of noncontrolling interest
—
(9
)
Loss on sale on non-strategic businesses and product lines
1
2
Changes in operating assets and liabilities, net of acquisitions:
Accounts and notes receivable-trade, net
126
(91
)
Inventories, net
124
14
Prepaid expenses and other current assets, net
42
13
Other noncurrent assets, net
1
(9
)
Accounts payable
(23
)
26
Accrued liabilities
(17
)
45
Income taxes
(39
)
(16
)
Other noncurrent liabilities
(15
)
(2
)
Net cash provided by operating activities
635
633
Cash flows from investing activities:
Capital expenditures
(87
)
(123
)
Cash paid for acquisitions of businesses and equity investments, net of cash acquired
(1,078
)
(3
)
Cash received on sale of non-strategic businesses or product lines
1
11
Cash received on derivative contracts
58
40
Cash paid on derivatives contracts
(1
)
—
Liquidation of short-term investments
—
1
Proceeds from sale of property, plant and equipment, net
1
5
Net cash used in investing activities
(1,106
)
(69
)
Cash flows from financing activities:
Net borrowings (repayments) on short-term borrowings
2
(69
)
Cash paid for treasury stock
(140
)
(260
)
Cash dividends paid
(88
)
(81
)
Cash paid for acquisition of noncontrolling interests of consolidated subsidiaries
(2
)
—
Proceeds from long-term borrowings, net of deferred financing costs
1,448
120
Cash paid for deferred financing costs
(6
)
(1
)
Repayments on long-term borrowings, net
(701
)
(251
)
Payments on terminated derivatives instruments
(30
)
—
Proceeds from exercised stock options
11
109
Cash paid for contingent consideration on prior acquisitions
(4
)
(33
)
Net cash provided by (used in) financing activities
490
(466
)
Effect of exchange rate changes on cash and cash equivalents
14
(3
)
Net increase (decrease) in cash and cash equivalents
33
95
Cash and cash equivalents at beginning of period
405
310
Cash and cash equivalents at end of period
$
438
$
405
Supplemental disclosures of cash flow information:
Interest paid, net of amounts capitalized
$
45
$
30
Income taxes paid, net of refunds
$
82
$
112
Non-cash investing activities
Property, plant and equipment in accounts payable at end of period
$
14
$
14
Exchange of inventory for naming rights
$
4
$
3
Non-GAAP Financial Measures
In addition to results determined in accordance with U.S. generally accepted accounting principles (“US GAAP”) the Company provides certain measures in this press release, described below, which are not calculated in accordance with US GAAP and therefore represent Non-GAAP measures. These Non-GAAP measures may differ from those used by other companies and should not be considered in isolation from, or as a substitute for, measures of financial performance prepared in accordance with US GAAP. The Company discloses these measures to allow investors to evaluate the performance of the Company’s operations exclusive of certain items that impact the comparability of results from period to period and which may not be indicative of past or future performance of the normal operations of the Company. The Company believes that this information is helpful in understanding underlying operating results including net sales, operating income, and net income.
Organic Sales
The Company defines "organic sales" as the increase or decrease in net sales excluding: (1) net sales from acquired and divested businesses recorded prior to the first anniversary of the acquisition or divestiture, (2) net sales attributable to discontinued product lines in both the current and prior year periods, and (3) the impact of foreign currency translation, which is calculated by translating current period sales using the comparable prior periods currency conversion rates. Organic sales is an important internal measure for the Company. The Company's senior management receives a monthly analysis of operating results that includes organic sales and the performance of the Company is measured on this metric along with other performance metrics.
Adjusted Net Income (Loss) and Adjusted Earnings (Loss) Per Diluted Common Share
The adjusted net income (loss) attributable to Dentsply Sirona consists of net income (loss) attributable to Dentsply Sirona adjusted to exclude the following:
(1) Business combination related costs and fair value adjustments. These adjustments include costs related to consummating and integrating acquired businesses, as well as net gains and losses related to the disposed businesses. In addition, this category includes the subsequent impact roll-off to the consolidated statements of operations which results from fair value adjustments related to business combinations, except for amortization expense of purchased intangible assets noted below. Although the Company is regularly engaged in activities to find and act on opportunities for strategic growth and enhancement of product offerings, the costs associated with these activities may vary significantly between periods based on the timing, size and complexity of acquisitions and as such may not be indicative of past and future performance of the Company. They are therefore excluded to allow investors to better understand underlying operating trends.
(2) Restructuring program related costs and other costs. These adjustments include costs related to the implementation of restructuring initiatives as well as certain other costs. These costs can include, but are not limited to, severance costs, facility closure costs, lease and contract termination costs and related professional service costs, duplicate facility and labor costs associated with specific restructuring initiatives. Other costs include legal settlements and impairments of assets. The Company's restructuring programs usually require several years to fully implement and the Company is continually seeking to take actions that could enhance its efficiency. While restructuring charges are recurring, they are subject to significant fluctuations from period to period due to the varying levels of restructuring activity and the inherent imprecision in the estimates used to recognize the impairment of assets and the wide variety of costs and taxes associated with severance and termination benefits in the countries in which the restructuring actions occur.
(3) Amortization of purchased intangible assets. This adjustment excludes the periodic amortization expense related to purchased intangible assets recorded in purchase accounting. Although these costs contribute to revenue generation and will recur in future periods, their amounts are significantly impacted by the timing and size of acquisitions.
(4) Credit risk and fair value adjustments. These adjustments include both the cost and income impacts of adjustments in certain assets and liabilities including the Company’s pension obligations, that are recorded through net income which are related to the changes in fair value and credit risk. Although this non-service component of pension expense is a recurring item, it is subject to significant fluctuations from period to period due to changes in actuarial assumptions, global financial markets (including stock market returns and interest rate changes), plan changes, settlements, curtailments, and other changes in facts and circumstances. These items can be variable and driven more by market conditions than the Company’s operating performance.
(5) Income tax related adjustments. These adjustments include both income tax expenses and income tax benefits that are representative of income tax adjustments mostly related to prior periods, as well as the final settlement of income tax audits, and discrete tax items resulting from the implementation of restructuring initiatives and the vesting and exercise of employee share-based compensation. Income tax related adjustments may also include the impact to adjust the interim effective income tax rate to the expected annual effective tax rate. These adjustments are irregular in timing the variability in amounts may not be indicative of past and future performance of the Company and therefore are excluded for comparability purposes.
Both adjusted net income (loss) and adjusted EPS are important internal measures for the Company. The Company's senior management receives a monthly analysis of operating results that includes adjusted net income (loss) and adjusted EPS. The performance of the Company is measured on these metrics along with other performance metrics.
Adjusted Operating Income (Loss) and Margin
In addition to reporting operating income (loss) in accordance with US GAAP, the Company provides adjusted operating income (loss) and margin. The Company defines "adjusted operating income (loss)" as operating income (loss) in accordance with US GAAP excluding certain items noted above which are excluded on a pre-tax basis to arrive at adjusted operating income (loss), a Non-GAAP measure. The adjusted operating margin is calculated by dividing adjusted operating income (loss) by net sales. Both adjusted operating income (loss) and adjusted operating margin are important internal measures for the Company. The Company's senior management receives a monthly analysis of operating results that includes adjusted operating income (loss) and margin. The performance of the Company is measured on these metrics along with the adjusted net income (loss) and adjusted EPS metrics noted above as well as other performance metrics.
DENTSPLY SIRONA INC. AND SUBSIDIARIES
(In millions, except per share amounts and percentages)
(unaudited)
A reconciliation of reported net sales to organic sales by geographic region is as follows:
Three Months Ended December 31, 2020
Q4 2020 Change
Three Months Ended December 31, 2019
(in millions, except percentages)
US
Europe
ROW
Total
US
Europe
ROW
Total
US
Europe
ROW
Total
Net sales
$
359
$
448
$
275
$
1,082
(8.7
%)
3.0
%
(2.8
%)
(2.6
%)
$
393
$
435
$
283
$
1,111
Foreign exchange impact
1.1
%
5.0
%
0.8
%
2.6
%
Acquisitions and divestitures
—
%
(1.0
%)
—
%
(0.4
%)
Discontinued products
(2.5
%)
(1.4
%)
(0.2
%)
(1.5
%)
Organic sales
(7.3
%)
0.4
%
(3.4
%)
(3.3
%)
Year Ended December 31, 2020
2020 Change
Year Ended December 31, 2019
(in millions, except percentages)
US
Europe
ROW
Total
US
Europe
ROW
Total
US
Europe
ROW
Total
Net sales
$
1,109
$
1,387
$
846
$
3,342
(19.2
%)
(14.1
%)
(18.8
%)
(17.1
%)
$
1,373
$
1,614
$
1,042
$
4,029
Foreign exchange impact
0.3
%
1.3
%
(1.1
%)
0.3
%
Acquisitions and divestitures
(0.5
%)
(0.9
%)
(0.2
%)
(0.6
%)
Discontinued products
(0.6
%)
(0.1
%)
0.5
%
(0.1
%)
Organic sales
(18.4
%)
(14.4
%)
(18.0
%)
(16.7
%)
A reconciliation of reported net sales to organic sales by segment is as follows:
Three Months Ended December 31, 2020
Q4 2020 Change
Three Months Ended December 31, 2019
(in millions, except percentages)
Technologies & Equipment
Consumables
Total
Technologies & Equipment
Consumables
Total
Technologies & Equipment
Consumables
Total
Net sales
$
633
$
449
$
1,082
(5.4
%)
1.6
%
(2.6
%)
$
669
$
442
$
1,111
Foreign exchange impact
3.0
%
1.8
%
2.6
%
Acquisitions and divestitures
(0.5
%)
(0.2
%)
(0.4
%)
Discontinued products
(1.7
%)
(1.1
%)
(1.5
%)
Organic sales
(6.2
%)
1.1
%
(3.3
%)
Year Ended December 31, 2020
2020 Change
Year Ended December 31, 2019
(in millions, except percentages)
Technologies & Equipment
Consumables
Total
Technologies & Equipment
Consumables
Total
Technologies & Equipment
Consumables
Total
Net sales
$
1,961
$
1,381
$
3,342
(14.1
%)
(20.9
%)
(17.1
%)
$
2,283
$
1,746
$
4,029
Foreign exchange impact
0.6
%
—
%
0.3
%
Acquisitions and divestitures
(1.0
%)
(0.1
%)
(0.6
%)
Discontinued products
(0.2
%)
—
%
(0.1
%)
Organic sales
(13.5
%)
(20.8
%)
(16.7
%)
DENTSPLY SIRONA INC. AND SUBSIDIARIES
CONSOLIDATED STATEMENTS OF OPERATIONS
(In millions, except per share amounts and percentages)
(unaudited)
For the three months ended December 31, 2020, a reconciliation of selected items as reported in the Condensed Consolidated Statements of Operations to adjusted Non-GAAP items is as follows:
GAAP
ADJUSTED NON-GAAP
(in millions, except per share amounts and percentages)
Three
Months
Ended
December
31, 2020
Amortization of Purchased
Intangible
Assets
Restructuring Program Related Costs and Other Costs
Business Combination Related Costs and Fair Value Adjustments
Credit Risk
and Fair
Value
Adjustments
Tax Impact of
Non-GAAP Adjustments
Income Tax
Related
Adjustments
Total
Non-GAAP Adjustments
Three
Months
Ended
December
31, 2020
GROSS PROFIT
$
571
30
11
1
—
—
—
$
42
$
613
% OF NET SALES
52.8
%
56.7
%
SELLING, GENERAL, AND ADMINISTRATIVE EXPENSES
421
(19
)
(24
)
(16
)
—
—
—
(59
)
362
% OF NET SALES
38.9
%
33.5
%
RESTRUCTURING AND OTHER COSTS
15
—
(15
)
—
—
—
—
(15
)
—
OPERATING INCOME
135
49
50
17
—
—
—
116
251
% OF NET SALES
12.5
%
23.2
%
OTHER INCOME AND EXPENSE
12
—
(4
)
—
—
(4
)
8
INCOME BEFORE INCOME TAXES
123
49
50
17
4
—
—
120
243
PROVISION FOR INCOME TAXES
24
—
—
—
—
15
12
27
51
% OF PRE-TAX INCOME
19.5
%
21.0
%
NET INCOME ATTRIBUTABLE TO DENTSPLY SIRONA
$
99
$
93
$
192
% OF NET SALES
9.1
%
17.7
%
EARNINGS PER SHARE - DILUTED
$
0.45
$
0.42
$
0.87
For the three months ended December 31, 2020, the following table presents the details of the "Restructuring program related costs and other costs" column in the above table and the affected line item in the Consolidated Statements of Operations:
(in millions)
Asset
Impairments
Separation
Costs Related
to Executives
Costs Related
to Restructuring
Plans
Professional
Services Costs
Total
Cost of products sold
$
—
$
—
$
11
$
—
$
11
Selling, general, and administrative expenses
—
11
1
12
24
Restructuring and other costs
6
—
9
—
15
Total
$
6
$
11
$
21
$
12
$
50
DENTSPLY SIRONA INC. AND SUBSIDIARIES
CONSOLIDATED STATEMENTS OF OPERATIONS
(In millions, except per share amounts and percentages)
(unaudited)
For the three months ended December 31, 2019, a reconciliation of selected items as reported in the Condensed Consolidated Statements of Operations to adjusted Non-GAAP items is as follows:
GAAP
ADJUSTED NON-GAAP
(in millions, except per share amounts and percentages)
Three
Months
Ended
December
31, 2019
Amortization
of Purchased Intangible
Assets
Restructuring Program Related Costs and Other Costs
Business Combination Related Costs and Fair Value Adjustments
Credit Risk
and Fair
Value
Adjustments
Tax Impact of
Non-GAAP Adjustments
Income Tax
Related
Adjustments
Total
Non-GAAP Adjustments
Three
Months
Ended
December
31, 2019
GROSS PROFIT
$
610
30
1
1
—
—
—
$
32
$
642
% OF NET SALES
54.9
%
57.8
%
SELLING, GENERAL, AND ADMINISTRATIVE EXPENSES
460
(17
)
(23
)
—
—
—
—
(40
)
420
% OF NET SALES
41.4
%
37.8
%
RESTRUCTURING AND OTHER COSTS
13
—
(13
)
—
—
—
—
(13
)
—
OPERATING INCOME
137
47
37
1
—
—
—
85
222
% OF NET SALES
12.3
%
20.0
%
OTHER INCOME AND EXPENSE
—
—
6
(2
)
(1
)
—
—
3
3
INCOME BEFORE INCOME TAXES
137
47
31
3
1
—
—
82
219
PROVISION FOR INCOME TAXES
35
—
—
—
—
24
(4
)
20
55
% OF PRE-TAX INCOME
25.5
%
25.1
%
NET INCOME ATTRIBUTABLE TO DENTSPLY SIRONA
$
102
$
62
$
164
% OF NET SALES
9.2
%
14.8
%
EARNINGS PER SHARE - DILUTED
$
0.46
$
0.27
$
0.73
For the three months ended December 31, 2019, the following table presents the details of the "Restructuring program related costs and other costs" column in the above table and the affected line item in the Consolidated Statements of Operations:
(in millions)
Separation
Costs Related
to Executives
Sale or Discontinuation of Non-Strategic Business or Product Lines
Costs Related to Restructuring
Plans
Professional
Services Costs
Incentive Compensation
Other
Total
Cost of products sold
$
—
$
1
$
—
$
—
$
—
$
—
$
1
Selling, general, and administrative expenses
(2
)
—
—
20
5
—
23
Restructuring and other costs
—
—
13
—
—
—
13
Interest expense, Interest income, and Other expense (income), net
—
(12
)
—
—
—
6
(6
)
Total
$
(2
)
$
(11
)
$
13
$
20
$
5
$
6
$
31
DENTSPLY SIRONA INC. AND SUBSIDIARIES
CONSOLIDATED STATEMENTS OF OPERATIONS
(In millions, except per share amounts and percentages)
(unaudited)
For the year ended December 31, 2020, a reconciliation of selected items as reported in the Condensed Consolidated Statements of Operations to adjusted Non-GAAP items is as follows:
GAAP
ADJUSTED NON-GAAP
(in millions, except per share amounts and percentages)
Twelve
Months
Ended
December
31, 2020
Amortization
of Purchased Intangible
Assets
Restructuring Program Related Costs and Other Costs
Business Combination Related Costs and Fair Value Adjustments
Credit Risk
and Fair
Value
Adjustments
Tax Impact of
Non-GAAP Adjustments
Income Tax
Related
Adjustments
Total
Non-GAAP Adjustments
Twelve
Months
Ended
December
31, 2020
GROSS PROFIT
$
1,657
118
44
5
—
—
—
$
167
$
1,824
% OF NET SALES
49.6
%
54.6
%
SELLING, GENERAL, AND ADMINISTRATIVE EXPENSES
1,435
(74
)
(57
)
(17
)
—
—
—
(148
)
1,287
% OF NET SALES
42.9
%
38.5
%
GOODWILL IMPAIRMENT
157
—
(157
)
—
—
—
—
(157
)
—
RESTRUCTURING AND OTHER COSTS
77
—
(77
)
—
—
—
—
(77
)
—
OPERATING (LOSS) INCOME
(12
)
192
335
22
—
—
—
549
537
% OF NET SALES
(0.4
%)
16.1
%
OTHER INCOME AND EXPENSE
48
—
—
—
(9
)
—
—
(9
)
39
(LOSS) INCOME BEFORE INCOME TAXES
(60
)
192
335
22
9
—
—
558
498
PROVISION FOR INCOME TAXES
23
—
—
—
—
90
(9
)
81
104
% OF PRE-TAX INCOME
(38.3
%)
20.9
%
NET (LOSS) INCOME ATTRIBUTABLE TO DENTSPLY SIRONA
$
(83
)
$
477
$
394
% OF NET SALES
(2.5
%)
11.8
%
EARNINGS PER SHARE - DILUTED
$
(0.38
)
$
2.17
$
1.79
For the year ended December 31, 2020, the following table presents the details of the "Restructuring program related costs and other costs" column in the above table and the affected line item in the Consolidated Statements of Operations:
(in millions)
Impairments
Separation
Costs Related
to Executives
Costs Related
to Restructuring
Plans
Professional
Services Costs
Incentive Compensation
Total
Cost of products sold
$
—
$
—
$
44
$
—
$
—
$
44
Selling, general, and administrative expenses
—
10
2
43
2
57
Goodwill impairment
157
—
—
—
—
157
Restructuring and other costs
47
—
30
—
—
77
Total
$
204
$
10
$
76
$
43
$
2
$
335
DENTSPLY SIRONA INC. AND SUBSIDIARIES
CONSOLIDATED STATEMENTS OF OPERATIONS
(In millions, except per share amounts and percentages)
(unaudited)
For the year ended December 31, 2019, a reconciliation of selected items as reported in the Condensed Consolidated Statements of Operations to adjusted Non-GAAP items is as follows:
GAAP
ADJUSTED NON-GAAP
(in millions, except per share amounts and percentages)
Twelve
Months
Ended
December
31, 2019
Amortization
of Purchased Intangible
Assets
Restructuring Program Related Costs and Other Costs
Business Combination Related Costs and Fair Value Adjustments
Credit Risk
and Fair
Value
Adjustments
Tax Impact of
Non-GAAP Adjustments
Income Tax
Related
Adjustments
Total
Non-GAAP Adjustments
Twelve
Months
Ended
December
31, 2019
GROSS PROFIT
$
2,165
116
25
6
—
—
—
$
147
$
2,312
% OF NET SALES
53.7
%
57.4
%
SELLING, GENERAL, AND ADMINISTRATIVE EXPENSES
1,723
(74
)
(78
)
(1
)
—
—
—
(153
)
1,570
% OF NET SALES
42.8
%
39.0
%
RESTRUCTURING AND OTHER COSTS
81
—
(81
)
—
—
—
—
(81
)
—
OPERATING INCOME
361
190
184
7
—
—
—
381
742
% OF NET SALES
9.0
%
18.4
%
OTHER INCOME AND EXPENSE
16
—
1
(3
)
(5
)
—
—
(7
)
9
INCOME BEFORE INCOME TAXES
345
190
183
10
5
—
—
388
733
PROVISION FOR INCOME TAXES
82
—
—
—
—
102
(1
)
101
183
% OF PRE-TAX INCOME
23.8
%
25.0
%
NET INCOME ATTRIBUTABLE TO DENTSPLY SIRONA
$
263
$
287
$
550
% OF NET SALES
6.5
%
13.7
%
EARNINGS PER SHARE - DILUTED
$
1.17
$
1.28
$
2.45
For the year ended December 31, 2019, the following table presents the details of the "Restructuring program related costs and other costs" column in the above table and the affected line item in the Consolidated Statements of Operations:
(in millions)
Asset
Impairments
Separation
Costs Related
to Executives
Sale or Discontinuation of Non-Strategic Business or Product Lines
Costs Related
to Restructuring Plans
Professional Services Costs
Incentive Compensation
Other
Total
Cost of products sold
$
—
$
24
$
—
$
—
$
—
$
1
$
25
Selling, general, and administrative expenses
—
9
11
—
40
15
3
78
Restructuring and other costs
42
1
33
—
—
5
81
Interest expense, Interest income, and Other expense (income), net
—
(7
)
—
—
—
6
(1
)
Total
$
42
$
9
$
29
$
33
$
40
$
15
$
15
$
183
财报并购
100 项与 Straight Smile, LLC. 相关的药物交易
登录后查看更多信息
100 项与 Straight Smile, LLC. 相关的转化医学
登录后查看更多信息
组织架构
使用我们的机构树数据加速您的研究。
登录
或
管线布局
2026年02月08日管线快照
无数据报导
登录后保持更新
药物交易
使用我们的药物交易数据加速您的研究。
登录
或
转化医学
使用我们的转化医学数据加速您的研究。
登录
或
营收
使用 Synapse 探索超过 36 万个组织的财务状况。
登录
或
科研基金(NIH)
访问超过 200 万项资助和基金信息,以提升您的研究之旅。
登录
或
投资
深入了解从初创企业到成熟企业的最新公司投资动态。
登录
或
融资
发掘融资趋势以验证和推进您的投资机会。
登录
或
生物医药百科问答
全新生物医药AI Agent 覆盖科研全链路,让突破性发现快人一步
立即开始免费试用!
智慧芽新药情报库是智慧芽专为生命科学人士构建的基于AI的创新药情报平台,助您全方位提升您的研发与决策效率。
立即开始数据试用!
智慧芽新药库数据也通过智慧芽数据服务平台,以API或者数据包形式对外开放,助您更加充分利用智慧芽新药情报信息。
生物序列数据库
生物药研发创新
免费使用
化学结构数据库
小分子化药研发创新
免费使用