预约演示
更新于:2025-05-07

Cognigen Corp.
更新于:2025-05-07
概览
关联
100 项与 Cognigen Corp. 相关的临床结果
登录后查看更多信息
0 项与 Cognigen Corp. 相关的专利(医药)
登录后查看更多信息
78
项与 Cognigen Corp. 相关的文献(医药)2024-04-01·Advances in Therapy
Exposure–Response Efficacy Modeling to Support Trofinetide Dosing in Individuals with Rett Syndrome
Article
作者: Bishop, Kathie M ; Youakim, James M ; Bradley, Heather ; Passarell, Julie ; Darwish, Mona
2023-05-01·Clinical Pharmacology in Drug Development
Exposure–response Modeling From the CLARITY Trial of Pimavanserin for Adjunctive Treatment of Major Depressive Disorder
Article
作者: Dirks, Bryan ; Howell, Becky ; Stankovic, Srdjan ; Jaworowicz, David ; Passarell, Julie ; Owen, Joel ; Darwish, Mona ; DeKarske, Daryl ; Bihorel, Sebastien
2022-11-01·Journal of Clinical Psychopharmacology
Pimavanserin Exposure-Response Analyses in Patients With Schizophrenia
Article
作者: Stankovic, Srdjan ; Passarell, Julie ; Bugarski-Kirola, Dragana ; Jaworowicz, David ; Owen, Joel ; Darwish, Mona ; DeKarske, Daryl
15
项与 Cognigen Corp. 相关的新闻(医药)2024-10-23
Fiscal 2024 revenue grew 18% year-over-year to $70 million, with diluted earnings per share (EPS) of $0.49
Provides fiscal 2025 revenue guidance of $90 to $93 million (+28% to +33%) and adjusted diluted EPS guidance of $1.07 to $1.20
LANCASTER, Calif.--(BUSINESS WIRE)--Simulations Plus, Inc. (Nasdaq: SLP) (“Simulations Plus”), a leading provider of biosimulation, simulation-enabled performance and intelligence solutions, and medical communications to the biopharma industry, today reported financial results for its fourth quarter and fiscal 2024, ended August 31, 2024.
Fourth Quarter 2024 Financial Highlights (compared to fourth quarter 2023)
Total revenue increased 19% to $18.7 million
Software revenue increased 6% to $9.9 million, representing 53% of total revenue
Services revenue increased 39% to $8.8 million, representing 47% of total revenue
Gross profit of $6.8 million; gross margin was 37%
Adjusted EBITDA of $4.1 million, representing 22% of total revenue, compared to $4.9 million, representing 31% of total revenue
Net income of $0.8 million and diluted EPS of $0.04 versus net income of $0.5 million and diluted EPS of $0.03
Adjusted diluted EPS of $0.06, excluding the impact of acquisition costs, versus adjusted diluted EPS of $0.18
Full Year 2024 Financial Highlights (compared to full year 2023)
Total revenue increased 18% to $70.0 million
Software revenue increased 12% to $41.0 million, representing 59% of total revenue
Services revenue increased 26% to $29.0 million, representing 41% of total revenue
Gross profit of $43.2 million; gross margin was 62%
Adjusted EBITDA of $20.3 million, representing 29% of total revenue, compared to $20.6 million, representing 35% of total revenue
Net income of $10.0 million and diluted EPS of $0.49, equivalent to the prior period
Adjusted diluted EPS of $0.53, excluding the impact of acquisition costs, versus adjusted diluted EPS of $0.67
Management Commentary
“Our fiscal year 2024 results reflected strong performance in both our software and services segments,” said Shawn O’Connor, Chief Executive Officer of Simulations Plus. “Total revenue increased 18%, driven by upgrade releases that advanced our biosimulation leadership across all of our main platforms, including
GastroPlus
®
,
MonolixSuite™
and
ADMET Predictor
®
. Organic revenue growth, excluding the fourth quarter revenue contribution from
Pro-ficiency
, was 14%. Software revenue increased 12%, led by our Clinical Pharmacology & Pharmacometrics (CPP) business unit with its MonolixSuite platform expanding by 20%. Our services segment delivered notable strength, increasing by 26% and exceeding our internal expectations, led by robust growth in our Quantitative Systems Pharmacology (QSP) and CPP business units.
“In June, we acquired Pro-ficiency, the largest and most significant M&A transaction in our Company’s history. This acquisition doubled our total addressable market to $8 billion and is expected to accelerate future growth by expanding our ability to support clients across clinical operations, medical affairs, and commercialization. The integration is progressing ahead of schedule, and we anticipate that our newly combined go-to-market strategies will drive additional business development opportunities. Additionally, our shared scientific and technological capabilities are expected to deliver enhanced products and services, further benefiting our clients.
“Overall, we had a successful year and furthered our leadership position with a one-of-a-kind platform that spans the drug development value chain. I want to thank our expanded team for their unwavering dedication to create value for our customers through innovative science-based software and consulting solutions that optimize treatment options and improve patient lives.
“Looking ahead, we anticipate healthy revenue growth in fiscal 2025. Based upon current market conditions, organic growth is expected to be in the range of 10% to 15%. In addition, the Pro-ficiency acquisition – which encompasses our Adaptive Learning and Insights (ALI) and Medical Communications (MC) business units – is expected to contribute $15 to $18 million. Our fiscal 2025 guidance is as follows:
Fiscal 2025 Guidance
Fiscal 2025 Guidance
Revenue
$90M - $93M
Revenue growth
28 - 33%
Software mix
55 - 60%
Adjusted EBITDA margin
31 - 33%
Adjusted diluted EPS
$1.07 - $1.20
“Moving on to market conditions, the funding environment in both pharma and biotech has been constrained for two consecutive years. While we are encouraged by initial budget discussions with our clients for calendar year 2025, we are maintaining our cautiously optimistic approach, consistent with the strategy we’ve employed over the past few years. Importantly, we believe that we are well-positioned to respond if there is an uptick in spending during the year.
“Finally, our near-term priorities include completing the acquisition integration, expanding cross-selling opportunities, and driving towards our historical adjusted EBITDA margin target of 35-40% and corresponding profitability levels. We remain committed to executing our disciplined growth strategy and delivering long-term value for our stakeholders,” concluded O’Connor.
Webcast and Conference Call Details
Shawn O’Connor, Chief Executive Officer, and Will Frederick, Chief Financial and Operating Officer, will host a conference call and webcast today at 5 p.m. Eastern Time to discuss the details of the Company’s performance for the quarter and certain forward-looking information. The call may be accessed by registering
here
or by calling 1-877-451-6152 (domestic) or 1-201-389-0879 (international) or by clicking on this
Call me™
link to request a return call. The webcast can be accessed on the investor relations page of the Simulations Plus website
where it will also be available for replay approximately one hour following the call.
Non-GAAP Definitions
This press release contains “non-GAAP financial measures,” which are measures that either exclude or include amounts that are not excluded or included in the most directly comparable measures calculated and presented in accordance with U.S. generally accepted accounting principles (“GAAP”).
A further explanation and reconciliation of these non-GAAP financial measures is included below and in the financial tables in this release.
The Company believes that the non-GAAP financial measures presented facilitate an understanding of operating performance and provide a meaningful comparison of its results between periods. The Company’s management uses non-GAAP financial measures to, among other things, evaluate its ongoing operations in relation to historical results, for internal planning and forecasting purposes and in the calculation of performance-based compensation. Adjusted EBITDA and Adjusted Diluted EPS represent measures that we believe are customarily used by investors and analysts to evaluate the financial performance of companies in addition to the GAAP measures that we present. Our management also believes that these measures are useful in evaluating our core operating results. However, Adjusted EBITDA and Adjusted Diluted EPS are not measures of financial performance under accounting principles generally accepted in the United States of America and should not be considered an alternative to net income, operating income, or diluted EPS as indicators of our operating performance or to net cash provided by operating activities as a measure of our liquidity. We believe the Company’s Adjusted EBITDA and Adjusted Diluted EPS measures provide information that is directly comparable to that provided by other peer companies in our industry, but other companies may calculate non-GAAP financial results differently, particularly related to nonrecurring, unusual items.
Please note that the Company has not reconciled the adjusted EBITDA or adjusted diluted earnings per share forward-looking guidance included in this press release to the most directly comparable GAAP measures because this cannot be done without unreasonable effort due to the variability and low visibility with respect to costs related to acquisitions, financings, and employee stock compensation programs, which are potential adjustments to future earnings. We expect the variability of these items to have a potentially unpredictable, and a potentially significant, impact on our future GAAP financial results.
Adjusted EBITDA
Adjusted EBITDA is defined as earnings (loss) before interest, taxes, depreciation and amortization, stock-based compensation, (gain) loss on currency exchange, any acquisition- or financial-transaction-related expenses, change in value of contingent consideration, and any asset impairment charges. Currency exchange excluded represents the exchange rate fluctuations on the foreign-currency-denominated transactions. The impact of transactions in foreign currency represents the effect of converting revenue and expenses occurring in a currency other than the functional currency.
Adjusted Diluted EPS
Adjusted Diluted EPS is calculated based on net income excluding the impact related to the previous items.
Adjusted Diluted EPS for fiscal 2024 is calculated based on net income excluding the impact of any acquisition- or financial-transaction-related expenses, any asset impairment charges, change in value of contingent consideration, and tax provisions/benefits related to the previous items.
The Company excludes the above items because they are outside of the Company’s normal operations and/or, in certain cases, are difficult to forecast accurately for future periods.
About Simulations Plus
With more than 25 years of experience serving clients globally, Simulations Plus stands as a premier provider in the biopharma sector, offering advanced software and consulting services that enhance drug discovery, development, research, clinical trial operations, regulatory submissions, and commercialization. Our comprehensive biosimulation solutions integrate artificial intelligence/machine learning (AI/ML), physiologically based pharmacokinetics, physiologically based biopharmaceutics, quantitative systems pharmacology/toxicology, and population PK/PD modeling approaches. We also deliver simulation-enabled performance and intelligence solutions alongside medical communications support for clinical and commercial drug development. Our cutting-edge technology is licensed and utilized by leading pharmaceutical, biotechnology, and regulatory agencies worldwide. For more information, visit our website at
. Follow us on
LinkedIn
|
X
|
YouTube
.
Environmental, Social, and Governance
We focus our Environmental, Social, and Governance (ESG) efforts where we can have the most positive impact. To learn more about our latest initiatives and priorities, please visit our website to read our
2023 ESG update
.
Forward-Looking Statements
Except for historical information, the matters discussed in this press release are forward-looking statements that involve risks and uncertainties. Words like “believe,” “expect,” and “anticipate” mean that these are our best estimates as of this writing, but there can be no assurances that expected or anticipated results or events will actually take place, so our actual future results could differ significantly from those statements. Factors that could cause or contribute to such differences include, but are not limited to: our ability to successfully integrate the Pro-ficiency business with our own as well as expenses we may incur in connection therewith, our ability to maintain our competitive advantages, acceptance of new software and improved versions of our existing software by our customers, the general economics of the pharmaceutical industry, our ability to finance growth, our ability to continue to attract and retain highly qualified technical staff, market conditions, macroeconomic factors, and a sustainable market. Further information on our risk factors is contained in our quarterly and annual reports and filed with the U.S. Securities and Exchange Commission.
SIMULATIONS PLUS, INC.
CONSOLIDATED STATEMENTS OF OPERATIONS AND COMPREHENSIVE INCOME
Years ended August 31,
(in thousands, except per common share amounts)
2024
2023
2022
Revenues
Software
$
41,024
$
36,517
$
32,642
Services
28,989
23,060
21,264
Total revenues
70,013
59,577
53,906
Cost of revenues
Software
6,478
3,627
3,060
Services
20,384
8,003
7,762
Total cost of revenues
26,862
11,630
10,822
Gross profit
43,151
47,947
43,084
Operating expenses
Research and development
5,754
4,504
3,208
Sales and marketing
8,915
6,558
4,879
General and administrative
22,351
28,160
20,086
Total operating expenses
37,020
39,222
28,173
Income from operations
6,131
8,725
14,911
Other income
6,280
2,970
204
Income before income taxes
12,411
11,695
15,115
Provision for income taxes
(2,457
)
(1,734
)
(2,632
)
Net income
$
9,954
$
9,961
$
12,483
Earnings per share
Basic
$
0.50
$
0.50
$
0.62
Diluted
$
0.49
$
0.49
$
0.60
Weighted-average common shares outstanding
Basic
19,987
20,075
20,196
Diluted
20,301
20,465
20,749
Other comprehensive (loss) income, net of tax
Foreign currency translation adjustments
(105
)
167
(265
)
Unrealized losses on available-for-sale securities
$
(5
)
$
—
$
—
Comprehensive income
$
9,844
$
10,128
$
12,218
SIMULATIONS PLUS, INC.
CONSOLIDATED BALANCE SHEETS
(in thousands, except share and per share amounts)
August 31, 2024
August 31, 2023
ASSETS
Current assets
Cash and cash equivalents
$
10,311
$
57,523
Accounts receivable, net of allowance for credit losses of $149 and $46
9,136
10,201
Prepaid income taxes
2,197
804
Prepaid expenses and other current assets
7,753
3,904
Short-term investments
9,944
57,940
Total current assets
39,341
130,372
Long-term assets
Capitalized computer software development costs, net of accumulated amortization of $18,727 and $17,199
12,499
11,335
Property and equipment, net
812
671
Operating lease right-of-use assets
1,027
1,247
Intellectual property, net of accumulated amortization of $5,490 and $9,301
23,130
8,689
Other intangible assets, net of accumulated amortization of $3,177 and $2,107
23,210
12,825
Goodwill
96,078
19,099
Deferred tax assets
—
1,438
Other assets
542
425
Total assets
$
196,639
$
186,101
LIABILITIES AND SHAREHOLDERS’ EQUITY
Current liabilities
Accounts payable
$
602
$
144
Accrued compensation
4,513
4,392
Accrued expenses
2,043
659
Contracts payable
2,440
3,250
Operating lease liability - current portion
475
442
Deferred revenue
1,996
3,100
Total current liabilities
12,069
11,987
Long-term liabilities
Deferred income taxes, net
1,608
—
Operating lease liability
531
755
Contracts payable – net of current portion
—
3,330
Total liabilities
14,208
16,072
Commitments and contingencies
—
—
Shareholders’ equity
Preferred stock, $0.001 par value - 10,000,000 shares authorized; no shares issued and outstanding
$
—
$
—
Common stock, $0.001 par value and additional paid-in capital —50,000,000 shares authorized; 20,051,134 and 19,937,961 shares issued and outstanding
152,328
144,974
Retained earnings
30,354
25,196
Accumulated other comprehensive loss
(251
)
(141
)
Total shareholders’ equity
182,431
170,029
Total liabilities and shareholders’ equity
$
196,639
$
186,101
SIMULATIONS PLUS, INC.
Trended Financial Information*
(Unaudited)
(in millions except earnings per share amounts)
FY 2023
FY 2024
FY 2022
FY 2023
FY 2024
Q1
Q2
Q3
Q4
Q1
Q2
Q3
Q4
Full Year
Full Year
Full Year
Revenue
Software
$
6.1
$
10.5
$
10.6
$
9.3
$
7.6
$
11.6
$
11.9
$
9.9
$
32.7
$
36.5
$
41.0
Services
$
5.9
$
5.3
$
5.6
$
6.3
$
6.9
$
6.7
$
6.6
$
8.8
$
21.2
$
23.1
$
29.0
Total
$
12.0
$
15.8
$
16.2
$
15.6
$
14.5
$
18.3
$
18.5
$
18.7
$
53.9
$
59.6
$
70.0
Gross Margin
Software
85.4
%
92.0
%
91.5
%
89.4
%
86.9
%
88.4
%
88.2
%
72.4
%
90.6
%
90.1
%
84.2
%
Services
69.7
%
66.2
%
63.4
%
62.1
%
47.0
%
44.2
%
41.4
%
-4.0
%
63.5
%
65.3
%
29.7
%
Total
77.7
%
83.4
%
81.8
%
78.4
%
67.9
%
72.2
%
71.5
%
36.6
%
79.9
%
80.5
%
61.6
%
Income from operations
$
0.9
$
4.0
$
4.1
$
(0.3
)
$
1.0
$
4.4
$
1.9
$
(1.2
)
$
14.9
$
8.7
$
6.1
Operating Margin
7.3
%
25.6
%
25.2
%
-1.8
%
6.6
%
24.3
%
10.1
%
-6.2
%
27.7
%
14.6
%
8.8
%
Net Income
$
1.2
$
4.2
$
4.0
$
0.5
$
1.9
$
4.0
$
3.1
$
0.8
$
12.5
$
10.0
$
10.0
Diluted Earnings Per Share
$
0.06
$
0.20
$
0.20
$
0.03
$
0.10
$
0.20
$
0.15
$
0.04
$
0.60
$
0.49
$
0.49
Adjusted EBITDA
$
3.0
$
6.2
$
6.5
$
4.9
$
3.4
$
7.1
$
5.6
$
4.1
$
21.5
$
20.6
$
20.3
Adjusted Diluted EPS
$
0.07
$
0.21
$
0.21
$
0.18
$
0.09
$
0.22
$
0.17
$
0.06
$
0.63
$
0.67
$
0.53
Cash Flow from Operations
$
4.7
$
5.5
$
8.5
$
3.1
$
0.2
$
5.8
$
5.7
$
1.6
$
17.9
$
21.9
$
13.3
Revenue Breakdown by Region
Americas
$
8.5
$
10.6
$
10.8
$
11.0
$
10.9
$
12.5
$
12.4
$
14.7
$
37.7
$
40.8
$
50.4
EMEA
2.1
3.6
3.4
2.6
2.3
4.7
4.5
2.6
10.4
11.7
14.1
Asia Pacific
1.3
1.5
2.1
2.1
1.3
1.2
1.6
1.4
5.8
7.0
5.5
Total
$
12.0
$
15.8
$
16.2
$
15.6
$
14.5
$
18.3
$
18.5
$
18.7
$
53.9
$
59.6
$
70.0
Software Performance Metrics
Average Revenue per Customer (in thousands)
Commercial
$
68.0
$
110.0
$
97.0
88.0
$
79.0
$
113.0
$
97.0
$
89.0
Services Performance Metrics
Backlog (in millions)
$
15.8
$
15.4
$
15.7
$
19.5
$
18.9
$
18.0
$
19.6
$
14.1
*Numbers may not add due to rounding
SIMULATIONS PLUS, INC.
Reconciliation of Adjusted EBITDA to Net Income*
(Unaudited)
(in millions)
FY 2023
FY 2024
FY 2022
FY 2023
FY 2024
Q1
Q2
Q3
Q4
Q1
Q2
Q3
Q4
Full Year
Full Year
Full Year
Net Income
$
1.2
$
4.2
$
4.0
$
0.5
$
1.9
$
4.0
$
3.1
$
0.8
$
12.5
$
10.0
$
10.0
Excluding:
Interest income and expense, net
(0.8
)
(1.0
)
(1.1
)
(1.3
)
(1.3
)
(1.3
)
(1.5
)
(0.2
)
(0.7
)
(4.1
)
(4.4
)
Provision for income taxes
0.4
0.9
0.9
(0.5
)
0.5
1.2
0.8
—
2.6
1.7
2.5
Depreciation and amortization
0.9
0.9
0.9
1.1
1.1
1.1
1.3
2.2
3.6
3.9
5.7
Stock-based compensation
0.9
1.2
1.1
1.1
1.3
1.6
1.7
1.4
2.7
4.2
5.9
(Gain) loss on currency exchange
—
—
0.3
0.2
—
0.1
—
(0.4
)
0.2
0.5
(0.4
)
Impairment of other intangibles
—
—
—
0.5
—
—
—
—
—
0.5
—
Change in value of contingent consideration
—
—
—
0.7
(0.1
)
0.4
(0.6
)
(1.4
)
0.3
0.7
(1.6
)
Mergers & Acquisitions expense
0.3
0.1
0.4
2.5
—
—
0.9
1.7
0.3
3.3
2.6
Adjusted EBITDA
$
3.0
$
6.2
$
6.5
$
4.9
$
3.4
$
7.1
$
5.6
$
4.1
$
21.5
$
20.6
$
20.3
*Numbers may not add due to rounding
SIMULATIONS PLUS, INC.
Reconciliation of Adjusted Diluted EPS to Diluted EPS*
(Unaudited)
(in millions, except Diluted EPS and Adjusted Diluted EPS)
FY 2023
FY 2024
FY 2022
FY 2023
FY 2024
Q1
Q2
Q3
Q4
Q1
Q2
Q3
Q4
Full Year
Full Year
Full Year
Net Income (GAAP)
$
1.2
$
4.2
$
4.0
$
0.5
$
1.9
$
4.0
$
3.1
$
0.8
$
12.5
$
10.0
$
10.0
Excluding:
Mergers & Acquisitions expense
0.3
0.1
0.4
0.9
—
—
0.9
1.7
0.3
1.7
2.6
Immunetrics transaction costs
—
—
—
1.6
—
—
—
—
—
1.6
—
Change in value of contingent consideration
—
—
—
0.7
(0.1
)
0.4
(0.6
)
(1.4
)
0.3
0.7
(1.6
)
Cognigen trade name write-off
—
—
—
0.5
—
—
—
—
—
0.5
—
Tax effect on above adjustments
(0.1
)
—
(0.1
)
(0.5
)
—
(0.1
)
(0.1
)
(0.1
)
(0.1
)
(0.7
)
(0.2
)
Adjusted Net income (Non-GAAP)
$
1.5
$
4.2
$
4.3
$
3.7
$
1.8
$
4.4
$
3.4
$
1.1
$
13.0
$
13.8
$
10.8
Weighted-average common shares outstanding:
Diluted
20.8
20.5
20.4
20.4
20.3
20.3
20.4
20.3
20.7
20.5
20.3
Diluted EPS (GAAP)
$
0.06
$
0.20
$
0.20
$
0.03
$
0.10
$
0.20
$
0.15
$
0.04
$
0.60
$
0.49
$
0.49
Adjusted Diluted EPS (Non-GAAP)
$
0.07
$
0.21
$
0.21
$
0.18
$
0.09
$
0.22
$
0.17
$
0.06
$
0.63
$
0.67
$
0.53
*Numbers may not add due to rounding
Contacts
Investor Relations Contacts
:
Lisa Fortuna
Financial Profiles
310-622-8251
slp@finpro
Renee Bouche
Simulations Plus Investor Relations
661-723-7723
renee.bouche@simulations-plus.com
并购财报
2024-07-02
Total revenue of $18.5 million and diluted earnings per share (EPS) of $0.15
Maintains full-year revenue guidance of $69 to $72 million and updates EPS guidance
LANCASTER, Calif.--(BUSINESS WIRE)-- Simulations Plus, Inc., (Nasdaq: SLP) (“Simulations Plus”), a leading provider of biosimulation, simulation-enabled performance and intelligence solutions, and medical communications for the biopharma industry, today reported financial results for its third quarter fiscal 2024, ended May 31, 2024.
Third Quarter 2024 Financial Highlights (compared to third quarter 2023)
Total revenue increased 14% to $18.5 million
Software revenue increased 12% to $11.9 million, representing 64% of total revenue
Services revenue increased 18% to $6.6 million, representing 36% of total revenue
Gross profit was constant at $13.3 million; gross margin was 71%
Adjusted EBITDA of $5.7 million, representing 31% of total revenue
Net income of $3.1 million and diluted earnings per share (EPS) of $0.15 versus net income of $4.0 million and diluted EPS of $0.20
Adjusted diluted EPS excluding the impact of acquisition costs of $0.19 versus adjusted diluted EPS of $0.21
Nine Months 2024 Financial Highlights (compared to nine months 2023)
Total revenue increased 17% to $51.3 million
Software revenue increased 14% to $31.1 million, representing 61% of total revenue
Services revenue increased 21% to $20.2 million, representing 39% of total revenue
Gross profit increased 2% to $36.3 million; gross margin was 71%
Adjusted EBITDA of $16.2 million, representing 32% of total revenue
Net income of $9.1 million and diluted EPS of $0.45 versus net income of $9.4 million and diluted EPS of $0.46
Adjusted diluted EPS excluding the impact of acquisition costs was constant at of $0.49
Management Commentary
“Our third quarter results reflected continued solid performance in both our software and services segments,” said Shawn O’Connor, Chief Executive Officer of Simulations Plus. “Total revenue increased 14%, led by higher software sales in our Cheminformatics and Clinical Pharmacology & Pharmacometrics (CPP) business units, with strong growth in our ADMET Predictor® and MonolixSuite™ platforms, respectively. Our Physiologically Based Pharmacokinetics (PBPK) business unit also performed well, reflecting higher revenues from GastroPlus®. During the quarter, we were excited to launch GastroPlus X, the next generation of physiologically based pharmacokinetics/biopharmaceutics (PBPK/PBBM) modeling and simulation software and believe it will become a meaningful addition to our suite of leading-edge solutions. The 18% increase in services revenue was driven by strong growth in our Quantitative Systems Pharmacology (QSP) and CPP business units.
“Biotech funding is starting to show signs of recovery, most notably for companies that have drug candidates in the clinic. We continue to be cautiously optimistic about the funding environment for our biotech clients. We see a range of spending patterns among large pharmaceutical companies. Some are increasing expenditures, while others remain conservative, with most falling in between depending on various internal and external market factors. Overall, the market is in a better position today compared to a year ago.
“Our acquisition of Pro-ficiency on June 11th brings together our collective expertise in simulations, AI technologies and focus on science, creating a one-of-a-kind platform that spans across the drug development continuum. The Pro-ficiency integration and collaboration is progressing in-line with our internal plan and schedule with positive responses from our clients.
“Our performance in the first nine months of the year remains aligned with our original fiscal 2024 revenue guidance. The newly formed Clinical Simulations and Medical Communications (CSMC) business unit is expected to contribute approximately $3 million to our fiscal 2024 revenue. We are entering our final fiscal quarter of 2024 with a healthy pipeline and remain confident that Simulations Plus is well positioned to achieve its goals for the fiscal year. Going forward, we remain committed to a disciplined growth strategy that will deliver long-term returns for our shareholders.”
Fiscal 2024 Guidance
Fiscal 2024
Guidance
Revenue
$69M - $72M
Revenue growth
15 - 20%
Software mix
55 - 60%
Services mix
40 - 45%
Diluted EPS
$0.46 - $0.48
Adjusted diluted EPS
$0.54 - $0.56
Quarterly Dividend
The Simulations Plus Board of Directors has determined to discontinue the Company’s quarterly cash dividend and reallocate these funds to our capital allocation strategy for investing in growth initiatives that are intended to generate long-term shareholder value. The final dividend of $0.06 per share of the Company’s common stock will be paid on August 5, 2024, to shareholders of record as of July 29, 2024.
Environmental, Social, and Governance
We focus our Environmental, Social, and Governance (ESG) efforts where we can have the most positive impact. To learn more about our latest initiatives and priorities, please visit our website to read our 2023 ESG update.
Webcast and Conference Call Details
Shawn O’Connor, Chief Executive Officer, and Will Frederick, Chief Financial and Operating Officer, will host a conference call and webcast today at 5 p.m. Eastern Time to discuss the details of the Company’s performance for the quarter and certain forward-looking information. The call may be accessed by registering here or by calling 1-877-451-6152 (domestic) or 1-201-389-0879 (international) or by clicking on this Call me™ link to request a return call. The webcast will be available on our website on the investor relations page of the Simulations Plus website at . A replay of the webcast will be available on the website approximately one hour following the call.
Non-GAAP Definitions
Adjusted EBITDA
Adjusted EBITDA is defined as earnings (loss) before interest, taxes, depreciation and amortization, stock-based compensation, (gain) loss on currency exchange, any acquisition- or financial-transaction-related expenses, and any asset impairment charges. Currency exchange excluded represents the exchange rate fluctuations on the foreign currency denominated transactions. The impact of transactions in foreign currency represents the effect of converting revenue and expenses occurring in a currency other than the functional currency. The Company believes that the non-GAAP financial measures presented facilitate an understanding of operating performance and provide a meaningful comparison of its results between periods. The Company’s management uses non-GAAP financial measures to, among other things, evaluate its ongoing operations in relation to historical results, for internal planning and forecasting purposes and in the calculation of performance-based compensation. Adjusted EBITDA represents a measure that we believe is customarily used by investors and analysts to evaluate the financial performance of companies in addition to the GAAP measures that we present. Our management also believes that Adjusted EBITDA is useful in evaluating our core operating results. However, Adjusted EBITDA is not a measure of financial performance under accounting principles generally accepted in the United States of America and should not be considered an alternative to net income or operating income as an indicator of our operating performance or to net cash provided by operating activities as a measure of our liquidity. The Company’s Adjusted EBITDA measure may not provide information that is directly comparable to that provided by other companies in its industry, as other companies in its industry may calculate non-GAAP financial results differently, particularly related to nonrecurring, unusual items.
Adjusted Diluted EPS
Adjusted diluted EPS is calculated based on net income excluding the impact of any acquisition- or financial-transaction-related expenses, any asset impairment charges, and tax provisions / benefits related to the previous items. The Company excludes the above items because they are outside of the Company’s normal operations and/or, in certain cases, are difficult to forecast accurately for future periods.
The Company believes that the use of non-GAAP measures helps investors to gain a better understanding of the Company’s core operating results and future prospects, consistent with how management measures and forecasts the Company’s performance, especially when comparing such results to previous periods or forecasts.
About Simulations Plus
With more than 25 years of experience serving clients globally, Simulations Plus stands as a premier provider in the Biopharma sector, offering advanced software and consulting services that enhance drug discovery, development, research, clinical trial operations, regulatory submissions, and commercialization. Our comprehensive biosimulation solutions integrate artificial intelligence/machine learning (AI/ML), physiologically based pharmacokinetics, quantitative systems pharmacology/toxicology, and population PK/PD modeling approaches. We also deliver simulation-enabled performance and intelligence solutions alongside medical communications support for clinical and commercial drug development. Our cutting-edge technology is licensed and utilized by leading pharmaceutical, biotechnology, and regulatory agencies worldwide. For more information, visit our website at . Follow us on LinkedIn | X | YouTube.
Forward-Looking Statements
Except for historical information, the matters discussed in this press release are forward-looking statements that involve risks and uncertainties. Words like “believe,” “expect,” and “anticipate” mean that these are our best estimates as of this writing, but there can be no assurances that expected or anticipated results or events will actually take place, so our actual future results could differ significantly from those statements. Factors that could cause or contribute to such differences include, but are not limited to: our ability to successfully integrate the Pro-ficiency business with our own, as well as expenses we may incur in connection therewith, our ability to maintain our competitive advantages, acceptance of new software and improved versions of our existing software by our customers, the general economics of the pharmaceutical industry, our ability to finance growth, our ability to continue to attract and retain highly qualified technical staff, market conditions, macroeconomic factors, and a sustainable market. Further information on our risk factors is contained in our quarterly and annual reports and filed with the U.S. Securities and Exchange Commission.
SIMULATIONS PLUS, INC.
CONDENSED CONSOLIDATED STATEMENTS OF OPERATIONS AND COMPREHENSIVE INCOME
(Unaudited)
Three Months Ended
Nine Months Ended
(in thousands, except per common share amounts)
May 31, 2024
May 31, 2023
May 31, 2024
May 31, 2023
Revenues
Software
$
11,908
$
10,632
$
31,111
$
27,193
Services
6,636
5,602
20,238
16,755
Total revenues
18,544
16,234
51,349
43,948
Cost of revenues
Software
1,400
908
3,739
2,636
Services
3,887
2,053
11,284
5,616
Total cost of revenues
5,287
2,961
15,023
8,252
Gross profit
13,257
13,273
36,326
35,696
Operating expenses
Research and development
1,300
945
3,829
3,428
Sales and marketing
2,399
1,683
6,337
4,898
General and administrative
7,678
6,548
18,878
18,361
Total operating expenses
11,377
9,176
29,044
26,687
Income from operations
1,880
4,097
7,282
9,009
Other income
2,010
843
4,266
2,617
Income before income taxes
3,890
4,940
11,548
11,626
Provision for income taxes
(753
)
(932
)
(2,437
)
(2,199
)
Net income
$
3,137
$
4,008
$
9,111
$
9,427
Earnings per share
Basic
$
0.16
$
0.20
$
0.46
$
0.47
Diluted
$
0.15
$
0.20
$
0.45
$
0.46
Weighted-average common shares outstanding
Basic
19,995
19,972
19,972
20,123
Diluted
20,433
20,355
20,324
20,512
Other comprehensive (loss) income, net of tax
Foreign currency translation adjustments
(56
)
144
(125
)
174
Unrealized losses on available-for-sale securities
$
(39
)
$
—
$
(39
)
$
—
Comprehensive income
$
3,042
$
4,152
$
8,947
$
9,601
SIMULATIONS PLUS, INC.
CONDENSED CONSOLIDATED BALANCE SHEETS
(Unaudited)
(Audited)
(in thousands, except share and per share amounts)
May 31, 2024
August 31, 2023
ASSETS
Current assets
Cash and cash equivalents
$
109,092
$
57,523
Accounts receivable, net of allowance for credit losses of $149 and $46
10,144
10,201
Prepaid income taxes
1,202
804
Prepaid expenses and other current assets
5,303
3,904
Short-term investments
9,875
57,940
Total current assets
135,616
130,372
Long-term assets
Capitalized computer software development costs, net of accumulated amortization of $18,502 and $17,199
12,614
11,335
Property and equipment, net
882
671
Operating lease right-of-use assets
948
1,247
Intellectual property, net of accumulated amortization of $10,498 and $9,301
7,492
8,689
Other intangible assets, net of accumulated amortization of $2,862 and $2,107
12,712
12,825
Goodwill
19,099
19,099
Deferred tax assets
2,804
1,438
Other assets
524
425
Total assets
$
192,691
$
186,101
LIABILITIES AND SHAREHOLDERS' EQUITY
Current liabilities
Accounts payable
$
658
$
144
Accrued compensation
4,111
4,392
Accrued expenses
894
659
Contracts payable
3,810
3,250
Operating lease liability - current portion
410
442
Deferred revenue
1,437
3,100
Total current liabilities
11,320
11,987
Long-term liabilities
Operating lease liability
512
755
Contracts payable – net of current portion
—
3,330
Total liabilities
11,832
16,072
Commitments and contingencies
—
—
Shareholders' equity
Preferred stock, $0.001 par value - 10,000,000 shares authorized; no shares issued and outstanding
$
—
$
—
Common stock, $0.001 par value and additional paid-in capital —50,000,000 shares authorized; 20,007,488 and 19,937,961 shares issued and outstanding
150,451
144,974
Retained earnings
30,713
25,196
Accumulated other comprehensive loss
(305
)
(141
)
Total shareholders' equity
180,859
170,029
Total liabilities and shareholders' equity
$
192,691
$
186,101
SIMULATIONS PLUS, INC.
Trended Financial Information*
(Unaudited)
(in millions except earnings per share amounts)
FY 2023
FY 2024
FY
2023
FY
2024
Q1
Q2
Q3
Q4
Q1
Q2
Q3
Full
Year
YTD
Revenue
Software
$
6.1
$
10.5
$
10.6
$
9.3
$
7.6
$
11.6
$
11.9
$
36.5
$
31.1
Services
$
5.9
$
5.3
$
5.6
$
6.3
$
6.9
$
6.7
$
6.6
$
23.1
$
20.2
Total
$
12.0
$
15.8
$
16.2
$
15.6
$
14.5
$
18.3
$
18.5
$
59.6
$
51.3
Gross Margin
Software
85.4
%
92.0
%
91.5
%
89.4
%
86.9
%
88.4
%
88.2
%
90.1
%
88.0
%
Services
69.7
%
66.2
%
63.4
%
62.1
%
47.0
%
44.2
%
41.4
%
65.3
%
44.2
%
Total
77.7
%
83.4
%
81.8
%
78.4
%
67.9
%
72.2
%
71.5
%
80.5
%
70.7
%
Income from operations
$
0.9
$
4.0
$
4.1
$
(0.3
)
$
1.0
$
4.4
$
1.9
$
8.7
$
7.3
Operating Margin
7.3
%
25.6
%
25.2
%
-1.8
%
6.6
%
24.3
%
10.1
%
14.6
%
14.2
%
Net Income
$
1.2
$
4.2
$
4.0
$
0.5
$
1.9
$
4.0
$
3.1
$
10.0
$
9.1
Diluted Earnings Per Share
$
0.06
$
0.20
$
0.20
$
0.03
$
0.10
$
0.20
$
0.15
$
0.49
$
0.45
Adjusted EBITDA
$
3.0
$
6.2
$
6.5
$
4.9
$
3.4
$
7.1
$
5.7
$
20.6
$
16.2
Adjusted Diluted EPS
$
0.07
$
0.21
$
0.21
$
0.18
$
0.10
$
0.20
$
0.19
$
0.67
$
0.10
Cash Flow from Operations
$
4.7
$
5.5
$
8.5
$
3.1
$
0.2
$
5.8
$
5.7
$
21.9
$
11.7
Revenue Breakdown by Region
Americas
$
8.5
$
10.6
$
10.8
$
11.0
$
10.9
$
12.5
$
12.4
$
40.8
$
35.8
EMEA
2.1
3.6
3.4
2.6
2.3
4.7
4.5
11.7
11.5
Asia Pacific
1.3
1.5
2.1
2.1
1.3
1.2
1.6
7.0
4.1
Total
$
12.0
$
15.8
$
16.2
$
15.6
$
14.5
$
18.3
$
18.5
$
59.6
$
51.3
Software Performance Metrics
Average Revenue per Customer (in thousands)
Commercial
$
68.0
$
110.0
$
97.0
88.0
$
79.0
$
113.0
$
97.0
Services Performance Metrics
Backlog (in millions)
$
15.8
$
15.4
$
15.7
$
19.5
$
18.9
$
18.0
$
19.6
*Numbers may not add due to rounding
SIMULATIONS PLUS, INC.
Reconciliation of Adjusted EBITDA to Net Income*
(Unaudited)
(in millions)
FY 2023
FY 2024
FY
2022
FY
2023
FY
2024
Q1
Q2
Q3
Q4
Q1
Q2
Q3
Full
Year
Full
Year
YTD
Net Income
$
1.2
$
4.2
$
4.0
$
0.5
$
1.9
$
4.0
$
3.1
$
12.5
$
10.0
$
9.1
Excluding:
Interest income and expense, net
(0.8
)
(1.0
)
(1.1
)
(1.3
)
(1.3
)
(1.3
)
(1.5
)
(0.7
)
(4.1
)
(4.2
)
Provision for income taxes
0.4
0.9
0.9
(0.5
)
0.5
1.2
0.8
2.6
1.7
2.4
Depreciation and amortization
0.9
0.9
0.9
1.1
1.1
1.1
1.3
3.6
3.9
3.5
Stock-based compensation
0.9
1.2
1.1
1.1
1.3
1.6
1.7
2.7
4.2
4.6
(Gain) loss on currency exchange
—
—
0.3
0.2
—
0.1
—
0.2
0.5
—
Impairment of other intangibles
—
—
—
0.5
—
—
—
—
0.5
—
Change in value of contingent consideration
—
—
—
0.7
(0.1
)
0.4
(0.6
)
0.3
0.7
(0.3
)
Mergers & Acquisitions expense
0.3
0.1
0.4
2.5
—
—
0.9
0.3
3.3
0.9
Adjusted EBITDA
$
3.0
$
6.2
$
6.5
$
4.9
$
3.4
$
7.1
$
5.7
$
21.5
$
20.6
$
16.2
*Numbers may not add due to rounding
SIMULATIONS PLUS, INC.
Reconciliation of Adjusted Diluted EPS to Diluted EPS*
(Unaudited)
(in millions, except Diluted EPS and Adjusted Diluted EPS)
FY 2023
FY 2024
FY
2022
FY
2023
FY
2024
Q1
Q2
Q3
Q4
Q1
Q2
Q3
Full
Year
Full
Year
YTD
Net Income (GAAP)
$
1.2
$
4.2
$
4.0
$
0.5
$
1.9
$
4.0
$
3.1
$
12.5
$
10.0
$
9.1
Excluding:
Mergers & Acquisitions expense
0.3
0.1
0.4
0.9
—
—
0.9
0.3
1.7
0.9
Immunetrics transaction costs
—
—
—
2.3
—
—
—
—
2.3
—
Cognigen trade name write-off
—
—
—
0.5
—
—
—
—
0.5
—
Tax effect on above adjustments
(0.1
)
—
(0.1
)
(0.5
)
—
—
(0.2
)
(0.1
)
(0.7
)
(0.2
)
Adjusted Net income (Non-GAAP)
$
1.5
$
4.2
$
4.3
$
3.7
$
1.9
$
4.0
$
3.9
$
12.8
$
13.8
$
9.9
Weighted-average common shares outstanding:
Diluted
20.8
20.5
20.4
20.4
20.3
20.3
20.4
20.7
20.5
20.3
Diluted EPS (GAAP)
$
0.06
$
0.20
$
0.20
$
0.03
$
0.10
$
0.20
$
0.15
$
0.60
$
0.49
$
0.45
Adjusted Diluted EPS (Non-GAAP)
$
0.07
$
0.21
$
0.21
$
0.18
$
0.10
$
0.20
$
0.19
$
0.61
$
0.67
$
0.49
*Numbers may not add due to rounding
并购财报
2024-04-03
Total revenue of $18.3 million and diluted earnings per share (EPS) of $0.20
Maintains full-year revenue guidance of $66 to $69 million (+10-15%) and EPS guidance of $0.66 to $0.68
LANCASTER, Calif.--(BUSINESS WIRE)-- Simulations Plus, Inc. (NASDAQ: SLP) (“Simulations Plus”), a leading provider of modeling and simulation software and services for pharmaceutical safety and efficacy, today reported financial results for its second quarter fiscal 2024, ended February 29, 2024.
Second Quarter 2024 Financial Highlights (compared to second quarter 2023)
Total revenue increased 16% to $18.3 million
Software revenue increased 11% to $11.6 million, representing 63% of total revenue
Services revenue increased 27% to $6.7 million, representing 37% of total revenue
Gross profit increased to $13.2 million; gross margin was 72%
Adjusted EBITDA of $7.1 million, representing 39% of total revenue
Net income of $4.0 million and diluted earnings per share (EPS) of $0.20 versus net income of $4.2 million and diluted EPS of $0.20
Six Months 2024 Financial Highlights (compared to six months 2023)
Total revenue increased 18% to $32.8 million
Software revenue increased 16% to $19.2 million
Services revenue increased 22% to $13.6 million
Gross profit increased 3% to $23.1 million; gross margin was 70%
Adjusted EBITDA of $10.5 million, representing 32% of total revenue
Net income of $6.0 million and diluted EPS of $0.29 versus net income of $5.4 million and diluted EPS of $0.26
Management Commentary
“Our second quarter results reflected strong performance in both our software and services segments,” said Shawn O’Connor, Chief Executive Officer of Simulations Plus. “Total revenue increased 16%, driven by higher software revenues in our Clinical Pharmacology & Pharmacometrics (CPP) business unit and the Cheminformatics business unit, whose ADMET Predictor® platform continued to gain adoption and added another new Artificial Intelligence (AI) biotech customer in the second quarter. Services revenue growth was primarily driven by higher revenues in our Quantitative Systems Pharmacology (QSP) and Physiologically Based Pharmacokinetics (PBPK) business units.
“Since the beginning of calendar 2024, we have seen encouraging signs in biotech funding with notable strength from biotech companies that have candidates undergoing clinical trials. Regarding large pharmaceutical companies, funding continues to vary depending on their near-term direction and business outlook, but the overall market is healthier compared to a year ago. For the balance of 2024, we remain cautiously optimistic that demand for our comprehensive suite of modeling and simulation software products and services will continue to gain momentum as the funding environment improves.
“During the quarter, we also launched our corporate development initiative to intensify our focus on strategic investments and partnerships in early-state technology companies. While strategic acquisitions to complement organic growth remain a priority, we believe there are hidden gems among early-stage companies developing high-potential technologies. We believe that our ability to identify and evaluate commercial applications for emerging technologies will complement our own R&D efforts and position Simulations Plus at the forefront of innovation.
“Our strong performance in the first half of the year, combined with market improvement, puts us on track to achieve our guidance for fiscal 2024. We entered the third quarter with a healthy pipeline and a solid balance sheet, and we are confident that Simulations Plus is firmly positioned to advance its critical role in drug development workflow. Our unwavering focus remains on delivering disciplined growth and achieving long-term returns for our shareholders.”
Fiscal 2024 Guidance
Fiscal 2024 Guidance
Annual Increase
Revenue
$66M - $69M
10 - 15%
Software mix
55 - 60%
—
Services mix
40 - 45%
—
Diluted earnings per share
$0.66 - $0.68
35 - 39%
Quarterly Dividend
The Company’s Board of Directors declared a cash dividend of $0.06 per share of the Company’s common stock, payable on May 6, 2024, to shareholders of record as of April 29, 2024. The declaration of any future dividends will be determined by the Board of Directors each quarter and will depend on earnings, financial condition, capital requirements, and other factors.
Environmental, Social, and Governance
We focus our Environmental, Social, and Governance (ESG) efforts where we can have the most positive impact. To learn more about our latest initiatives and priorities, please visit our website to read our 2023 ESG update.
Webcast and Conference Call Details
Shawn O’Connor, chief executive officer, and Will Frederick, chief financial and operations officer, will host a conference call and webcast today at 5 p.m. Eastern Time to discuss the details of the Company’s performance for the quarter and certain forward-looking information. The call may be accessed by registering here or by calling 1-877-451-6152 (domestic) or 1-201-389-0879 (international) or by clicking on this Call me™ link to request a return call. The webcast will be available on our website under Conference Calls & Presentations. A replay of the webcast will be available on the website approximately one hour following the call.
Non-GAAP Definitions
Adjusted EBITDA
Adjusted EBITDA is defined as earnings (loss) before interest, taxes, depreciation and amortization, stock-based compensation, (gain) loss on currency exchange, any acquisition- or financial-transaction-related expenses, and any asset impairment charges. Currency exchange excluded represents the exchange rate fluctuations on the foreign currency denominated transactions. The impact of transactions in foreign currency represents the effect of converting revenue and expenses occurring in a currency other than the functional currency. The Company believes that the non-GAAP financial measures presented facilitate an understanding of operating performance and provide a meaningful comparison of its results between periods. The Company’s management uses non-GAAP financial measures to, among other things, evaluate its ongoing operations in relation to historical results, for internal planning and forecasting purposes and in the calculation of performance-based compensation. Adjusted EBITDA represents a measure that we believe is customarily used by investors and analysts to evaluate the financial performance of companies in addition to the GAAP measures that we present. Our management also believes that Adjusted EBITDA is useful in evaluating our core operating results. However, Adjusted EBITDA is not a measure of financial performance under accounting principles generally accepted in the United States of America and should not be considered an alternative to net income or operating income as an indicator of our operating performance or to net cash provided by operating activities as a measure of our liquidity. The Company’s Adjusted EBITDA measure may not provide information that is directly comparable to that provided by other companies in its industry, as other companies in its industry may calculate non-GAAP financial results differently, particularly related to nonrecurring, unusual items.
Adjusted Diluted EPS
Adjusted diluted EPS is calculated based on net income excluding the impact of any acquisition- or financial-transaction-related expenses, any asset impairment charges, and tax provisions / benefits related to the previous items. The Company excludes the above items because they are outside of the Company’s normal operations and/or, in certain cases, are difficult to forecast accurately for future periods.
The Company believes that the use of non-GAAP measures helps investors to gain a better understanding of the Company’s core operating results and future prospects, consistent with how management measures and forecasts the Company’s performance, especially when comparing such results to previous periods or forecasts.
About Simulations Plus
Serving clients worldwide for more than 25 years, Simulations Plus is a leading provider in the biosimulation market providing software and consulting services supporting drug discovery, development, research, and regulatory submissions. We offer solutions that bridge artificial intelligence (AI)/machine learning, physiologically based pharmacokinetics, quantitative systems pharmacology/toxicology, and population PK/PD modeling approaches. Our technology is licensed and applied by major pharmaceutical, biotechnology, and regulatory agencies worldwide. For more information, visit our website at . Follow us on LinkedIn | X | YouTube.
Forward-Looking Statements
Except for historical information, the matters discussed in this press release are forward-looking statements that involve risks and uncertainties. Words like “believe,” “expect,” and “anticipate” mean that these are our best estimates as of this writing, but there can be no assurances that expected or anticipated results or events will actually take place, so our actual future results could differ significantly from those statements. Factors that could cause or contribute to such differences include, but are not limited to: our ability to successfully integrate the Immunetrics business with our own, as well as expenses we may incur in connection therewith, our ability to maintain our competitive advantages, acceptance of new software and improved versions of our existing software by our customers, the general economics of the pharmaceutical industry, our ability to finance growth, our ability to continue to attract and retain highly qualified technical staff, market conditions, macroeconomic factors, and a sustainable market. Further information on our risk factors is contained in our quarterly and annual reports and filed with the U.S. Securities and Exchange Commission.
SIMULATIONS PLUS, INC.
CONDENSED CONSOLIDATED STATEMENTS OF OPERATIONS AND COMPREHENSIVE INCOME
(Unaudited)
Three Months Ended
Six Months Ended
(in thousands, except per common share amounts)
February 29,
2024
February 28,
2023
February 29,
2024
February 28,
2023
Revenues
Software
$
11,614
$
10,487
$
19,203
$
16,561
Services
6,691
5,263
13,602
11,153
Total revenues
18,305
15,750
32,805
27,714
Cost of revenues
Software
1,348
843
2,339
1,728
Services
3,736
1,777
7,397
3,563
Total cost of revenues
5,084
2,620
9,736
5,291
Gross profit
13,221
13,130
23,069
22,423
Operating expenses
Research and development
1,312
1,317
2,529
2,483
Sales and marketing
1,949
1,730
3,938
3,215
General and administrative
5,518
6,049
11,200
11,813
Total operating expenses
8,779
9,096
17,667
17,511
Income from operations
4,442
4,034
5,402
4,912
Other income
810
1,034
2,256
1,774
Income before income taxes
5,252
5,068
7,658
6,686
Provision for income taxes
(1,223
)
(894
)
(1,684
)
(1,267
)
Net income
$
4,029
$
4,174
$
5,974
$
5,419
Earnings per share
Basic
$
0.20
$
0.21
$
0.30
$
0.27
Diluted
$
0.20
$
0.20
$
0.29
$
0.26
Weighted-average common shares outstanding
Basic
19,975
20,112
19,961
20,200
Diluted
20,315
20,529
20,288
20,657
Other comprehensive (loss) income, net of tax
Foreign currency translation adjustments
(15
)
(23
)
(69
)
30
Comprehensive income
$
4,014
$
4,151
$
5,905
$
5,449
SIMULATIONS PLUS, INC.
CONDENSED CONSOLIDATED BALANCE SHEETS
(Unaudited)
(Audited)
(in thousands, except share and per share amounts)
February 29,
2024
August 31,
2023
ASSETS
Current assets
Cash and cash equivalents
$
37,031
$
57,523
Accounts receivable, net of allowance for credit losses of $30 and $46
13,114
10,201
Prepaid income taxes
1,364
804
Prepaid expenses and other current assets
4,975
3,904
Short-term investments
71,473
57,940
Total current assets
127,957
130,372
Long-term assets
Capitalized computer software development costs, net of accumulated amortization of $17,962 and $17,199
12,333
11,335
Property and equipment, net
843
671
Operating lease right-of-use assets
1,062
1,247
Intellectual property, net of accumulated amortization of $10,117 and $9,301
7,873
8,689
Other intangible assets, net of accumulated amortization of $2,606 and $2,107
12,935
12,825
Goodwill
19,099
19,099
Long-term investments
9,024
—
Deferred tax assets
2,323
1,438
Other assets
524
425
Total assets
$
193,973
$
186,101
LIABILITIES AND SHAREHOLDERS' EQUITY
Current liabilities
Accounts payable
$
360
$
144
Accrued compensation
3,184
4,392
Accrued expenses
2,992
659
Contracts payable
5,110
3,250
Operating lease liability - current portion
425
442
Deferred revenue
2,457
3,100
Total current liabilities
14,528
11,987
Long-term liabilities
Operating lease liability
607
755
Contracts payable – net of current portion
1,800
3,330
Total liabilities
16,935
16,072
Commitments and contingencies
—
—
Shareholders' equity
Preferred stock, $0.001 par value - 10,000,000 shares authorized; no shares issued and outstanding
$
—
$
—
Common stock, $0.001 par value and additional paid-in capital —50,000,000 shares authorized; 19,983,703 and 19,937,961 shares issued and outstanding
148,472
144,974
Retained earnings
28,776
25,196
Accumulated other comprehensive loss
(210
)
(141
)
Total shareholders' equity
177,038
170,029
Total liabilities and shareholders' equity
$
193,973
$
186,101
SIMULATIONS PLUS, INC.
Trended Financial Information*
(Unaudited)
(in millions except earnings per share amounts)
FY 2022
FY 2023
FY 2024
FY
2022
FY
2023
FY
2024
Q1
Q2
Q3
Q4
Q1
Q2
Q3
Q4
Q1
Q2
Full
Year
Full
Year
YTD
Revenue
Software
$
7.4
$
9.8
$
9.6
$
5.9
$
6.1
$
10.5
$
10.6
$
9.3
$
7.6
$
11.6
$
32.7
$
36.5
$
19.2
Services
5.0
5.0
5.3
5.8
5.9
5.3
5.6
6.3
6.9
6.7
21.2
23.1
13.6
Total
$
12.4
$
14.8
$
15.0
$
11.7
$
12.0
$
15.8
$
16.2
$
15.6
$
14.5
$
18.3
$
53.9
$
59.6
$
32.8
Gross Margin
Software
90.0
%
92.0
%
92.4
%
86.1
%
85.4
%
92.0
%
91.5
%
89.4
%
86.9
%
88.4
%
90.6
%
90.1
%
87.8
%
Services
60.0
%
59.3
%
65.6
%
68.2
%
69.7
%
66.2
%
63.4
%
62.1
%
47.0
%
44.2
%
63.5
%
65.3
%
45.6
%
Total
77.8
%
80.9
%
82.9
%
77.2
%
77.7
%
83.4
%
81.8
%
78.4
%
67.9
%
72.2
%
79.9
%
80.5
%
70.3
%
Income from operations
$
3.8
$
5.5
$
4.9
$
0.7
$
0.9
$
4.0
$
4.1
$
(0.3
)
$
1.0
$
4.4
$
14.9
$
8.7
$
5.4
Operating Margin
30.6
%
37.0
%
33.1
%
5.9
%
7.3
%
25.6
%
25.2
%
-1.8
%
6.6
%
24.3
%
27.7
%
14.6
%
16.5
%
Net Income
$
3.0
$
4.4
$
4.1
$
1.0
$
1.2
$
4.2
$
4.0
$
0.5
$
1.9
$
4.0
$
12.5
$
10.0
$
6.0
Diluted Earnings Per Share
$
0.15
$
0.21
$
0.20
$
0.05
$
0.06
$
0.20
$
0.20
$
0.03
$
0.10
$
0.20
$
0.60
$
0.49
$
0.29
Adjusted EBITDA
$
5.3
$
7.2
$
6.5
$
2.5
$
3.0
$
6.2
$
6.5
$
4.9
$
3.4
$
7.1
$
21.5
$
20.6
$
10.5
Adjusted Diluted EPS
$
0.15
$
0.21
$
0.20
$
0.06
$
0.07
$
0.21
$
0.21
$
0.18
$
0.10
$
0.20
$
0.61
$
0.67
$
0.10
Cash Flow from Operations
$
3.6
$
2.6
$
3.8
$
7.9
$
4.7
$
5.5
$
8.5
$
3.1
$
0.2
$
5.8
$
17.9
$
21.9
$
6.0
Revenue Breakdown by Region
Americas
$
8.5
$
9.7
$
11.2
$
8.4
$
8.5
$
10.6
$
10.8
$
11.0
$
10.9
$
12.5
$
37.7
$
40.8
$
23.4
EMEA
3.0
3.7
1.9
1.7
2.1
3.6
3.4
2.6
2.3
4.7
10.4
11.7
7.0
Asia Pacific
0.9
1.4
1.9
1.6
1.3
1.5
2.1
2.1
1.3
1.2
5.8
7.0
2.5
Total
$
12.4
$
14.8
$
15.0
$
11.7
$
12.0
$
15.8
$
16.2
$
15.6
$
14.5
$
18.3
$
53.9
$
59.6
$
32.8
Software Performance Metrics
Average Revenue per Customer (in thousands)
Commercial
$
71
$
101
$
95
$
65
$
68
$
110
$
97
$
88
$
79
$
113
Services Performance Metrics
Backlog (in millions)
$
15.4
$
17.0
$
16.7
$
15.9
$
15.8
$
15.4
$
15.7
$
19.5
$
18.9
$
18.0
*Numbers may not add due to rounding
SIMULATIONS PLUS, INC.
Reconciliation of Adjusted EBITDA to Net Income*
(Unaudited)
(in millions)
FY 2022
FY 2023
FY 2024
FY
2022
FY
2023
FY
2024
Q1
Q2
Q3
Q4
Q1
Q2
Q3
Q4
Q1
Q2
Full
Year
Full
Year
YTD
Net Income
$
3.0
$
4.4
$
4.1
$
1.0
$
1.2
$
4.2
$
4.0
$
0.5
$
1.9
$
4.0
$
12.5
$
10.0
$
6.0
Excluding:
Interest income and expense, net
(0.1
)
(0.1
)
(0.1
)
(0.4
)
(0.8
)
(1.0
)
(1.1
)
(1.3
)
(1.3
)
(1.3
)
(0.7
)
(4.1
)
(2.6
)
Provision for income taxes
0.8
1.1
0.7
(0.1
)
0.4
0.9
0.9
(0.5
)
0.5
1.2
2.6
1.7
1.7
Depreciation and amortization
0.8
1.0
0.9
0.9
0.9
0.9
0.9
1.1
1.1
1.1
3.6
3.9
2.2
Stock-based compensation
0.6
0.7
0.7
0.7
0.9
1.2
1.1
1.1
1.3
1.6
2.7
4.2
2.9
(Gain) loss on currency exchange
(0.1
)
(0.1
)
0.2
0.2
—
—
0.3
0.2
—
0.1
0.2
0.5
0.1
Impairment of other intangibles
—
—
—
—
—
—
—
0.5
—
—
—
0.5
—
Change in value of contingent consideration
0.1
0.1
—
—
—
—
—
0.7
(0.1
)
0.4
0.3
0.7
0.3
Mergers & Acquisitions expense
—
—
—
0.3
0.3
0.1
0.4
2.5
—
—
0.3
3.3
—
Adjusted EBITDA
$
5.3
$
7.2
$
6.5
$
2.5
$
3.0
$
6.2
$
6.5
$
4.9
$
3.4
$
7.1
$
21.5
$
20.6
$
10.5
*Numbers may not add due to rounding
SIMULATIONS PLUS, INC.
Reconciliation of Adjusted Diluted EPS to Diluted EPS*
(Unaudited)
(in millions, except Diluted EPS and Adjusted Diluted EPS)
FY 2022
FY 2023
FY 2024
FY
2022
FY
2023
FY
2024
Q1
Q2
Q3
Q4
Q1
Q2
Q3
Q4
Q1
Q2
Full
Year
Full
Year
YTD
Net Income (GAAP)
$
3.0
$
4.4
$
4.1
$
1.0
$
1.2
$
4.2
$
4.0
$
0.5
$
1.9
$
4.0
$
12.5
$
10.0
$
6.0
Excluding:
Mergers & Acquisitions expense
—
—
—
0.3
0.3
0.1
0.4
0.9
—
—
0.3
1.7
—
Immunetrics transaction costs
—
—
—
—
—
—
—
2.3
—
—
—
2.3
—
Cognigen trade name write-off
—
—
—
—
—
—
—
0.5
—
—
—
0.5
—
Tax effect on above adjustments
—
—
—
(0.1
)
(0.1
)
—
(0.1
)
(0.5
)
—
—
(0.1
)
(0.7
)
—
Adjusted Net income (Non-GAAP)
$
3.0
$
4.4
$
4.1
$
1.2
$
1.5
$
4.2
$
4.3
$
3.7
$
1.9
$
4.0
$
12.8
$
13.8
$
6.0
Weighted-average common shares outstanding:
Diluted
20.7
20.7
20.8
20.9
20.8
20.5
20.4
20.4
20.3
20.3
20.7
20.5
20.3
Diluted EPS (GAAP)
$
0.15
$
0.21
$
0.20
$
0.05
$
0.06
$
0.20
$
0.20
$
0.03
$
0.10
$
0.20
$
0.60
$
0.49
$
0.29
Adjusted Diluted EPS (Non-GAAP)
$
0.15
$
0.21
$
0.20
$
0.06
$
0.07
$
0.21
$
0.21
$
0.18
$
0.10
$
0.20
$
0.61
$
0.67
$
0.29
*Numbers may not add due to rounding
财报并购
100 项与 Cognigen Corp. 相关的药物交易
登录后查看更多信息
100 项与 Cognigen Corp. 相关的转化医学
登录后查看更多信息
组织架构
使用我们的机构树数据加速您的研究。
登录
或
管线布局
2026年02月08日管线快照
无数据报导
登录后保持更新
药物交易
使用我们的药物交易数据加速您的研究。
登录
或

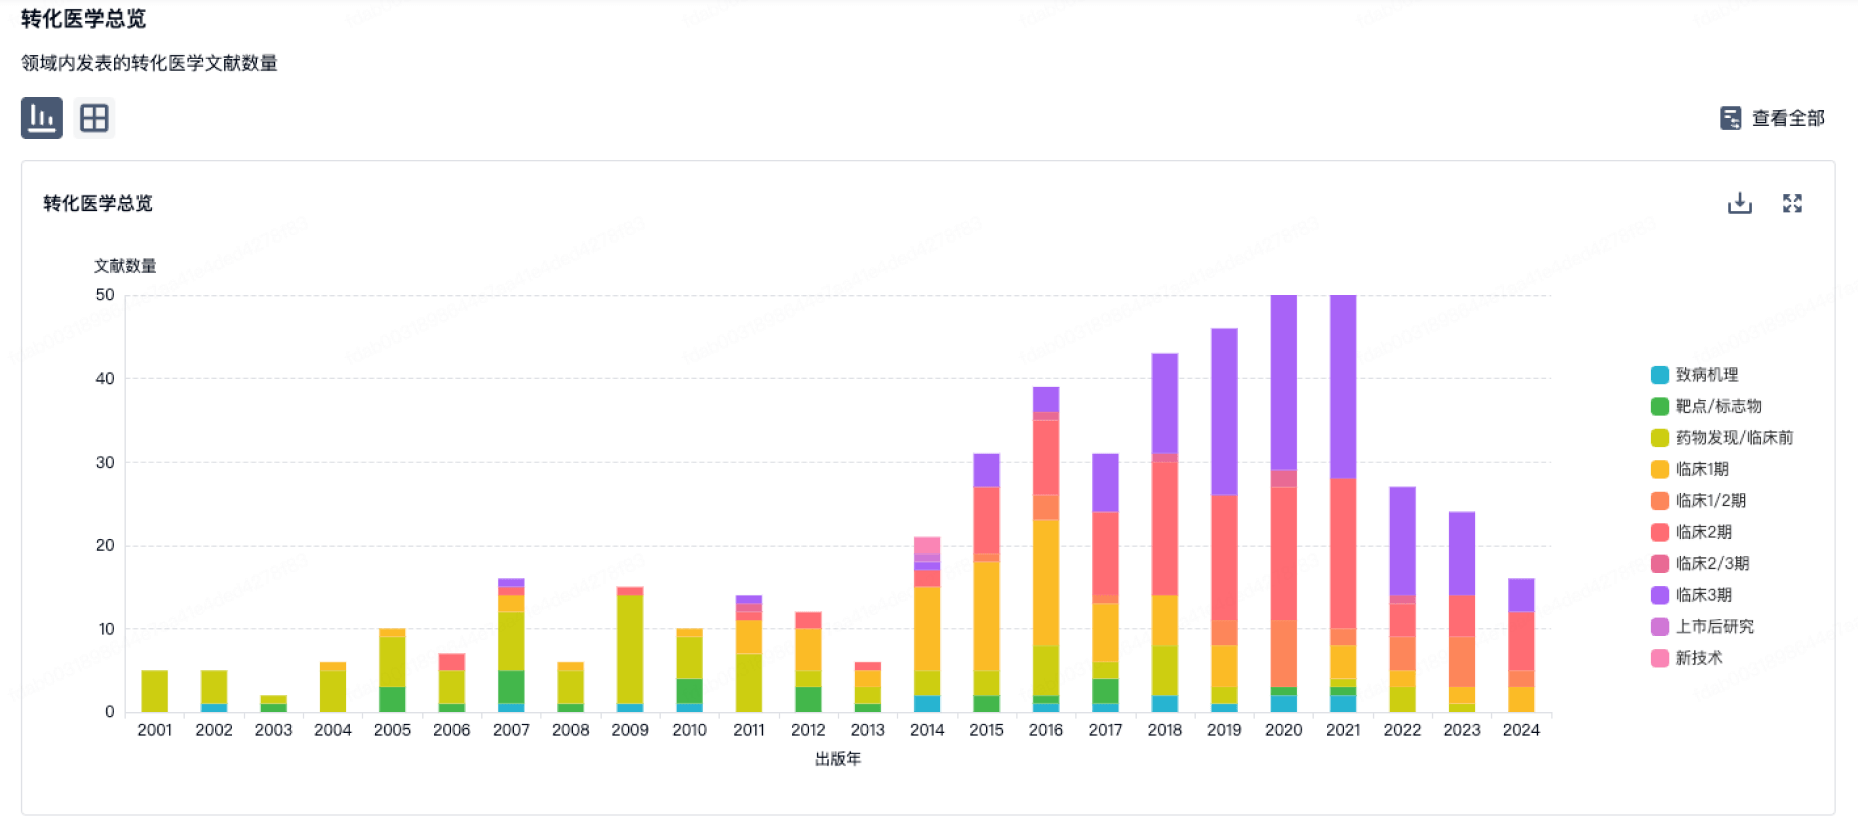
转化医学
使用我们的转化医学数据加速您的研究。
登录
或
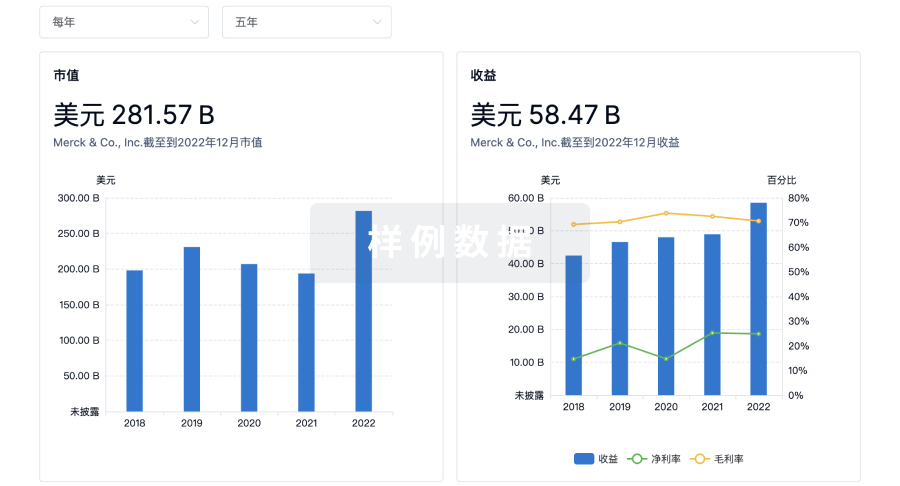
营收
使用 Synapse 探索超过 36 万个组织的财务状况。
登录
或
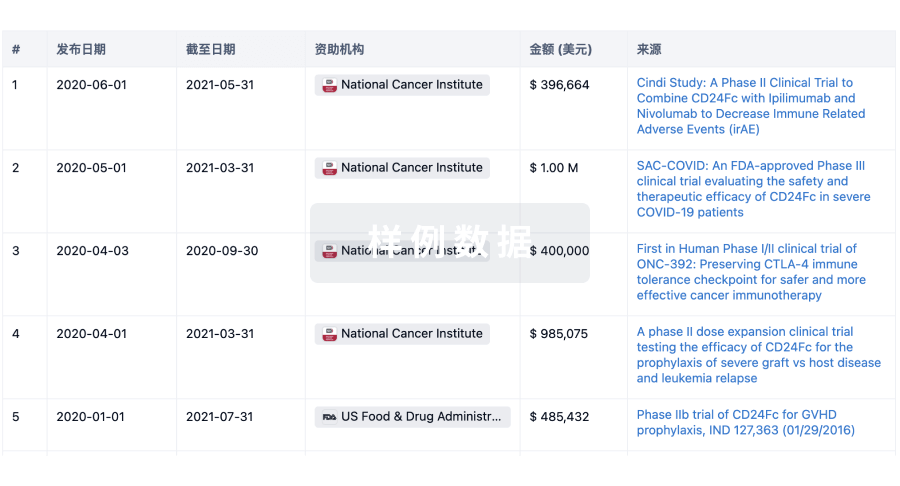
科研基金(NIH)
访问超过 200 万项资助和基金信息,以提升您的研究之旅。
登录
或
投资
深入了解从初创企业到成熟企业的最新公司投资动态。
登录
或
融资
发掘融资趋势以验证和推进您的投资机会。
登录
或
生物医药百科问答
全新生物医药AI Agent 覆盖科研全链路,让突破性发现快人一步
立即开始免费试用!
智慧芽新药情报库是智慧芽专为生命科学人士构建的基于AI的创新药情报平台,助您全方位提升您的研发与决策效率。
立即开始数据试用!
智慧芽新药库数据也通过智慧芽数据服务平台,以API或者数据包形式对外开放,助您更加充分利用智慧芽新药情报信息。
生物序列数据库
生物药研发创新
免费使用
化学结构数据库
小分子化药研发创新
免费使用