更新于:2023-05-03
Wenzhou Yihua Connector Co., Ltd.
更新于:2023-05-03
概览
关联
100 项与 温州意华接插件股份有限公司 相关的临床结果
登录后查看更多信息
0 项与 温州意华接插件股份有限公司 相关的专利(医药)
登录后查看更多信息
3
项与 温州意华接插件股份有限公司 相关的新闻(医药)2022-11-17
DUBLIN--(
BUSINESS WIRE
)--The
"Breast Pumps: Global Markets"
report has been added to
ResearchAndMarkets.com's
offering.
This report aims to provide a comprehensive study of the global market for breast pumps. It describes the different types of breast pumps used for feeding newborns and their current and historical market revenues.
Growth in this market is by the rising number of newborns, increasing number of working women contributes to the growth of breast pumps because breast pumps offer a convenient option for working women to continue breastfeeding their babies while still at work, increasing healthcare expenditure, growing technological advancements in medical devices, government initiatives to support working mothers and breastfeeding difficulties such as engorgement, breast refusal, nipple soreness, and poor attachment, etc.
In 2020, the breast pumps market was significantly impacted and recovered by the COVID-19 pandemic, which led to the halt of breast pumps in hospitals, medical stores, and clinics. With the lockdown, the manufacturing units coming to a halt, the supply for a wide range of devices such as nipple care products, breast pumps, breast milk storage bags, breast milk containers, nipple shields, and breast shells has dropped significantly.
Also, the COVID-19 pandemic has undeniably introduced even more panic and fear into the previously anxiety-provoking situation of breastfeeding accessories.
In this report, the breast pump market is segmented by product type, technology type, application, and region. Based on product type, the market is segmented into a closed system and an open system. Based on technology type, the market is segmented into manual breast pumps, battery-powered breast pumps, and electric breast pumps.
For a more in-depth understanding of the market, the report includes profiles of major players and their market shares in the breast pumps market.
Report Includes
Analyses of the global market trends, with historic market revenue (sales data) for 2019 to 2021, estimates for 2022, and projections of compound annual growth rates (CAGRs) through 2027
Estimation of the actual market size for breast pumps in USD million values, market forecast and corresponding market share analysis by product (device) type, technology, application, and region
In-depth information (facts and figures) concerning market drivers, restraints and other forces affecting the progress of this market
Identification of market trends, future perspectives, and factors influencing the demand for breast pumps market in the coming years (2022-2027)
Highlights of the COVID-19 impact on the medical devices industry, with pandemic implications on supply chain of medical devices, pricing factor, and regulatory scenario
Insight into the market regulations for medical devices (breast pumps) in North America, Europe, Asia Pacific, Latin America, and the Middle East and Africa
Identification of the major stakeholders and analysis of the competitive landscape based on recent developments and segmental revenues
Company profiles of major players within the industry, including Medela AG, Pigeon Corp., Spectra Baby USA, Koninklijke Philips N.V. and Ameda Inc.
Key Topics Covered:
Chapter 1 Introduction
1.1 Study Goals and Objectives
1.2 Reasons for Doing this Study
1.3 Scope of Report
1.4 Information Source
1.5 Methodology
1.6 Geographic Breakdown
1.7 Analysts' Credentials
1.8 Custom Research
1.9 Related Research Reports
Chapter 2 Summary and Highlights
2.1 Introduction
Chapter 3 Market Definitions and Technology Background
3.1 Overview
3.1.1 History of Breast Pumps
3.1.2 Reasons for Using Breast Pumps
3.2 Breast Pump Parts
3.2.1 Breast Shield (Flange)
3.2.2 Backflow Protectors
3.2.3 Valves
3.2.4 Connector
3.2.5 Milk Storage Bottle
3.2.6 Human Milk Storage Guidelines
3.3 Technology Types of Breast Pumps
3.3.1 Manual Breast Pumps
3.3.2 Battery-Powered Breast Pumps
3.3.3 Electric Breast Pumps
3.4 Product Types of Breast Pumps
3.4.1 Open System
3.4.2 Closed System
3.5 Application Types of Breast Pumps
3.5.1 Personal Use
3.5.2 Hospital Grade
Chapter 4 Market Dynamics
4.1 Market Drivers
4.1.1 Increasing Healthcare Expenditure
4.1.2 Increasing Number of Working Women
4.1.3 Government Initiatives to Support Working Mothers
4.1.4 Rising Number of Newborns
4.1.5 Growing Technological Advancements
4.1.6 Breastfeeding Difficulties
4.2 Market Restraints
4.2.1 High Cost of Breast Pumps
4.2.2 Damage to Breast Tissues
4.3 Market Opportunities
4.3.1 Increasing Number of Milk Banks
4.3.2 Market Expansion into Emerging Countries
Chapter 5 Market Breakdown by Product
5.1 Introduction
5.2 Open System
5.3 Closed System
Chapter 6 Market Breakdown by Technology
6.1 Introduction
6.2 Manual Breast Pumps
6.3 Battery-Powered Breast Pumps
6.4 Electric Breast Pumps
Chapter 7 Market Breakdown by Application
7.1 Introduction
7.2 Personal Use
7.3 Hospital Grade
Chapter 8 Market Breakdown by Region
8.1 Market Overview and Discussion
8.1.1 North America
8.1.2 Europe
8.1.3 Asia-Pacific
8.1.4 Rest of the World (Row)
Chapter 9 Covid-19 Impact
9.1 Introduction
9.2 Impact of Covid-19 on the Medical Device Industry
9.2.1 Decline/Delay in Elective Procedures
9.2.2 Impact of Covid-19 on the Supply Chain
9.2.3 Impact of Covid-19 on the U.S. Supply Chain
9.2.4 Impact of Covid-19 on the European Supply Chain
9.2.5 Impact of Covid-19 on the APAC Supply Chain
9.2.6 Impact of Covid-19 in China
9.3 Impact of Covid-19 on Medical Device Product Segments
9.3.1 Impact of Covid-19 on Breastfeeding
9.3.2 Impact of Covid-19 on Breast Pumps Market
Chapter 10 Regulatory Scenario
10.1 Regulations in North America
10.1.1 United States
10.1.2 Canada
10.2 Regulations in Europe
10.3 Regulations in the Asia-Pacific
10.3.1 Japan
10.3.2 China
10.3.3 India
10.4 Regulations in Row (Latin America, Middle East, and Africa)
10.4.1 Brazil
10.4.2 Mexico
10.4.3 Israel
10.4.4 Saudi Arabia
10.4.5 South Africa
Chapter 11 Competitive Landscape
11.1 Industry Scenario
11.2 Company Shares
11.3 Recent News
Chapter 12 Company Profiles
Albert Manufacturing USA
Ameda Inc.
Ardo Medical Ag.
Babybuddha Products
Bailey Medical Engineering
Bella Baby
Bremed Limited
Chiaro Technology Limited (Elvie)
Chicco
Evenflo Feeding Inc.
Freemie
Haakaa
Koninklijke Philips N.V.
Linco Baby Merchandise Works Co. Ltd.
Mamivac
Mayborn Usa Inc. (Tommeetippee)
Medela AG
Microlife Corp.
Motif Medical
Newell Brands (Nuk)
Pigeon Corp.
Spectra Baby USA
Willow Innovations Inc.
For more information about this report visit
https://www.researchandmarkets.com/r/7gq7sl
2022-10-16
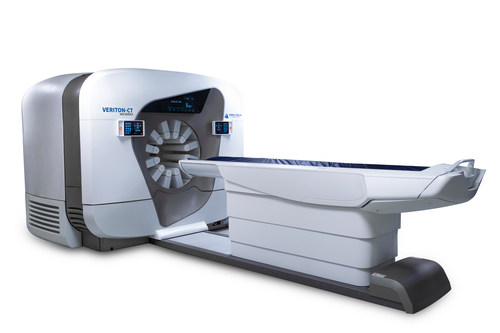
Based on Spectrum Dynamics digital SPECT/CT platform, VERITON-CT 400 Series' detector technology provides the benefits of increased sensitivity and throughput for Nuclear Medicine clinical applications using up to 400keV high-energy isotopes.
SARASOTA, Fla, Oct. 16, 2022 /PRNewswire/ -- Spectrum Dynamics Medical, a global leader in digital Nuclear Medicine SPECT and SPECT/CT scanners, and Kromek Group plc, a leading developer of high-performance detectors based on cadmium zinc telluride (CZT), today announced the integration of Kromek CZT detectors in Spectrum digital SPECT/CT products, the VERITON-CT 400 series.
CZT is transforming the detector technology used in medical imaging leading to shorter scan times, lower radiation dose to the patient, and improved image quality and quantitative accuracy.
Continue Reading
VERITON-CT 400 Series, the World's first digital SPECT/CT capable of high-energy imaging in Nuclear Medicine
Tweet this
VERITON-CT 400 Series Digital SPECT/CT Scanner
Kromek's high-performance digital detectors, combined with Spectrum's 360-degree, wide-bore SPECT/CT scanner and its advanced image reconstruction algorithms, increase the energy range up to 400 keV to support the throughput demand of current and new emerging nuclear medicine clinical applications.
The 400 Series digital detector technology sets new standards with a 2-4 times improvement in energy range, system sensitivity, and energy resolution. These improvements will significantly shorten the scan times associated with current analog or state-of-the-art digital technology.
"Clinical users across the world provide us with feedback on the Nuclear Medicine challenges they face," said Spectrum Dynamics' CEO, Gilad Yoeli. "Providing the technology to address such challenges is what drives us.
The increased sensitivity, improved energy resolution, and broader energy range of Kromek's detector technology make it the right choice for the 400 Series and the advanced imaging and quantitative accuracy clinical users ask for."
"We are delighted that our CZT detectors have been integrated into Spectrum Dynamics' VERITON-CT 400 SPECT/CT systems. This enables enhanced image quality and breakthrough clinical capabilities in digital SPECT/CT," said Arnab Basu, CEO of Kromek Group plc. "Spectrum Dynamics has long been at the forefront of developing next-generation SPECT/CT scanners to deliver better patient outcomes, and we are pleased to be part of this significant advance in nuclear medical imaging technology."
For additional information:
Contact for information at Spectrum Dynamics Medical: Nilda Rivera [email protected] +1 941-441-6224
Contact for information at Kromek Group plc: Steph Addison [email protected] +44 1740 62 6091
About Spectrum Dynamics Medical
Spectrum Dynamics Medical Group Limited and its subsidiaries ("Spectrum Dynamics") are engaged in developing, manufacturing, selling, and servicing state-of-the-art nuclear medicine imaging systems. Spectrum Dynamics is spearheading the transformation of SPECT imaging systems from analog to digital detection technology, enabling hospitals and clinicians to provide superior healthcare services with improved image quality, efficiency, and access to advanced clinical applications. Spectrum Dynamics launched the world's first digital cardiac dedicated SPECT system – the D-SPECT® CARDIO – in 2007. Since then, the D-SPECT has become the system of choice for functional cardiac imaging, with hundreds of systems sold worldwide. In 2018, Spectrum Dynamics launched its multipurpose VERITON® and the VERITON-CT® SPECT/CT, the first ring-based 360 CZT digital SPECT/CT scanner.
About Kromek Group plc
Kromek Group plc is a leading developer of radiation detection and bio-detection technology solutions for the advanced imaging and CBRN detection segments. Headquartered in County Durham, UK, Kromek has manufacturing operations in the UK and US, delivering on the vision of enhancing the quality of life through innovative detection technology solutions. The advanced imaging segment comprises the medical (including CT and SPECT), security and industrial markets. Kromek provides its OEM customers with detector components, based on its core cadmium zinc telluride (CZT) platform, to enable better detection of diseases such as cancer and Alzheimer's, contamination in industrial manufacture and explosives in aviation settings. In CBRN detection, the Group provides nuclear radiation detection solutions to the global homeland defence and security market. Kromek's compact, handheld, high-performance radiation detectors, based on advanced scintillation technology, are primarily used to protect critical infrastructure and urban environments from the threat of 'dirty bombs'. The Group is also developing bio-security solutions in the CBRN detection segment. These consist of fully automated and autonomous systems to detect a wide range of airborne pathogens. Kromek is listed on AIM, a market of the London Stock Exchange, under the trading symbol 'KMK'. Further information is available at
SOURCE Spectrum Dynamics Medical, Inc
2021-06-23
New York, June 23, 2021 (GLOBE NEWSWIRE) -- Reportlinker.com announces the release of the report "Global Scintillators Industry" - Scintillation or luminescence refers to the phenomenon when certain materials re-emit the light absorbed when they are struck by an incoming particle and absorb its energy. In some cases, the relaxation from the excited state to the lower states takes time; ranging from few nanoseconds to a few hours. At this time, delayed fluorescence or phosphorescence takes place. The wavelength of the optical photon that was emitted affects the transition. Scintillators are widely used in the form of detectors in the areas of medical diagnosis, geographical exploration and high energy physics. Scintillators can be liquid, solid or gaseous as well as organic or inorganic (such as single crystal, ceramics and glass). - Amid the COVID-19 crisis, the global market for Scintillators estimated at US$413.5 Million in the year 2020, is projected to reach a revised size of US$536.8 Million by 2026, growing at a CAGR of 4.5% over the analysis period. Inorganic, one of the segments analyzed in the report, is projected to grow at a 4.7% CAGR to reach US$371.5 Million by the end of the analysis period. After a thorough analysis of the business implications of the pandemic and its induced economic crisis, growth in the Organic segment is readjusted to a revised 4.2% CAGR for the next 7-year period. This segment currently accounts for a 35.1% share of the global Scintillators market. The U.S. Market is Estimated at $128.7 Million in 2021, While China is Forecast to Reach $73.9 Million by 2026 - The Scintillators market in the U.S. is estimated at US$128.7 Million in the year 2021. The country currently accounts for a 30.26% share in the global market. China, the world second largest economy, is forecast to reach an estimated market size of US$73.9 Million in the year 2026 trailing a CAGR of 6.6% through the analysis period. Among the other noteworthy geographic markets are Japan and Canada, each forecast to grow at 3.1% and 3.8% respectively over the analysis period. Within Europe, Germany is forecast to grow at approximately 3.6% CAGR while Rest of European market (as defined in the study) will reach US$79.2 Million by the end of the analysis period. - Changing dynamics in sectors such as manufacturing, defense, homeland security, nuclear power stations and healthcare is transforming the scintillators market. Increased government funding for R&D initiatives to foster innovations in scintillators space is also favoring market growth. Increasing investments in radiation monitoring space, particularly by homeland security agencies and the huge potential in innovative medical disciplines such as radiology, medical imaging and nuclear medicine are offering substantial opportunities for scintillator use for radiation detection applications. Rising safety concerns related to radiation exposure, favorable regulatory landscape, and research initiatives are additionally providing opportunities in the scintillators market. The need for an alternative option for neutron detection is also an opportunity for the scintillators market. Research activities, government funding, supportive regulations, and safety concerns related to radiation exposure are expected to support market growth. In addition, investments in radiation monitoring in the applications such as homeland security, growing demand for advanced radiological medical activities have been adding to the market growth. Technological advancements, initiatives by the governments of various countries, development of cost-efficient technologically advanced products and growing funds for R&D activities in private organizations are the key factors driving use of scintillators in industries in both developed and developing countries. Select Competitors (Total 36 Featured)
Read the full report: CONTENTS I. METHODOLOGY II. EXECUTIVE SUMMARY 1. MARKET OVERVIEW Impact of COVID-19 Pandemic and Looming Global Recession 2020 Marked as a Year of Disruption & Transformation EXHIBIT 1: World Economic Growth Projections (Real GDP, Annual % Change) for 2019 to 2022 EXHIBIT 2: Global PMI Index Points for the Years 2018, 2019 & 2020 Pandemic Puts Pressure on Healthcare System Pandemic Puts Pressure on Healthcare System An Introduction to Scintillators Organic Scintillators Inorganic Scintillators Global Market Prospects & Outlook Inorganic Scintillators: The Leading Segment Developed Regions Lead, Developing Economies to Boost Long-term Growth Competition World Brands Recent Market Activity 2. FOCUS ON SELECT PLAYERS 3. MARKET TRENDS & DRIVERS Advancements in Medical Imaging and Nuclear Medicine: Potential for Scintillators Market Rising Incidence of Cancer & Need to Reduce Cancer-Related Mortality Drives Need for Scintillators EXHIBIT 3: Global Cancer Incidence: Number of New Cancer Cases in Million for the Years 2018, 2020, 2025, 2030, 2035 and 2040 EXHIBIT 4: Global Number of New Cancer Cases and Cancer-related Deaths by Cancer Site for 2018 EXHIBIT 5: Number of New Cancer Cases and Deaths (in Million) by Region for 2018 Scintillation Materials Play a Vital Role in Medical Imaging Modalities Increasing Adoption of Nuclear Medicine Imaging to Stir Up Demand for Scintillators EXHIBIT 6: Global Nuclear Imaging Equipment Market Size (US$ Billion) for the Years 2020, 2023 and 2026 Lead Halide Perovskites to Allow Highly Sensitive X-Ray Detectors for Mammography Uranium Adds Sparkle to the Scintillators Demand for Radiation Monitoring in Homeland Security Applications to Drive Need for Scintillators EXHIBIT 7: Number of Terrorist Incidents and Terrorism-related Deaths Worldwide: 2011-2018 Stilbene Enables Faster Neutron Detection SPRD Technologies to Improve Detection of Nuclear/Radiological Sources Dual Gamma-Neutron Detector Materials for Compact Detectors Industrial Applications Present Growth Potential for Scintillators Industrial X-Ray Inspection Systems Use Scintillators Use of Halide Lead Perovskites to Ionize Radiation Detection Gains Popularity Scintillators Find Significance in Nuclear Power Plants EXHIBIT 8: Largest Nuclear Power Plants Worldwide by Gross Capacity (MWs) EXHIBIT 9: Largest Nuclear Power Plants Worldwide by Gross Electricity Generation (Billion Kilowatt Hours) EXHIBIT 10: Operational and Under Construction Nuclear Power Reactors Worldwide by Country Emergence of Renewable Energy Sources as Replacement for Nuclear Energy to Impede Market Growth EXHIBIT 11: Global Energy Mix: 1990 Vs 2020 Vs 2030 EXHIBIT 12: Global Energy Production: Breakdown of Electricity (Billion Kilowatt Hours) and Percentage Share by Energy Source (2030 & 2040) Rising Prominence of Scintillators in Space Missions Plastic Scintillators Emerge as Promising Materials Researchers Develop New Plastic Scintillator Ongoing Technological Advancements Pave Way for Development of Advanced Scintillation Devices Advent of 2D HP -ray Scintillators Streamline Process of Detecting X-ray and ?-ray Radiations New Scintillator Materials and Research Projects to Spur Market Prospects Rare Earth Metals in the Spotlight CZT Shows Tremendous Promise in Nuclear Medicine Seeking Alternatives to Helium-3 New Tin-Loaded Organic Glass Scintillator Researchers Develop New Scintillation Material High Sensitivity Hybrid Direct, Broadband X-Ray Detector for Soft and Hard X-Rays Perovskite Nanocrystal-based Sensitized Plastic Scintillators High-Performance X-Ray Scintillators based on Organic Manganese Bromide GE Research Develops New Detectors for Homeland Security Applications Polimaster?s Radiation Monitoring Devices New Homeland Security Tool for Detection of Gamma Rays and Radioactive Isotopes UT Faculty?s Aid to Homeland Security to Detect Radioactive Materials Nanostructure-based Design Improves Scintillator Efficiency X-ray Imaging with Nontoxic Double Perovskite Scintillators Researchers Develop Flexible X-ray Scintillators 4. GLOBAL MARKET PERSPECTIVE Table 1: World Current & Future Analysis for Scintillators by Geographic Region - USA, Canada, Japan, China, Europe, Asia-Pacific, Latin America, Middle East and Africa Markets - Independent Analysis of Annual Sales in US$ Thousand for Years 2020 through 2027 and % CAGR Table 2: World Historic Review for Scintillators by Geographic Region - USA, Canada, Japan, China, Europe, Asia-Pacific, Latin America, Middle East and Africa Markets - Independent Analysis of Annual Sales in US$ Thousand for Years 2012 through 2019 and % CAGR Table 3: World 15-Year Perspective for Scintillators by Geographic Region - Percentage Breakdown of Value Sales for USA, Canada, Japan, China, Europe, Asia-Pacific, Latin America, Middle East and Africa Markets for Years 2012, 2020 & 2027 Table 4: World Current & Future Analysis for Inorganic by Geographic Region - USA, Canada, Japan, China, Europe, Asia-Pacific, Latin America, Middle East and Africa Markets - Independent Analysis of Annual Sales in US$ Thousand for Years 2020 through 2027 and % CAGR Table 5: World Historic Review for Inorganic by Geographic Region - USA, Canada, Japan, China, Europe, Asia-Pacific, Latin America, Middle East and Africa Markets - Independent Analysis of Annual Sales in US$ Thousand for Years 2012 through 2019 and % CAGR Table 6: World 15-Year Perspective for Inorganic by Geographic Region - Percentage Breakdown of Value Sales for USA, Canada, Japan, China, Europe, Asia-Pacific, Latin America, Middle East and Africa for Years 2012, 2020 & 2027 Table 7: World Current & Future Analysis for Organic by Geographic Region - USA, Canada, Japan, China, Europe, Asia-Pacific, Latin America, Middle East and Africa Markets - Independent Analysis of Annual Sales in US$ Thousand for Years 2020 through 2027 and % CAGR Table 8: World Historic Review for Organic by Geographic Region - USA, Canada, Japan, China, Europe, Asia-Pacific, Latin America, Middle East and Africa Markets - Independent Analysis of Annual Sales in US$ Thousand for Years 2012 through 2019 and % CAGR Table 9: World 15-Year Perspective for Organic by Geographic Region - Percentage Breakdown of Value Sales for USA, Canada, Japan, China, Europe, Asia-Pacific, Latin America, Middle East and Africa for Years 2012, 2020 & 2027 Table 10: World Current & Future Analysis for Healthcare by Geographic Region - USA, Canada, Japan, China, Europe, Asia-Pacific, Latin America, Middle East and Africa Markets - Independent Analysis of Annual Sales in US$ Thousand for Years 2020 through 2027 and % CAGR Table 11: World Historic Review for Healthcare by Geographic Region - USA, Canada, Japan, China, Europe, Asia-Pacific, Latin America, Middle East and Africa Markets - Independent Analysis of Annual Sales in US$ Thousand for Years 2012 through 2019 and % CAGR Table 12: World 15-Year Perspective for Healthcare by Geographic Region - Percentage Breakdown of Value Sales for USA, Canada, Japan, China, Europe, Asia-Pacific, Latin America, Middle East and Africa for Years 2012, 2020 & 2027 Table 13: World Current & Future Analysis for Homeland Security by Geographic Region - USA, Canada, Japan, China, Europe, Asia-Pacific, Latin America, Middle East and Africa Markets - Independent Analysis of Annual Sales in US$ Thousand for Years 2020 through 2027 and % CAGR Table 14: World Historic Review for Homeland Security by Geographic Region - USA, Canada, Japan, China, Europe, Asia-Pacific, Latin America, Middle East and Africa Markets - Independent Analysis of Annual Sales in US$ Thousand for Years 2012 through 2019 and % CAGR Table 15: World 15-Year Perspective for Homeland Security by Geographic Region - Percentage Breakdown of Value Sales for USA, Canada, Japan, China, Europe, Asia-Pacific, Latin America, Middle East and Africa for Years 2012, 2020 & 2027 Table 16: World Current & Future Analysis for Industrial by Geographic Region - USA, Canada, Japan, China, Europe, Asia-Pacific, Latin America, Middle East and Africa Markets - Independent Analysis of Annual Sales in US$ Thousand for Years 2020 through 2027 and % CAGR Table 17: World Historic Review for Industrial by Geographic Region - USA, Canada, Japan, China, Europe, Asia-Pacific, Latin America, Middle East and Africa Markets - Independent Analysis of Annual Sales in US$ Thousand for Years 2012 through 2019 and % CAGR Table 18: World 15-Year Perspective for Industrial by Geographic Region - Percentage Breakdown of Value Sales for USA, Canada, Japan, China, Europe, Asia-Pacific, Latin America, Middle East and Africa for Years 2012, 2020 & 2027 Table 19: World Current & Future Analysis for Other Applications by Geographic Region - USA, Canada, Japan, China, Europe, Asia-Pacific, Latin America, Middle East and Africa Markets - Independent Analysis of Annual Sales in US$ Thousand for Years 2020 through 2027 and % CAGR Table 20: World Historic Review for Other Applications by Geographic Region - USA, Canada, Japan, China, Europe, Asia-Pacific, Latin America, Middle East and Africa Markets - Independent Analysis of Annual Sales in US$ Thousand for Years 2012 through 2019 and % CAGR Table 21: World 15-Year Perspective for Other Applications by Geographic Region - Percentage Breakdown of Value Sales for USA, Canada, Japan, China, Europe, Asia-Pacific, Latin America, Middle East and Africa for Years 2012, 2020 & 2027 III. MARKET ANALYSIS UNITED STATES Table 22: USA Current & Future Analysis for Scintillators by Type - Inorganic and Organic - Independent Analysis of Annual Sales in US$ Thousand for the Years 2020 through 2027 and % CAGR Table 23: USA Historic Review for Scintillators by Type - Inorganic and Organic Markets - Independent Analysis of Annual Sales in US$ Thousand for Years 2012 through 2019 and % CAGR Table 24: USA 15-Year Perspective for Scintillators by Type - Percentage Breakdown of Value Sales for Inorganic and Organic for the Years 2012, 2020 & 2027 Table 25: USA Current & Future Analysis for Scintillators by Application - Healthcare, Homeland Security, Industrial and Other Applications - Independent Analysis of Annual Sales in US$ Thousand for the Years 2020 through 2027 and % CAGR Table 26: USA Historic Review for Scintillators by Application - Healthcare, Homeland Security, Industrial and Other Applications Markets - Independent Analysis of Annual Sales in US$ Thousand for Years 2012 through 2019 and % CAGR Table 27: USA 15-Year Perspective for Scintillators by Application - Percentage Breakdown of Value Sales for Healthcare, Homeland Security, Industrial and Other Applications for the Years 2012, 2020 & 2027 CANADA Table 28: Canada Current & Future Analysis for Scintillators by Type - Inorganic and Organic - Independent Analysis of Annual Sales in US$ Thousand for the Years 2020 through 2027 and % CAGR Table 29: Canada Historic Review for Scintillators by Type - Inorganic and Organic Markets - Independent Analysis of Annual Sales in US$ Thousand for Years 2012 through 2019 and % CAGR Table 30: Canada 15-Year Perspective for Scintillators by Type - Percentage Breakdown of Value Sales for Inorganic and Organic for the Years 2012, 2020 & 2027 Table 31: Canada Current & Future Analysis for Scintillators by Application - Healthcare, Homeland Security, Industrial and Other Applications - Independent Analysis of Annual Sales in US$ Thousand for the Years 2020 through 2027 and % CAGR Table 32: Canada Historic Review for Scintillators by Application - Healthcare, Homeland Security, Industrial and Other Applications Markets - Independent Analysis of Annual Sales in US$ Thousand for Years 2012 through 2019 and % CAGR Table 33: Canada 15-Year Perspective for Scintillators by Application - Percentage Breakdown of Value Sales for Healthcare, Homeland Security, Industrial and Other Applications for the Years 2012, 2020 & 2027 JAPAN Table 34: Japan Current & Future Analysis for Scintillators by Type - Inorganic and Organic - Independent Analysis of Annual Sales in US$ Thousand for the Years 2020 through 2027 and % CAGR Table 35: Japan Historic Review for Scintillators by Type - Inorganic and Organic Markets - Independent Analysis of Annual Sales in US$ Thousand for Years 2012 through 2019 and % CAGR Table 36: Japan 15-Year Perspective for Scintillators by Type - Percentage Breakdown of Value Sales for Inorganic and Organic for the Years 2012, 2020 & 2027 Table 37: Japan Current & Future Analysis for Scintillators by Application - Healthcare, Homeland Security, Industrial and Other Applications - Independent Analysis of Annual Sales in US$ Thousand for the Years 2020 through 2027 and % CAGR Table 38: Japan Historic Review for Scintillators by Application - Healthcare, Homeland Security, Industrial and Other Applications Markets - Independent Analysis of Annual Sales in US$ Thousand for Years 2012 through 2019 and % CAGR Table 39: Japan 15-Year Perspective for Scintillators by Application - Percentage Breakdown of Value Sales for Healthcare, Homeland Security, Industrial and Other Applications for the Years 2012, 2020 & 2027 CHINA Table 40: China Current & Future Analysis for Scintillators by Type - Inorganic and Organic - Independent Analysis of Annual Sales in US$ Thousand for the Years 2020 through 2027 and % CAGR Table 41: China Historic Review for Scintillators by Type - Inorganic and Organic Markets - Independent Analysis of Annual Sales in US$ Thousand for Years 2012 through 2019 and % CAGR Table 42: China 15-Year Perspective for Scintillators by Type - Percentage Breakdown of Value Sales for Inorganic and Organic for the Years 2012, 2020 & 2027 Table 43: China Current & Future Analysis for Scintillators by Application - Healthcare, Homeland Security, Industrial and Other Applications - Independent Analysis of Annual Sales in US$ Thousand for the Years 2020 through 2027 and % CAGR Table 44: China Historic Review for Scintillators by Application - Healthcare, Homeland Security, Industrial and Other Applications Markets - Independent Analysis of Annual Sales in US$ Thousand for Years 2012 through 2019 and % CAGR Table 45: China 15-Year Perspective for Scintillators by Application - Percentage Breakdown of Value Sales for Healthcare, Homeland Security, Industrial and Other Applications for the Years 2012, 2020 & 2027 EUROPE Table 46: Europe Current & Future Analysis for Scintillators by Geographic Region - France, Germany, Italy, UK, Spain, Russia and Rest of Europe Markets - Independent Analysis of Annual Sales in US$ Thousand for Years 2020 through 2027 and % CAGR Table 47: Europe Historic Review for Scintillators by Geographic Region - France, Germany, Italy, UK, Spain, Russia and Rest of Europe Markets - Independent Analysis of Annual Sales in US$ Thousand for Years 2012 through 2019 and % CAGR Table 48: Europe 15-Year Perspective for Scintillators by Geographic Region - Percentage Breakdown of Value Sales for France, Germany, Italy, UK, Spain, Russia and Rest of Europe Markets for Years 2012, 2020 & 2027 Markets for Years 2012, 2020 & 202 Table 50: Europe Historic Review for Scintillators by Type - Inorganic and Organic Markets - Independent Analysis of Annual Sales in US$ Thousand for Years 2012 through 2019 and % CAGR Table 51: Europe 15-Year Perspective for Scintillators by Type - Percentage Breakdown of Value Sales for Inorganic and Organic for the Years 2012, 2020 & 2027 Table 52: Europe Current & Future Analysis for Scintillators by Application - Healthcare, Homeland Security, Industrial and Other Applications - Independent Analysis of Annual Sales in US$ Thousand for the Years 2020 through 2027 and % CAGR Table 53: Europe Historic Review for Scintillators by Application - Healthcare, Homeland Security, Industrial and Other Applications Markets - Independent Analysis of Annual Sales in US$ Thousand for Years 2012 through 2019 and % CAGR Table 54: Europe 15-Year Perspective for Scintillators by Application - Percentage Breakdown of Value Sales for Healthcare, Homeland Security, Industrial and Other Applications for the Years 2012, 2020 & 2027 FRANCE Table 55: France Current & Future Analysis for Scintillators by Type - Inorganic and Organic - Independent Analysis of Annual Sales in US$ Thousand for the Years 2020 through 2027 and % CAGR Table 56: France Historic Review for Scintillators by Type - Inorganic and Organic Markets - Independent Analysis of Annual Sales in US$ Thousand for Years 2012 through 2019 and % CAGR Table 57: France 15-Year Perspective for Scintillators by Type - Percentage Breakdown of Value Sales for Inorganic and Organic for the Years 2012, 2020 & 2027 Table 58: France Current & Future Analysis for Scintillators by Application - Healthcare, Homeland Security, Industrial and Other Applications - Independent Analysis of Annual Sales in US$ Thousand for the Years 2020 through 2027 and % CAGR Table 59: France Historic Review for Scintillators by Application - Healthcare, Homeland Security, Industrial and Other Applications Markets - Independent Analysis of Annual Sales in US$ Thousand for Years 2012 through 2019 and % CAGR Table 60: France 15-Year Perspective for Scintillators by Application - Percentage Breakdown of Value Sales for Healthcare, Homeland Security, Industrial and Other Applications for the Years 2012, 2020 & 2027 GERMANY Table 61: Germany Current & Future Analysis for Scintillators by Type - Inorganic and Organic - Independent Analysis of Annual Sales in US$ Thousand for the Years 2020 through 2027 and % CAGR Table 62: Germany Historic Review for Scintillators by Type - Inorganic and Organic Markets - Independent Analysis of Annual Sales in US$ Thousand for Years 2012 through 2019 and % CAGR Table 63: Germany 15-Year Perspective for Scintillators by Type - Percentage Breakdown of Value Sales for Inorganic and Organic for the Years 2012, 2020 & 2027 Table 64: Germany Current & Future Analysis for Scintillators by Application - Healthcare, Homeland Security, Industrial and Other Applications - Independent Analysis of Annual Sales in US$ Thousand for the Years 2020 through 2027 and % CAGR Table 65: Germany Historic Review for Scintillators by Application - Healthcare, Homeland Security, Industrial and Other Applications Markets - Independent Analysis of Annual Sales in US$ Thousand for Years 2012 through 2019 and % CAGR Table 66: Germany 15-Year Perspective for Scintillators by Application - Percentage Breakdown of Value Sales for Healthcare, Homeland Security, Industrial and Other Applications for the Years 2012, 2020 & 2027 ITALY Table 67: Italy Current & Future Analysis for Scintillators by Type - Inorganic and Organic - Independent Analysis of Annual Sales in US$ Thousand for the Years 2020 through 2027 and % CAGR Table 68: Italy Historic Review for Scintillators by Type - Inorganic and Organic Markets - Independent Analysis of Annual Sales in US$ Thousand for Years 2012 through 2019 and % CAGR Table 69: Italy 15-Year Perspective for Scintillators by Type - Percentage Breakdown of Value Sales for Inorganic and Organic for the Years 2012, 2020 & 2027 Table 70: Italy Current & Future Analysis for Scintillators by Application - Healthcare, Homeland Security, Industrial and Other Applications - Independent Analysis of Annual Sales in US$ Thousand for the Years 2020 through 2027 and % CAGR Table 71: Italy Historic Review for Scintillators by Application - Healthcare, Homeland Security, Industrial and Other Applications Markets - Independent Analysis of Annual Sales in US$ Thousand for Years 2012 through 2019 and % CAGR Table 72: Italy 15-Year Perspective for Scintillators by Application - Percentage Breakdown of Value Sales for Healthcare, Homeland Security, Industrial and Other Applications for the Years 2012, 2020 & 2027 UNITED KINGDOM Table 73: UK Current & Future Analysis for Scintillators by Type - Inorganic and Organic - Independent Analysis of Annual Sales in US$ Thousand for the Years 2020 through 2027 and % CAGR Table 74: UK Historic Review for Scintillators by Type - Inorganic and Organic Markets - Independent Analysis of Annual Sales in US$ Thousand for Years 2012 through 2019 and % CAGR Table 75: UK 15-Year Perspective for Scintillators by Type - Percentage Breakdown of Value Sales for Inorganic and Organic for the Years 2012, 2020 & 2027 Table 76: UK Current & Future Analysis for Scintillators by Application - Healthcare, Homeland Security, Industrial and Other Applications - Independent Analysis of Annual Sales in US$ Thousand for the Years 2020 through 2027 and % CAGR Table 77: UK Historic Review for Scintillators by Application - Healthcare, Homeland Security, Industrial and Other Applications Markets - Independent Analysis of Annual Sales in US$ Thousand for Years 2012 through 2019 and % CAGR Table 78: UK 15-Year Perspective for Scintillators by Application - Percentage Breakdown of Value Sales for Healthcare, Homeland Security, Industrial and Other Applications for the Years 2012, 2020 & 2027 SPAIN Table 79: Spain Current & Future Analysis for Scintillators by Type - Inorganic and Organic - Independent Analysis of Annual Sales in US$ Thousand for the Years 2020 through 2027 and % CAGR Table 80: Spain Historic Review for Scintillators by Type - Inorganic and Organic Markets - Independent Analysis of Annual Sales in US$ Thousand for Years 2012 through 2019 and % CAGR Table 81: Spain 15-Year Perspective for Scintillators by Type - Percentage Breakdown of Value Sales for Inorganic and Organic for the Years 2012, 2020 & 2027 Table 82: Spain Current & Future Analysis for Scintillators by Application - Healthcare, Homeland Security, Industrial and Other Applications - Independent Analysis of Annual Sales in US$ Thousand for the Years 2020 through 2027 and % CAGR Table 83: Spain Historic Review for Scintillators by Application - Healthcare, Homeland Security, Industrial and Other Applications Markets - Independent Analysis of Annual Sales in US$ Thousand for Years 2012 through 2019 and % CAGR Table 84: Spain 15-Year Perspective for Scintillators by Application - Percentage Breakdown of Value Sales for Healthcare, Homeland Security, Industrial and Other Applications for the Years 2012, 2020 & 2027 RUSSIA Table 85: Russia Current & Future Analysis for Scintillators by Type - Inorganic and Organic - Independent Analysis of Annual Sales in US$ Thousand for the Years 2020 through 2027 and % CAGR Table 86: Russia Historic Review for Scintillators by Type - Inorganic and Organic Markets - Independent Analysis of Annual Sales in US$ Thousand for Years 2012 through 2019 and % CAGR Table 87: Russia 15-Year Perspective for Scintillators by Type - Percentage Breakdown of Value Sales for Inorganic and Organic for the Years 2012, 2020 & 2027 Table 88: Russia Current & Future Analysis for Scintillators by Application - Healthcare, Homeland Security, Industrial and Other Applications - Independent Analysis of Annual Sales in US$ Thousand for the Years 2020 through 2027 and % CAGR Table 89: Russia Historic Review for Scintillators by Application - Healthcare, Homeland Security, Industrial and Other Applications Markets - Independent Analysis of Annual Sales in US$ Thousand for Years 2012 through 2019 and % CAGR Table 90: Russia 15-Year Perspective for Scintillators by Application - Percentage Breakdown of Value Sales for Healthcare, Homeland Security, Industrial and Other Applications for the Years 2012, 2020 & 2027 REST OF EUROPE Table 91: Rest of Europe Current & Future Analysis for Scintillators by Type - Inorganic and Organic - Independent Analysis of Annual Sales in US$ Thousand for the Years 2020 through 2027 and % CAGR Table 92: Rest of Europe Historic Review for Scintillators by Type - Inorganic and Organic Markets - Independent Analysis of Annual Sales in US$ Thousand for Years 2012 through 2019 and % CAGR Table 93: Rest of Europe 15-Year Perspective for Scintillators by Type - Percentage Breakdown of Value Sales for Inorganic and Organic for the Years 2012, 2020 & 2027 Table 94: Rest of Europe Current & Future Analysis for Scintillators by Application - Healthcare, Homeland Security, Industrial and Other Applications - Independent Analysis of Annual Sales in US$ Thousand for the Years 2020 through 2027 and % CAGR Table 95: Rest of Europe Historic Review for Scintillators by Application - Healthcare, Homeland Security, Industrial and Other Applications Markets - Independent Analysis of Annual Sales in US$ Thousand for Years 2012 through 2019 and % CAGR Table 96: Rest of Europe 15-Year Perspective for Scintillators by Application - Percentage Breakdown of Value Sales for Healthcare, Homeland Security, Industrial and Other Applications for the Years 2012, 2020 & 2027 ASIA-PACIFIC Table 97: Asia-Pacific Current & Future Analysis for Scintillators by Geographic Region - Australia, India, South Korea and Rest of Asia-Pacific Markets - Independent Analysis of Annual Sales in US$ Thousand for Years 2020 through 2027 and % CAGR Table 98: Asia-Pacific Historic Review for Scintillators by Geographic Region - Australia, India, South Korea and Rest of Asia-Pacific Markets - Independent Analysis of Annual Sales in US$ Thousand for Years 2012 through 2019 and % CAGR Table 99: Asia-Pacific 15-Year Perspective for Scintillators by Geographic Region - Percentage Breakdown of Value Sales for Australia, India, South Korea and Rest of Asia-Pacific Markets for Years 2012, 2020 & 2027 Table 100: Asia-Pacific Current & Future Analysis for Scintillators by Type - Inorganic and Organic - Independent Analysis of Annual Sales in US$ Thousand for the Years 2020 through 2027 and % CAGR Table 101: Asia-Pacific Historic Review for Scintillators by Type - Inorganic and Organic Markets - Independent Analysis of Annual Sales in US$ Thousand for Years 2012 through 2019 and % CAGR Table 102: Asia-Pacific 15-Year Perspective for Scintillators by Type - Percentage Breakdown of Value Sales for Inorganic and Organic for the Years 2012, 2020 & 2027 Table 103: Asia-Pacific Current & Future Analysis for Scintillators by Application - Healthcare, Homeland Security, Industrial and Other Applications - Independent Analysis of Annual Sales in US$ Thousand for the Years 2020 through 2027 and % CAGR Table 104: Asia-Pacific Historic Review for Scintillators by Application - Healthcare, Homeland Security, Industrial and Other Applications Markets - Independent Analysis of Annual Sales in US$ Thousand for Years 2012 through 2019 and % CAGR Table 105: Asia-Pacific 15-Year Perspective for Scintillators by Application - Percentage Breakdown of Value Sales for Healthcare, Homeland Security, Industrial and Other Applications for the Years 2012, 2020 & 2027 AUSTRALIA Table 106: Australia Current & Future Analysis for Scintillators by Type - Inorganic and Organic - Independent Analysis of Annual Sales in US$ Thousand for the Years 2020 through 2027 and % CAGR Table 107: Australia Historic Review for Scintillators by Type - Inorganic and Organic Markets - Independent Analysis of Annual Sales in US$ Thousand for Years 2012 through 2019 and % CAGR Table 108: Australia 15-Year Perspective for Scintillators by Type - Percentage Breakdown of Value Sales for Inorganic and Organic for the Years 2012, 2020 & 2027 Table 109: Australia Current & Future Analysis for Scintillators by Application - Healthcare, Homeland Security, Industrial and Other Applications - Independent Analysis of Annual Sales in US$ Thousand for the Years 2020 through 2027 and % CAGR Table 110: Australia Historic Review for Scintillators by Application - Healthcare, Homeland Security, Industrial and Other Applications Markets - Independent Analysis of Annual Sales in US$ Thousand for Years 2012 through 2019 and % CAGR Table 111: Australia 15-Year Perspective for Scintillators by Application - Percentage Breakdown of Value Sales for Healthcare, Homeland Security, Industrial and Other Applications for the Years 2012, 2020 & 2027 INDIA Table 112: India CurrentRead the full report: ReportlinkerReportLinker is an award-winning market research solution. Reportlinker finds and organizes the latest industry data so you get all the market research you need - instantly, in one place.__________________________
100 项与 温州意华接插件股份有限公司 相关的药物交易
登录后查看更多信息
100 项与 温州意华接插件股份有限公司 相关的转化医学
登录后查看更多信息
组织架构
使用我们的机构树数据加速您的研究。
登录
或
管线布局
2024年06月06日管线快照
无数据报导
登录后保持更新
药物交易
使用我们的药物交易数据加速您的研究。
登录
或
转化医学
使用我们的转化医学数据加速您的研究。
登录
或
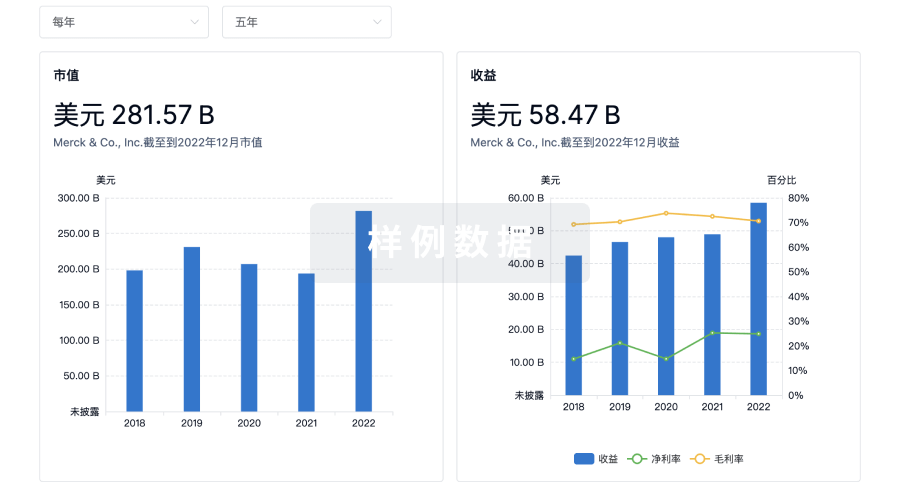
营收
使用 Synapse 探索超过 36 万个组织的财务状况。
登录
或
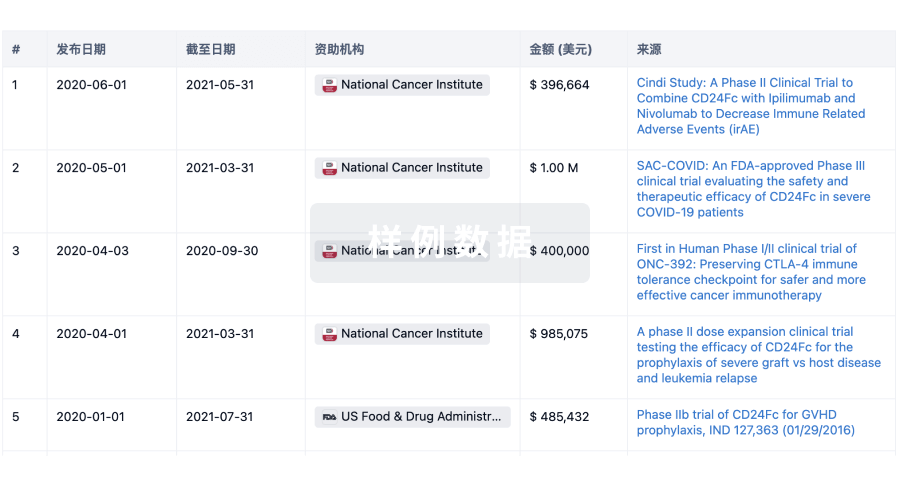
科研基金(NIH)
访问超过 200 万项资助和基金信息,以提升您的研究之旅。
登录
或
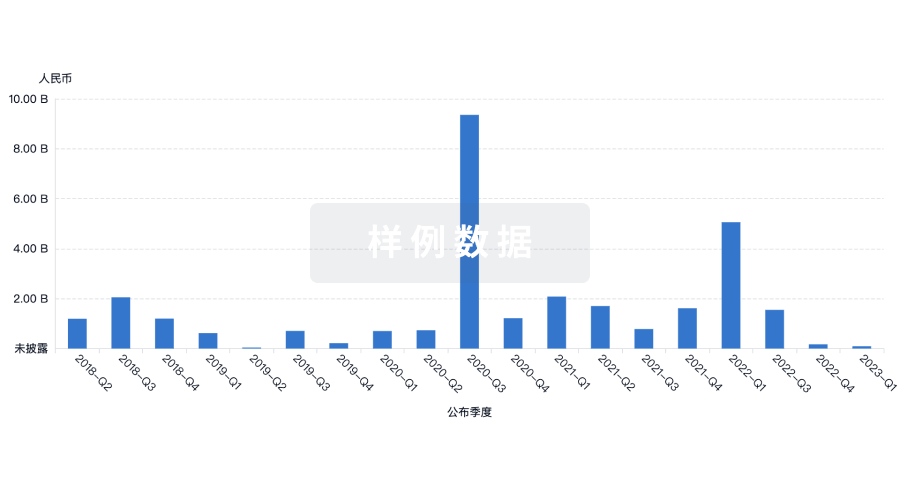
投资
深入了解从初创企业到成熟企业的最新公司投资动态。
登录
或
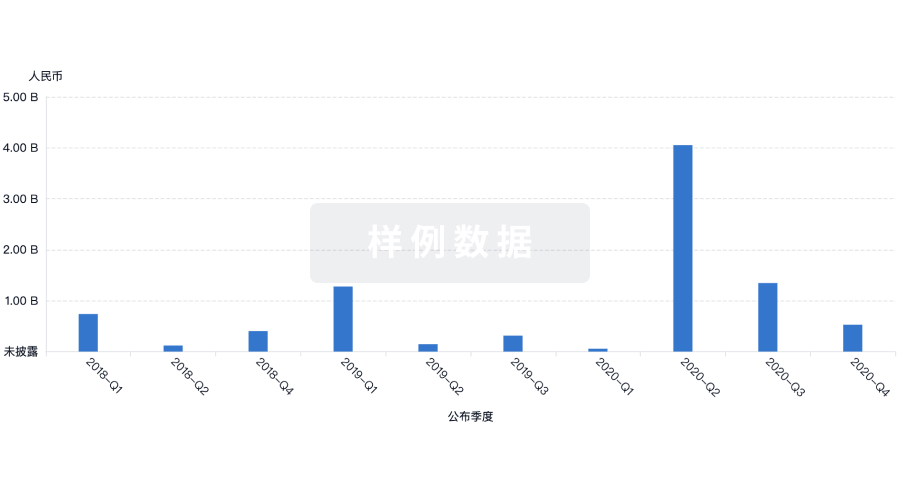
融资
发掘融资趋势以验证和推进您的投资机会。
登录
或
标准版
¥16800
元/账号/年
新药情报库 | 省钱又好用!
立即使用
立即开始免费试用!
智慧芽新药情报库是智慧芽专为生命科学人士构建的基于AI的创新药情报平台,助您全方位提升您的研发与决策效率。
立即开始数据试用!
智慧芽新药库数据也通过智慧芽数据服务平台,以API或者数据包形式对外开放,助您更加充分利用智慧芽新药情报信息。
生物序列数据库
生物药研发创新
免费使用
化学结构数据库
小分子化药研发创新
免费使用