预约演示
更新于:2025-05-07

Breckenridge Village of Tyler
更新于:2025-05-07
概览
关联
100 项与 Breckenridge Village of Tyler 相关的临床结果
登录后查看更多信息
0 项与 Breckenridge Village of Tyler 相关的专利(医药)
登录后查看更多信息
1
项与 Breckenridge Village of Tyler 相关的新闻(医药)2023-06-08
Acquisitions broaden Merit’s therapeutic platform with diverse dialysis product solutions and expand its access catheter offering
Acquisitions projected to add approximately $30 million of revenue, on an annualized basis, in key strategic markets that leverage existing commercial footprint
Merit re-affirms full-year 2023 financial guidance on stand-alone basis and updates full-year 2023 financial guidance to include partial-year impact from acquisitions
SOUTH JORDAN, Utah, June 08, 2023 (GLOBE NEWSWIRE) -- Merit Medical Systems, Inc. (NASDAQ: MMSI), a leading global manufacturer and marketer of healthcare technology, today announced it has completed the acquisition of a portfolio of dialysis catheter products and the BioSentry® Biopsy Tract Sealant System from AngioDynamics, Inc. for a total cash consideration of $100 million. Merit also announced the recent acquisition of the Surfacer® Inside-Out® Access Catheter System from Bluegrass Vascular Technologies, Inc. for a total cash consideration of $32.5 million.
“We are selectively investing to expand our product portfolio in key strategic markets that leverage our existing commercial footprint,” said Fred P. Lampropoulos, Merit’s Chairman and Chief Executive Officer. “These acquisitions strengthen our position in the dialysis and biopsy markets, and expand the foundation of our growing specialty dialysis device offering, which includes WRAPSODY™ Cell-Impermeable Endoprosthesis, HeRO® Graft, and the Surfacer System devices. Many dialysis patients rely on these solutions to receive vital therapies. Combining this broad portfolio of interventional solutions within Merit will allow us to leverage our physician relationships and commercial infrastructure to serve more patients in the multi-billion dialysis market.”
Mr. Lampropoulos continued: “In addition to the strong strategic rationale, we believe the financial pro these acquisitions is compelling. We expect these acquisitions to be accretive to our non-GAAP net income* and non-GAAP EPS* in the first full year post-closing and accretive to our non-GAAP gross and operating margins*, non-GAAP net income and non-GAAP EPS in the second full year post-closing. Importantly, we reaffirmed our full-year 2023 financial guidance on a stand-alone basis and we have a clear plan that gives us confidence in our team’s ability to deliver seamless integration without disrupting the continued strong execution and progress we expect in year-three of our Foundations for Growth Program.”
* Non-GAAP net income; non-GAAP earnings per share; non-GAAP gross margin; non-GAAP operating margin and constant currency revenue are non-GAAP financial measures. A description of these financial measures is included under the heading “Non-GAAP Financial Measures” below. A quantitative reconciliation of such financial measures to comparable GAAP financial measures is not available without unreasonable effort.
Transaction Summary:
The acquired dialysis catheter portfolio includes the innovative BioFlo DuraMax® Dialysis Catheter with Endexo® Technology, a proprietary material more resistant to thrombus (blood clot) accumulation, in vitro, compared to conventional non-coated dialysis catheters.1 Thrombus formation can block blood flow through a catheter, preventing adequate dialysis treatment. In addition to the dialysis portfolio, Merit also acquired the BioSentry® Biopsy Tract Sealant System from AngioDynamics, which complements Merit’s comprehensive biopsy portfolio. The BioSentry system is designed specifically to reduce the incidence of biopsy-related pneumothorax (collapsed lung).3 Pneumothorax is a potentially life-threatening complication that can extend hospitalization and occurs in approximately one-quarter of patients undergoing lung biopsy.4
Merit’s purchase of the AngioDynamics dialysis catheter portfolio follows Merit’s recent acquisition of the Surfacer Inside-Out Access Catheter System from Bluegrass Vascular Technologies, Inc. The Surfacer is a unique device designed to obtain right-sided central venous access in patients with venous obstructions,2 providing this population with access to life saving therapies including hemodialysis and chemotherapy. Learn more about the newly acquired products here.
Financial Summary:
The acquired assets generated approximately $33 million of revenue over the trailing twelve months ended May 31, 2023. The acquired assets are expected to contribute revenue, from closing date through December 31, 2023, in the range of $13 to $15 million and are expected to dilute Merit’s previously guided GAAP gross and operating margin forecasts but generate non-GAAP gross and operating margins generally consistent with Merit’s historical performance on a stand-alone basis. The acquisitions are expected to be slightly dilutive to Merit’s full-year 2023 non-GAAP net income and non-GAAP earnings per share, inclusive of approximately $3.5 million of additional interest expense on incremental borrowings to finance the transactions and excluding approximately $15.2 million of non-cash and non-recurring transaction-related expenses, and dilutive to Merit’s full-year 2023 GAAP net income and GAAP earnings per share. The acquisitions are expected to be accretive to non-GAAP net income and earnings per share in the first full-year post-close, but dilutive to Merit’s GAAP net income and earnings per share for that period. The acquisitions are expected to be accretive to Merit’s non-GAAP gross and operating margins, non-GAAP net income and non-GAAP EPS in the second full-year post-close, but dilutive to Merit’s GAAP gross and operating margins, net income and EPS for that period.
Updated Fiscal Year 2023 Financial Guidance
Merit’s updated full-year 2023 financial guidance now reflects the forecasted impacts of the acquisitions of AngioDynamics’ dialysis catheter portfolio and BioSentry Biopsy Tract Sealant System and the acquisition of the Surfacer Inside-Out Access Catheter System from Bluegrass Vascular Technologies, Inc. from the closing date through December 31, 2023. Merit is reaffirming prior full-year 2023 financial guidance ranges for the stand-alone Merit business previously announced on April 26, 2023.
Based upon the information currently available to Merit’s management, for the year ending December 31, 2023, absent additional material acquisitions, non-recurring transactions or other factors beyond Merit’s current expectations, Merit now expects:
Revenue and Earnings Guidance*
Prior Year (As Reported)
Updated Guidance(1)
Prior Guidance(2)
% Change
% Change
Financial Measure
December 31, 2022
December 31, 2023
Y/Y
December 31, 2023
Y/Y
Net Sales
$1.151 billion
$1.230 - $1.244 billion
7% - 8%
$1.217 - $1.229 billion
6% - 7%
Cardiovascular Segment
$1.118 billion
$1.192 - $1.206 billion
7% - 8%
$1.179 - $1.191 billion
5% - 6%
Endoscopy Segment
$32.8 million
$37.8 - $38.1 million
15% - 16%
$37.8 - $38.1 million
15% - 16%
GAAP
Net Income
$74.5 million
$87 - $92 million
$100 - $105 million
Earnings Per Share
$1.29
$1.49 - $1.57
$1.71 - $1.79
Non-GAAP
Net Income
$155.8 million
$164 - $170 million
$166 - $171 million
Earnings Per Share
$2.70
$2.81 - $2.92
$2.83 - $2.93
*Percentage figures approximated; dollar figures may not foot due to rounding
2023 Net Sales Guidance - % Change from Prior Year (Constant Currency) Reconciliation*
Updated Guidance(1)
Prior Guidance(2)
Low
High
Low
High
2023 Net Sales Guidance - % Change from Prior Year (GAAP)
6.9%
8.1%
5.7%
6.8%
Estimated impact of foreign currency exchange rate fluctuations
-0.4%
-0.3%
-0.4%
-0.3%
2023 Net Sales Guidance - % Change from Prior Year (Constant Currency)
7.2%
8.4%
6.1%
7.1%
*Percentage figures approximated, and figures may not foot due to rounding
(1)“Updated Guidance” reflects Merit’s full-year 2023 financial guidance on stand-alone basis, plus the forecasted impacts of the acquisition of AngioDynamics’ dialysis catheter portfolio and BioSentry Biopsy Tract Sealant System and the acquisition of the Surfacer Inside-Out Access Catheter System from Bluegrass Vascular Technologies, Inc. from closing date through December 31, 2023.
(2) “Prior Guidance” previously introduced on April 26, 2023 and reflects Merit’s full-year 2023 financial guidance on a stand-alone basis, excluding the acquisitions announced today.
Advisors:
Piper Sandler & Co. acted as lead financial advisor to Merit and Oppenheimer & Co. acted as a financial advisor to Merit. UBS Investment Bank acted as financial advisor to AngioDynamics, Inc. Parr Brown Gee & Loveless P.C. served as legal advisor to Merit. Cadwalader Wickersham & Taft served as legal advisor to AngioDynamics.
Non-GAAP Financial Measures
Although Merit’s financial statements are prepared in accordance with accounting principles generally accepted in the United States of America (“GAAP”), Merit’s management believes that the non-GAAP financial measures referenced in this release may provide investors with useful information regarding the underlying business trends and performance of Merit’s ongoing operations and can be useful for period-over-period comparisons of such operations. Non-GAAP financial measures referenced in this release include:
constant currency revenue;
non-GAAP gross profit and margin;
non-GAAP operating income and margin;
non-GAAP net income; and
non-GAAP earnings per share.
Merit’s management team uses these non-GAAP financial measures to evaluate Merit’s profitability and efficiency, to compare operating and financial results to prior periods, to evaluate changes in the results of its operating segments, and to measure and allocate financial resources internally. However, Merit’s management does not consider such non-GAAP measures in isolation or as an alternative to measures determined in accordance with GAAP.
Readers should consider non-GAAP measures referenced in this release in addition to, not as a substitute for, financial reporting measures prepared in accordance with GAAP. These non-GAAP financial measures generally exclude some, but not all, items that may affect Merit’s net income. In addition, they are subject to inherent limitations as they reflect the exercise of judgment by management about which items are excluded. Merit believes it is useful to exclude such items in the calculation of non-GAAP earnings per share, non-GAAP gross profit and margin, non-GAAP operating income and margin, and non-GAAP net income because such amounts in any specific period may not directly correlate to the underlying performance of Merit’s business operations and can vary significantly between periods as a result of factors such as acquisition or other extraordinary transactions, non-cash expenses related to amortization or write-off of previously acquired tangible and intangible assets, certain severance expenses, expenses resulting from non-ordinary course litigation or administrative proceedings and resulting settlements, corporate transformation expenses, governmental proceedings or changes in tax or industry regulations, gains or losses on disposal of certain assets, and debt issuance costs. Merit may incur similar types of expenses in the future, and the non-GAAP financial information referenced in this release should not be viewed as a statement or indication that these types of expenses will not recur. Additionally, the non-GAAP financial measures referenced in this release may not be comparable with similarly titled measures of other companies. Merit urges readers to review the reconciliations of its non-GAAP financial measures to their most directly comparable GAAP financial measures, and not to rely on any single financial measure to evaluate Merit’s business or results of operations.
Constant Currency Revenue
Merit’s constant currency revenue is prepared by converting the current-period reported revenue of subsidiaries whose functional currency is a currency other than the U.S. dollar at the applicable foreign exchange rates in effect during the comparable prior-year period and adjusting for the effects of hedging transactions on reported revenue, which are recorded in the U.S. dollar.
Non-GAAP Gross Profit and Margin
Non-GAAP gross profit is calculated by reducing GAAP cost of sales by amounts recorded for amortization of intangible assets and inventory mark-up related to acquisitions. Non-GAAP gross margin is calculated by dividing non-GAAP gross profit by reported net sales.
Non-GAAPOperating Income and Margin
Non-GAAP operating income is calculated by adjusting GAAP operating income for certain items which are deemed by Merit’s management to be outside of core operations and vary in amount and frequency among periods, such as expenses related to acquisitions or other extraordinary transactions, non-cash expenses related to amortization or write-off of previously acquired tangible and intangible assets, certain severance expenses, performance-based stock compensation expenses, corporate transformation expenses, expenses resulting from non-ordinary course litigation or administrative proceedings and resulting settlements, governmental proceedings, and changes in governmental or industry regulations. Non-GAAP operating margin is calculated by dividing non-GAAP operating income by reported net sales.
Non-GAAP Net Income
Non-GAAP net income is calculated by adjusting GAAP net income for the items set forth in the definition of non-GAAP operating income above, as well as for expenses related to debt issuance costs, gains or losses on disposal of certain assets, changes in tax regulations, and other items.
Non-GAAP EPS
Non-GAAP EPS is defined as non-GAAP net income divided by the diluted shares outstanding for the corresponding period.
ABOUT MERIT
Founded in 1987, Merit Medical Systems, Inc. is a leading global manufacturer and marketer of healthcare technology. Merit serves client hospitals worldwide with a domestic and international sales force and clinical support team totaling in excess of 700 individuals. Merit employs approximately 7,100 people worldwide with facilities in South Jordan, Utah; Pearland, Texas; Richmond, Virginia; Aliso Viejo, California; Maastricht and Venlo, The Netherlands; Paris, France; Galway, Ireland; Beijing, China; Tijuana, Mexico; Joinville, Brazil; Ontario, Canada; Melbourne, Australia; Tokyo, Japan; Reading, United Kingdom; Johannesburg, South Africa; and Singapore.
CAUTIONARY STATEMENT REGARDING FORWARD-LOOKING STATEMENTS
Statements contained in this release which are not purely historical, including, without limitation, statements regarding Merit’s forecasted plans, revenues, net sales, net income (GAAP and non-GAAP), operating income and margin (GAAP and non-GAAP), gross profit and margin (GAAP and non-GAAP), earnings per share (GAAP and non-GAAP) and other financial measures, acquisition transactions, future growth and profit expectations or forecasted economic conditions, or the implementation of, and results which may be achieved through, Merit’s Foundations for Growth Program or other expense reduction initiatives, are forward-looking statements within the meaning of Section 27A of the Securities Act of 1933, as amended, and Section 21E of the Securities Exchange Act of 1934, as amended, and are subject to risks and uncertainties such as those described in Merit’s Annual Report on Form 10-K for the year ended December 31, 2022 (the “2022 Annual Report”) and other filings with the SEC. Such risks and uncertainties include Merit’s inability to manage the integration of products acquired from AngioDynamics, Inc. (“AngioDynamics”) and Bluegrass Vascular Technologies, Inc. (“BVT”) and achieve anticipated financial results, product development and other anticipated benefits of the AngioDynamics and BVT acquisitions, uncertainties as to whether Merit will achieve sales, gross and operating margins, net income and earnings per share consistent with its forecasts, unknown expenses and risks associated with the commercialization of the products acquired from AngioDynamics and BVT, inherent risks and uncertainties relating to Merit’s internal models or the projections in this release; disruptions in Merit’s supply chain, manufacturing or sterilization processes; reduced availability of, and price increases associated with, commodity components and other raw materials; adverse changes in freight, shipping and transportation expenses; negative changes in economic and industry conditions in the United States or other countries, including inflation; risks relating to Merit’s potential inability to successfully manage growth through acquisitions generally, including the inability to effectively integrate acquired operations or products or commercialize technology developed internally or acquired through completed, proposed or future transactions; risks associated with Merit’s ongoing or prospective manufacturing transfers and facility consolidations; fluctuations in interest or foreign currency exchange rates; risks and uncertainties associated with Merit’s information technology systems, including the potential for breaches of security and evolving regulations regarding privacy and data protection; governmental scrutiny and regulation of the medical device industry, including governmental inquiries, investigations and proceedings involving Merit; consequences associated with a Corporate Integrity Agreement executed between Merit and the U.S. Office of Inspector General; difficulties, delays and expenditures relating to development, testing and regulatory approval or clearance of Merit’s products, including the pursuit of approvals under the MDR, and risks that such products may not be developed successfully or approved for commercial use; litigation and other judicial proceedings affecting Merit; the potential of fines, penalties or other adverse consequences if Merit’s employees or agents violate the U.S. Foreign Corrupt Practices Act or other laws or regulations; restrictions on Merit’s liquidity or business operations resulting from its debt agreements; infringement of Merit’s technology or the assertion that Merit’s technology infringes the rights of other parties; product recalls and product liability claims; changes in customer purchasing patterns or the mix of products Merit sells; laws and regulations targeting fraud and abuse in the healthcare industry; potential for significant adverse changes in governing regulations, including reforms to the procedures for approval or clearance of Merit’s products by the U.S. Food & Drug Administration or comparable regulatory authorities in other jurisdictions; changes in tax laws and regulations in the United States or other jurisdictions; termination of relationships with Merit’s suppliers, or failure of such suppliers to perform; concentration of a substantial portion of Merit’s revenues among a few products and procedures; development of new products and technology that could render Merit’s existing or future products obsolete; market acceptance of new products; dependance on distributors to commercialize Merit’s products in various jurisdictions outside the United States; volatility in the market price of Merit’s common stock; modification or limitation of governmental or private insurance reimbursement policies; changes in healthcare policies or markets related to healthcare reform initiatives; failure to comply with applicable environmental laws; changes in key personnel; work stoppage or transportation risks; failure to introduce products in a timely fashion; price and product competition; fluctuations in and obsolescence of inventory; and other factors referenced in the 2022 Annual Report and other materials filed with the SEC. All subsequent forward-looking statements attributable to Merit or persons acting on its behalf are expressly qualified in their entirety by these cautionary statements. Actual results will likely differ, and may differ materially, from anticipated results. Financial estimates are subject to change and are not intended to be relied upon as predictions of future operating results. Those estimates and all other forward-looking statements included in this release are made only as of the date of this document, and except as otherwise required by applicable law, Merit assumes no obligation to update or disclose revisions to estimates and all other forward-looking statements.
TRADEMARKS
Unless noted otherwise, trademarks and registered trademarks used in this release are the property of Merit Medical Systems, Inc. and its subsidiaries in the United States and other jurisdictions.
Endexo® is a trademark of EVONIK CANADA INC.
REFERENCES
1. The reduction in thrombus accumulation (based on platelet count) is supported by acute in-vitro testing. Pre-clinical in-vitro evaluations do not necessarily predict clinical performance with respect to thrombus formation.
2. Reindl-Schwaighofer et al. 2011. “A Novel Inside-out Access Approach for Hemodialysis Catheter Placement in Patients With Thoracic Central Venous Occlusion.” AM j Kidney Dis 75(4): 480 ̶ 487. (PMID: 31787341)
3. Ahrar et al. 2017. “Efficacy of a Self-expanding Tract Sealant Device in the Reduction of Pneumothorax and Chest Tube Placement Rates After Percutaneous Lung Biopsy: A Matched Controlled Study Using Propensity Score Analysis.” Cardiovasc Intervent Radiol 40(2): 270 ̶ 276. (PMID: 27826786)
4. Huo et al. 2020. “Pneumothorax Rates in CT-Guided Lung Biopsies: A Comprehensive Systematic Review and Meta-Analysis of Risk Factors.” Br J Radiol 93(1108): 20190866. Epub 2020 Jan 3. (PMID: 31860329)
Contacts:
PR/Media Inquiries:
Sarah Comstock
Merit Medical
Investor Inquiries:
Mike Piccinino, CFA, IRC
Westwicke - ICR
+1-801-432-2864
+1-443-213-0509
sarah.comstock@merit.com
mike.piccinino@westwicke.com
并购
100 项与 Breckenridge Village of Tyler 相关的药物交易
登录后查看更多信息
100 项与 Breckenridge Village of Tyler 相关的转化医学
登录后查看更多信息
组织架构
使用我们的机构树数据加速您的研究。
登录
或
管线布局
2026年02月08日管线快照
无数据报导
登录后保持更新
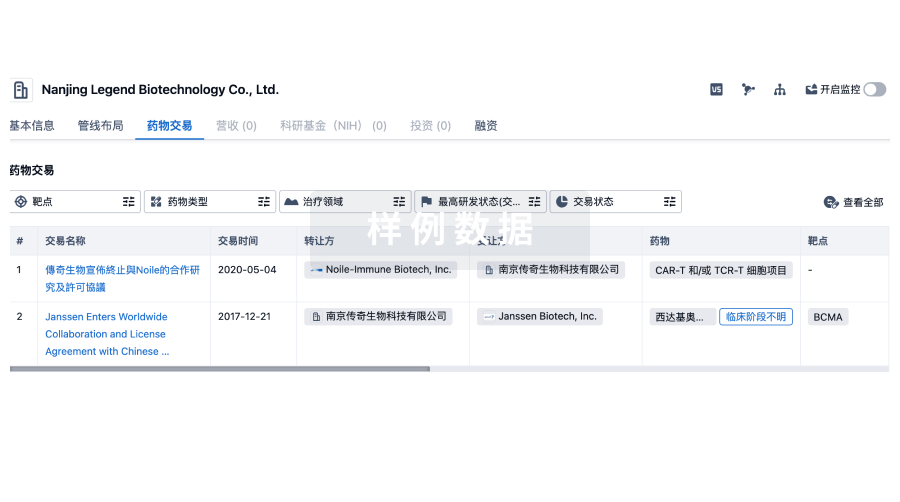
药物交易
使用我们的药物交易数据加速您的研究。
登录
或
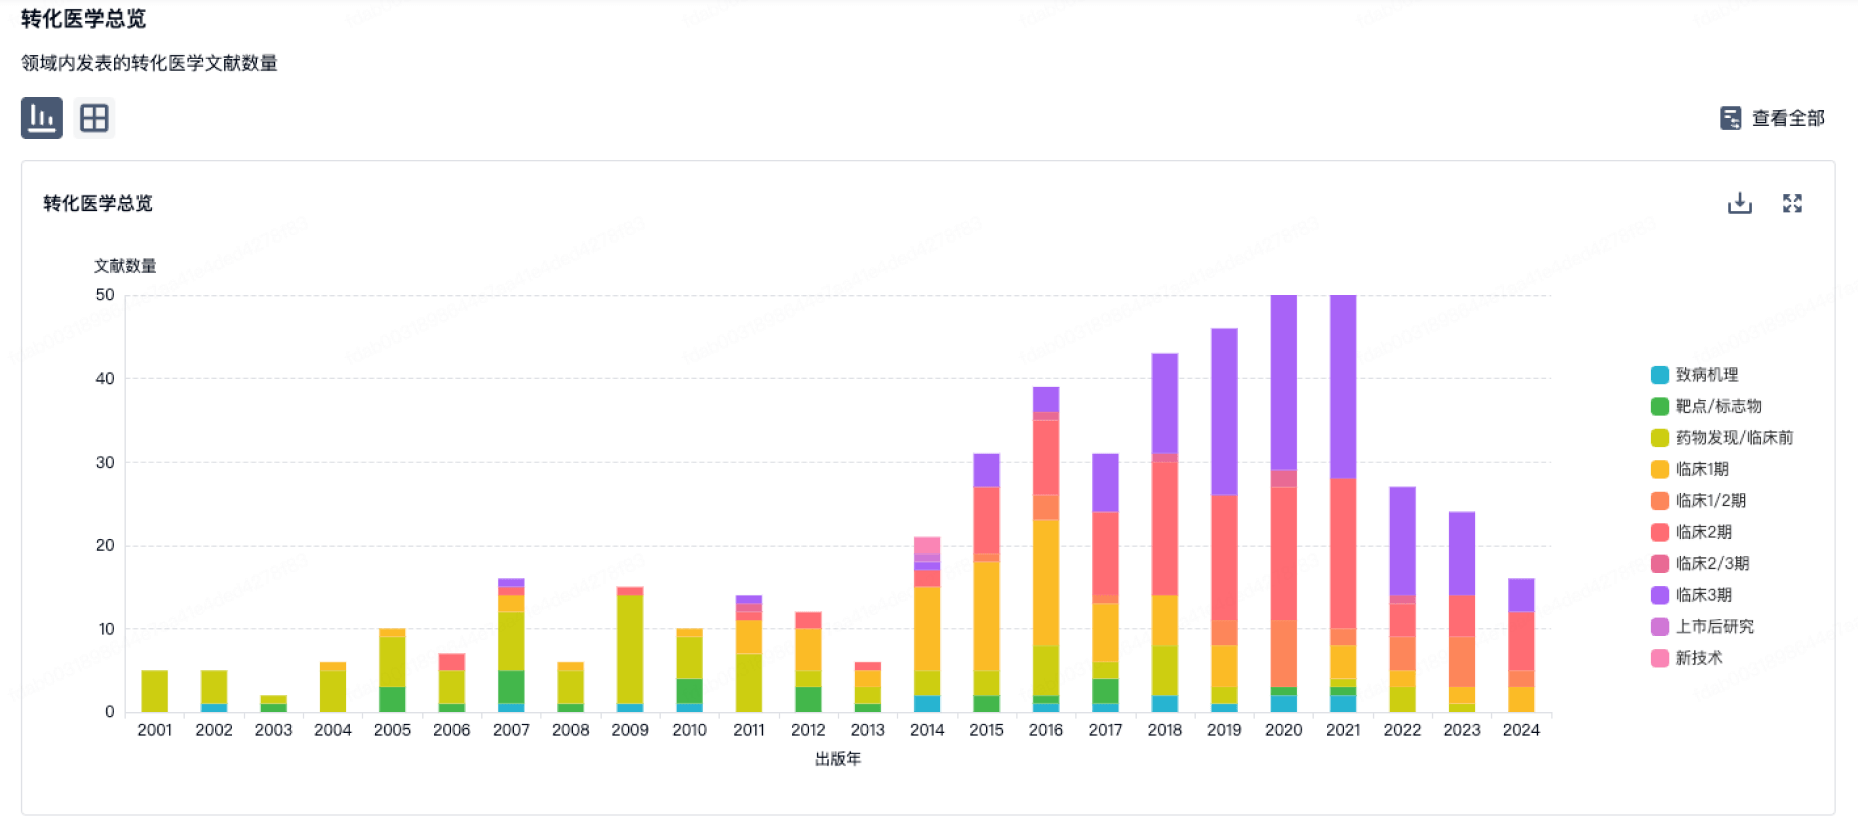
转化医学
使用我们的转化医学数据加速您的研究。
登录
或
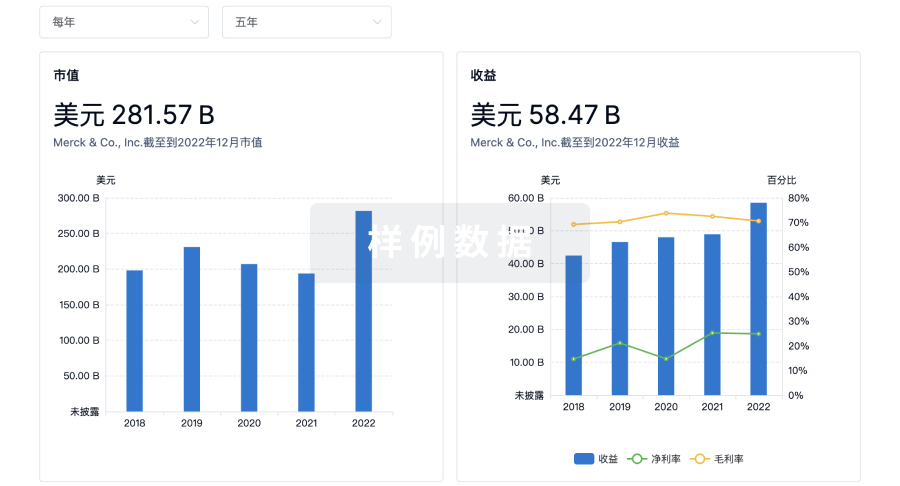
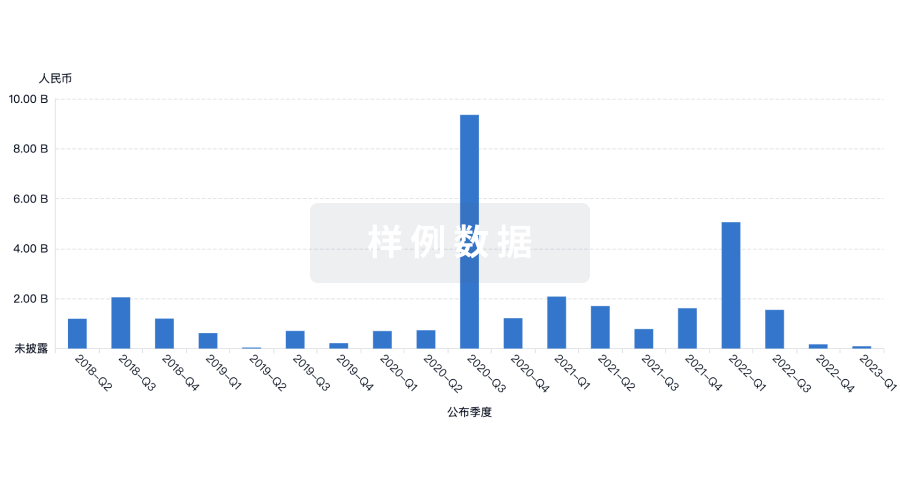
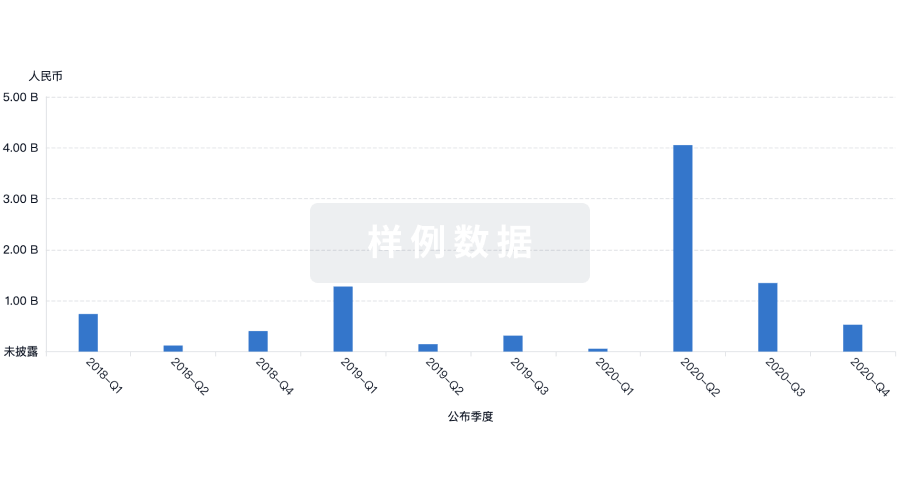
营收
使用 Synapse 探索超过 36 万个组织的财务状况。
登录
或
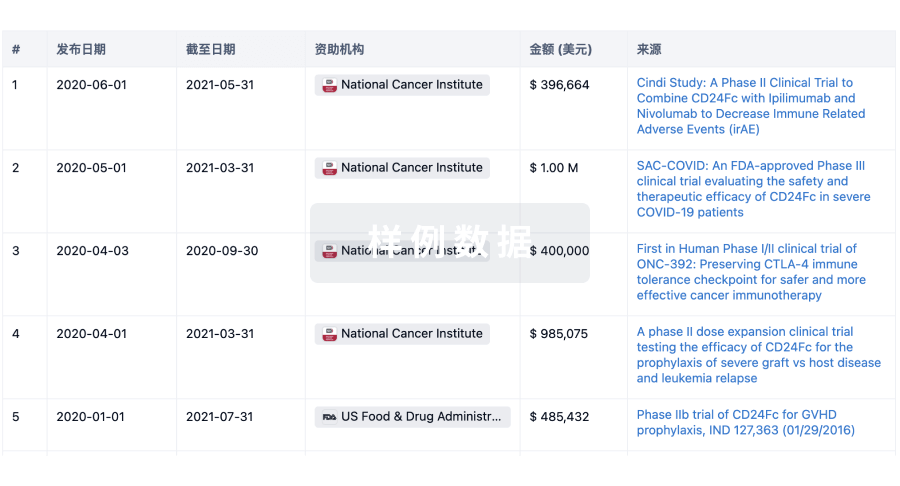
科研基金(NIH)
访问超过 200 万项资助和基金信息,以提升您的研究之旅。
登录
或
投资
深入了解从初创企业到成熟企业的最新公司投资动态。
登录
或
融资
发掘融资趋势以验证和推进您的投资机会。
登录
或
生物医药百科问答
全新生物医药AI Agent 覆盖科研全链路,让突破性发现快人一步
立即开始免费试用!
智慧芽新药情报库是智慧芽专为生命科学人士构建的基于AI的创新药情报平台,助您全方位提升您的研发与决策效率。
立即开始数据试用!
智慧芽新药库数据也通过智慧芽数据服务平台,以API或者数据包形式对外开放,助您更加充分利用智慧芽新药情报信息。
生物序列数据库
生物药研发创新
免费使用
化学结构数据库
小分子化药研发创新
免费使用