预约演示
更新于:2026-01-22

Microbial Solutions Ltd.
更新于:2026-01-22
概览
关联
100 项与 Microbial Solutions Ltd. 相关的临床结果
登录后查看更多信息
0 项与 Microbial Solutions Ltd. 相关的专利(医药)
登录后查看更多信息
15
项与 Microbial Solutions Ltd. 相关的新闻(医药)2025-11-05
WILMINGTON, Mass.--(BUSINESS WIRE)--Charles River Laboratories International, Inc. (NYSE: CRL) today reported its results for the third quarter of 2025. For the quarter, revenue was $1.00 billion, a decrease of 0.5% from $1.01 billion in the third quarter of 2024.
The impact of foreign currency translation increased reported revenue by 1.3%, and the divestiture of a small Safety Assessment site in 2024 reduced reported revenue by 0.2%. Excluding the effect of these items, revenue declined 1.6% on an organic basis. On a segment basis, lower revenue in the Discovery and Safety Assessment (DSA) and Manufacturing Solutions (Manufacturing) segments were partially offset by organic revenue growth in the Research Models and Services (RMS) segment.
In the third quarter of 2025, the GAAP operating margin increased to 13.3% from 11.6% in the third quarter of 2024, primarily driven by lower costs associated with the Company's restructuring initiatives. GAAP net income available to common shareholders for the third quarter of 2025 was $54.4 million, or $1.10 per diluted share, a decrease from net earnings of $68.7 million, or $1.33 per diluted share, for the same period in 2024. The decreases in GAAP net income and earnings per share were primarily driven by a loss from certain venture capital and other strategic investments of $0.33 per share in the third quarter of 2025, compared to a $0.03 gain last year.
On a non-GAAP basis, the third-quarter operating margin decreased to 19.7% from 19.9% in the third quarter of 2024, primarily as a result of lower revenue. Non-GAAP net income was $120.3 million for the third quarter of 2025, a decrease of 10.0% from $133.7 million for the same period in 2024. Third-quarter diluted earnings per share on a non-GAAP basis were $2.43, a decrease of 6.2% from $2.59 per share for the third quarter of 2024. The non-GAAP net income and earnings per share decreases were driven primarily by lower revenue and a higher tax rate, partially offset by lower interest expense, as well as a reduction in diluted shares outstanding from stock repurchases.
James C. Foster, Chair, President and Chief Executive Officer, said, “Our solid third-quarter financial results demonstrate that the demand for our extensive portfolio of early-stage research and manufacturing products and services remains stable. We believe that positive signals are beginning to emerge which indicate that the industry may be on a path towards recovery; however, sustained improvement in our business will take time. There is still some uncertainty in the healthcare sector, so we are remaining cautious at this time.”
"In this environment, we believe it is critical to remain intently focused on our strategy to further differentiate ourselves from the competition through our science and our innovative solutions, implement additional initiatives to unlock value, and gain additional share of our clients’ drug development and manufacturing programs. This focus on our strategy and our science positions us extremely well to lead the industry through advances in drug development," Mr. Foster concluded.
Third-Quarter Segment Results
Research Models and Services (RMS)
Revenue for the RMS segment was $213.5 million in the third quarter of 2025, an increase of 7.9% from $197.8 million in the third quarter of 2024. The impact of foreign currency translation increased revenue by 1.4%. Organic revenue increased by 6.5%, due primarily to higher revenue for large research model products.
In the third quarter of 2025, the RMS segment’s GAAP operating margin increased to 16.2% from 13.9% in the third quarter of 2024. On a non-GAAP basis, the operating margin increased to 25.0% from 21.0%. The GAAP and non-GAAP operating margin increases were primarily driven by the favorable revenue mix related to large research models, as well as the benefit of cost savings resulting from the Company's restructuring initiatives.
Discovery and Safety Assessment (DSA)
Revenue for the DSA segment was $600.7 million in the third quarter of 2025, a decrease of 2.3% from $615.1 million in the third quarter of 2024. The impact of foreign currency translation increased DSA revenue by 1.2% and the divestiture of a small DSA site reduced reported revenue by 0.4%. Organic revenue decreased by 3.1%, driven primarily by lower sales volume for both discovery and regulated safety assessment services.
In the third quarter of 2025, the DSA segment’s GAAP operating margin decreased to 20.5% from 20.6% in the third quarter of 2024. On a non-GAAP basis, the operating margin decreased to 25.4% from 27.4% in the third quarter of 2024. The GAAP and non-GAAP operating margin decreases were primarily driven by lower revenue.
Manufacturing Solutions (Manufacturing)
Revenue for the Manufacturing segment was $190.7 million in the third quarter of 2025, a decrease of 3.1% from $196.9 million in the third quarter of 2024. The impact of foreign currency translation increased Manufacturing revenue by 2.0%. Organic revenue decreased 5.1%, primarily driven by lower revenue in the CDMO and Biologics Testing businesses, partially offset by higher revenue in the Microbial Solutions business.
The Manufacturing segment’s GAAP operating margin increased to 20.9% from 20.4% in the third quarter of 2024 as a result of lower acquisition-related amortization adjustments in the CDMO business and lower costs associated with the Company's restructuring initiatives. On a non-GAAP basis, the operating margin decreased to 26.7% from 28.7% in the third quarter of 2024, driven primarily by lower revenue in the CDMO business.
Updates 2025 Guidance
The Company is updating its 2025 financial guidance, which was previously updated on August 6, 2025. The Company is narrowing its full-year outlook for revenue and non-GAAP earnings per share to the middle and upper ends of the previous ranges, respectively, to primarily reflect the third-quarter financial performance, which modestly exceeded the Company's prior outlook.
The Company’s 2025 guidance for revenue and earnings per share is as follows:
2025 GUIDANCE
CURRENT
PRIOR
Revenue growth/(decrease), reported
(1.5)% – (0.5)%
(2.5)% – (0.5)%
Impact of divestitures/(acquisitions), net
N/M
N/M
(Favorable)/unfavorable impact of foreign exchange
~(1.0)%
~(0.5)%
Revenue growth/(decrease), organic (1)
(2.5)% – (1.5)%
(3.0)% – (1.0)%
GAAP EPS estimate
$4.15 – $4.35
$4.25 – $4.65
Acquisition-related amortization and other acquisition- and integration-related costs (2)
~$3.65
~$3.60
Costs associated with restructuring actions (3)
~$1.30
~$1.40
Certain venture capital and other strategic investment losses/(gains), net (4)
$0.50
~$0.17
Other items (5)
~$0.50
~$0.50
Non-GAAP EPS estimate
$10.10 – $10.30
$9.90 – $10.30
Footnotes to Guidance Table:
(1) Organic revenue growth is defined as reported revenue growth adjusted for completed acquisitions and divestitures, as well as foreign currency translation.
(2) These adjustments include amortization related to intangible assets, inclusive of the acceleration of amortization expense related to certain CDMO client relationships, as well as the purchase accounting step-up on inventory and certain long-term biological assets. In addition, these adjustments include some costs related to the evaluation and integration of acquisitions and divestitures.
(3) These adjustments primarily include site consolidation (including site transition costs), severance, impairment, and other costs related to the Company’s restructuring actions.
(4) Certain venture capital and other strategic investment performance only includes recognized gains or losses on certain investments. The Company does not forecast the future performance of these investments.
(5) These items primarily relate to (i) certain third-party legal costs related to investigations by the U.S. government into the NHP supply chain related to our DSA segment; (ii) additionally included within the DSA segment, due to the utilization of NHPs, are reductions to the previous $27 million inventory charge incurred during fiscal 2024, to write down inventory associated with the Cambodia-sourced NHP matter from February 16, 2023, as a result of the cases being closed during fiscal 2025; and (iii) certain third-party advisory costs related to the Company entering into a Cooperation Agreement with a shareholder.
Webcast
Charles River has scheduled a live webcast on Wednesday, November 5th, at 9:00 a.m. ET to discuss matters relating to this press release. To participate, please go to ir.criver.com and select the webcast link. You can also find the associated slide presentation and reconciliations of GAAP financial measures to non-GAAP financial measures on the website.
Non-GAAP Reconciliations
The Company reports non-GAAP results in this press release, which exclude often-one-time charges and other items that are outside of normal operations. A reconciliation of GAAP to non-GAAP results is provided in the schedules at the end of this press release.
Use of Non-GAAP Financial Measures
This press release contains non-GAAP financial measures, such as non-GAAP earnings per diluted share, non-GAAP operating income, non-GAAP operating margin, and non-GAAP net income. Non-GAAP financial measures exclude, but are not limited to, the amortization of intangible assets and the purchase accounting step-up adjustment on inventory and certain long term biological assets, and other charges and adjustments related to our acquisitions and divestitures, including incremental dividends attributable to Noveprim noncontrolling interest holders; expenses associated with evaluating and integrating acquisitions and divestitures, including advisory fees and certain other transaction-related costs, as well as fair value adjustments associated with contingent consideration; charges, gains, and losses attributable to businesses or properties we plan to close, consolidate, or divest; severance and other costs associated with our restructuring initiatives; the write-off of deferred financing costs and fees related to debt financing; investment gains or losses associated with our venture capital and certain other strategic equity investments; certain legal costs in our Microbial Solutions business related to environmental litigation and in our DSA segment related to U.S. government investigations into the NHP supply chain and advisory costs related to entering into a Cooperation Agreement with a shareholder; tax effect of all of the aforementioned matters; and adjustments related to the recognition of deferred tax assets expected to be utilized as a result of changes to the our international financing structure and the revaluation of deferred tax liabilities as a result of foreign tax legislation. This press release also refers to our revenue on both a GAAP and non-GAAP basis: on a non-GAAP basis, we define “organic revenue growth” as reported revenue growth adjusted for foreign currency translation, acquisitions, and divestitures. We exclude these items from the non-GAAP financial measures because they are outside our normal operations. There are limitations in using non-GAAP financial measures, as they are not presented in accordance with generally accepted accounting principles, and may be different than non-GAAP financial measures used by other companies. In particular, we believe that the inclusion of supplementary non-GAAP financial measures in this press release helps investors to gain a meaningful understanding of our core operating results and future prospects without the effect of these often-one-time charges, and is consistent with how management measures and forecasts the Company's performance, especially when comparing such results to prior periods or forecasts. We believe that the financial impact of our acquisitions and divestitures (and in certain cases, the evaluation of such acquisitions and divestitures, whether or not ultimately consummated) is often large relative to our overall financial performance, which can adversely affect the comparability of our results on a period-to-period basis. In addition, certain activities and their underlying associated costs, such as business acquisitions, generally occur periodically but on an unpredictable basis. We calculate non-GAAP integration costs to include third-party integration costs incurred post-acquisition. Presenting revenue on an organic basis allows investors to measure our revenue growth exclusive of acquisitions, divestitures, and foreign currency exchange fluctuations more clearly. Non-GAAP results also allow investors to compare the Company’s operations against the financial results of other companies in the industry who similarly provide non-GAAP results. The non-GAAP financial measures included in this press release are not meant to be considered superior to or a substitute for results of operations presented in accordance with GAAP. The Company intends to continue to assess the potential value of reporting non-GAAP results consistent with applicable rules and regulations. Reconciliations of the non-GAAP financial measures used in this press release to the most directly comparable GAAP financial measures are set forth in this press release, and can also be found on the Company’s website at ir.criver.com.
Caution Concerning Forward-Looking Statements
This press release includes forward-looking statements within the meaning of the Private Securities Litigation Reform Act of 1995. Forward-looking statements may be identified by the use of words such as “anticipate,” “believe,” “expect,” “intend,” “will,” “would,” “may,” “estimate,” “plan,” “outlook,” and “project,” and other similar expressions that predict or indicate future events or trends or that are not statements of historical matters. These statements also include statements regarding Charles River’s expectations regarding the availability of Cambodia-sourced NHPs; the impact of the investigations by the U.S. government into the Cambodia NHP supply chain, including but not limited to Charles River’s ability to cooperate fully with the U.S. government; Charles River’s ability to effectively manage any Cambodia NHP supply impact; the projected future financial performance of Charles River and our specific businesses, including our expectations with respect to the impact of NHP supply constraints and our ability to gain market share; earnings per share; operating margin; client demand, particularly the future demand for drug discovery and development products and services, including our expectations for future revenue trends; our expectations with respect to pricing of our products and services; our expectations with respect to future tax rates and the impact of such tax rates on our business; our expectations with respect to the impact of acquisitions and divestitures on the Company, our service offerings, client perception, strategic relationships, revenue, revenue growth rates, revenue growth drivers, and earnings; the development and performance of our services and products, including our investments in our portfolio; market and industry conditions including the outsourcing of services and identification of spending trends by our clients and funding available to them; ability to gain market share and capitalize on business opportunities; the impact of our restructuring initiatives, including annualized savings; the impact of our stock repurchase authorization; and Charles River’s future performance, including as delineated in our forward-looking guidance, and particularly our expectations with respect to revenue, the impact of foreign exchange, interest rates, enhanced efficiency initiatives. Forward-looking statements are based on Charles River’s current expectations and beliefs, and involve a number of risks and uncertainties that are difficult to predict and that could cause actual results to differ materially from those stated or implied by the forward-looking statements. Those risks and uncertainties include, but are not limited to: the timing of the resumption of Cambodia NHP imports into the U.S., our ability to manage supply impact, and potential study delays in our DSA segment attributable to NHP supply constraints; changes and uncertainties in the global economy and financial markets; the ability to successfully integrate businesses we acquire; the timing and magnitude of our share repurchases; negative trends in research and development spending, negative trends in the level of outsourced services, or other cost reduction actions by our clients; the ability to convert backlog to revenue; special interest groups; contaminations; industry trends; new displacement technologies; USDA and FDA regulations; changes in law; continued availability of products and supplies; loss of key personnel; interest rate and foreign currency exchange rate fluctuations; changes in tax regulation and laws; changes in generally accepted accounting principles; disruptions in the global economy caused by geopolitical conflicts; and any changes in business, political, or economic conditions due to the threat of future terrorist activity in the U.S. and other parts of the world, and related U.S. military action overseas. A further description of these risks, uncertainties, and other matters can be found in the Risk Factors detailed in Charles River's Annual Report on Form 10-K as filed on February 19, 2025, as well as other filings we make with the Securities and Exchange Commission. Because forward-looking statements involve risks and uncertainties, actual results and events may differ materially from results and events currently expected by Charles River, and Charles River assumes no obligation and expressly disclaims any duty to update information contained in this press release except as required by law.
About Charles River
Charles River provides essential products and services to help pharmaceutical and biotechnology companies, government agencies and leading academic institutions around the globe accelerate their research and drug development efforts. Our dedicated employees are focused on providing clients with exactly what they need to improve and expedite the discovery, early-stage development and safe manufacture of new therapies for the patients who need them. To learn more about our unique portfolio and breadth of services, visit www.criver.com.
CHARLES RIVER LABORATORIES INTERNATIONAL, INC.
SCHEDULE 1
CONDENSED CONSOLIDATED STATEMENTS OF INCOME (UNAUDITED)
(in thousands, except for per share data)
Three Months Ended
Nine Months Ended
September 27, 2025
September 28, 2024
September 27, 2025
September 28, 2024
Service revenue
$
808,042
$
832,463
$
2,446,801
$
2,492,225
Product revenue
196,810
177,300
574,354
555,215
Total revenue
1,004,852
1,009,763
3,021,155
3,047,440
Costs and expenses:
Cost of services provided (excluding amortization of intangible assets)
572,635
568,699
1,734,939
1,724,246
Cost of products sold (excluding amortization of intangible assets)
93,425
92,043
272,625
275,617
Selling, general and administrative
177,589
199,213
546,937
555,295
Amortization of intangible assets
27,404
32,403
158,052
97,248
Operating income
133,799
117,405
308,602
395,034
Other income (expense):
Interest income
1,422
1,528
3,923
6,740
Interest expense
(25,403
)
(30,284
)
(83,254
)
(98,054
)
Other income (expense), net
(22,618
)
2,592
(34,675
)
6,185
Income before income taxes
87,200
91,241
194,596
309,905
Provision for income taxes
31,644
20,946
60,469
70,867
Net income
55,556
70,295
134,127
239,038
Less: Net income attributable to noncontrolling interests
1,134
638
1,910
2,340
Net income attributable to Charles River Laboratories International, Inc.
$
54,422
$
69,657
$
132,217
$
236,698
Calculation of net income per share attributable to Charles River Laboratories International, Inc. common shareholders
Net income attributable to Charles River Laboratories International, Inc.
$
54,422
$
69,657
$
132,217
$
236,698
Less: Adjustment of redeemable noncontrolling interest
—
379
—
1,081
Less: Incremental dividends attributed to noncontrolling interest holders
—
599
—
9,621
Net income available to Charles River Laboratories International, Inc. common shareholders
$
54,422
$
68,679
$
132,217
$
225,996
Earnings per common share
Basic
$
1.11
$
1.34
$
2.66
$
4.39
Diluted
$
1.10
$
1.33
$
2.65
$
4.37
Weighted-average number of common shares outstanding
Basic
49,213
51,394
49,680
51,461
Diluted
49,426
51,583
49,866
51,713
CHARLES RIVER LABORATORIES INTERNATIONAL, INC.
SCHEDULE 2
CONDENSED CONSOLIDATED BALANCE SHEETS (UNAUDITED)
(in thousands, except per share amounts)
September 27, 2025
December 28, 2024
Assets
Current assets:
Cash and cash equivalents
$
207,097
$
194,606
Trade receivables and contract assets, net of allowances for credit losses of $13,805 and $18,301, respectively
734,482
720,915
Inventories
302,550
278,544
Prepaid assets
121,535
103,210
Other current assets
166,440
105,796
Total current assets
1,532,104
1,403,071
Property, plant and equipment, net
1,591,625
1,604,014
Venture capital and strategic equity investments
194,635
218,350
Operating lease right-of-use assets, net
374,273
412,490
Goodwill
2,922,281
2,846,608
Intangible assets, net
571,094
723,400
Deferred tax assets
36,907
42,179
Other assets
290,893
278,233
Total assets
$
7,513,812
$
7,528,345
Liabilities, Redeemable Noncontrolling Interests and Equity
Current liabilities:
Accounts payable
$
169,615
$
140,337
Accrued compensation
269,697
179,418
Deferred revenue
237,728
248,322
Accrued liabilities
228,895
232,010
Other current liabilities
215,953
194,014
Total current liabilities
1,121,888
994,101
Long-term debt, net and finance leases
2,185,453
2,240,205
Operating lease right-of-use liabilities
443,185
483,789
Deferred tax liabilities
123,007
106,960
Other long-term liabilities
189,462
195,212
Total liabilities
4,062,995
4,020,267
Redeemable noncontrolling interests
40,492
41,126
Equity:
Preferred stock, $0.01 par value; 20,000 shares authorized; no shares issued and outstanding
—
—
Common stock, $0.01 par value; 120,000 shares authorized; 51,351 shares issued and 49,215 shares outstanding as of September 27, 2025, and 51,141 shares issued and outstanding as of December 28, 2024
514
511
Additional paid-in capital
2,015,665
1,966,237
Retained earnings
1,944,317
1,812,100
Treasury stock, at cost, 2,136 and zero shares, as of September 27, 2025 and December 28, 2024, respectively
(363,431
)
—
Accumulated other comprehensive loss
(191,616
)
(317,345
)
Total Charles River Laboratories International, Inc. equity
3,405,449
3,461,503
Nonredeemable noncontrolling interest
4,876
5,449
Total equity
3,410,325
3,466,952
Total liabilities, redeemable noncontrolling interests and equity
$
7,513,812
$
7,528,345
CHARLES RIVER LABORATORIES INTERNATIONAL, INC.
SCHEDULE 3
CONDENSED CONSOLIDATED STATEMENTS OF CASH FLOWS (UNAUDITED)
(in thousands)
Nine Months Ended
September 27, 2025
September 28, 2024
Cash flows relating to operating activities
Net income
$
134,127
$
239,038
Adjustments to reconcile net income to net cash provided by operating activities:
Depreciation and amortization
325,035
259,637
Long-lived asset impairments
36,185
17,339
Stock-based compensation
53,451
52,656
Deferred income taxes
(15,122
)
(25,988
)
Write down of inventories
10,697
11,472
(Gains) losses and impairments on venture capital and strategic equity investments, net
33,955
(8,788
)
Provision for credit losses
4,559
8,223
(Gain) loss on divestitures, net
(3,376
)
659
Other, net
3,306
8,900
Changes in assets and liabilities:
Trade receivables and contract assets, net
8,106
18,300
Inventories
(45,280
)
13,789
Accounts payable
40,747
(7,095
)
Accrued compensation
81,870
(1,981
)
Deferred revenue
(12,319
)
13,583
Customer contract deposits
(533
)
14,707
Other assets and liabilities, net
(65,282
)
(39,236
)
Net cash provided by operating activities
590,126
575,215
Cash flows relating to investing activities
Capital expenditures
(130,202
)
(157,351
)
Purchases of investments and contributions to venture capital investments
(12,544
)
(45,264
)
Proceeds from sale of investments
5,637
39,470
Proceeds from sale of businesses and assets, net
17,441
—
Acquisition of businesses and assets, net of cash acquired
—
(5,479
)
Other, net
3,154
(358
)
Net cash used in investing activities
(116,514
)
(168,982
)
Cash flows relating to financing activities
Proceeds from long-term debt and revolving credit facility
1,070,861
976,783
Payments on long-term debt, revolving credit facility, and finance lease obligations
(1,141,500
)
(1,316,990
)
Proceeds from exercises of stock options
3
23,110
Purchase of treasury stock
(360,577
)
(119,051
)
Payments of contingent consideration
(21,822
)
—
Purchase of remaining equity interest of other redeemable noncontrolling interests
(19,140
)
(12,000
)
Other, net
(12,687
)
(26,900
)
Net cash used in financing activities
(484,862
)
(475,048
)
Effect of exchange rate changes on cash, cash equivalents, and restricted cash
14,900
(4,025
)
Net change in cash, cash equivalents, and restricted cash
3,650
(72,840
)
Cash, cash equivalents, and restricted cash, beginning of period
205,570
284,480
Cash, cash equivalents, and restricted cash, end of period
$
209,220
$
211,640
CHARLES RIVER LABORATORIES INTERNATIONAL, INC.
SCHEDULE 4
RECONCILIATION OF GAAP TO NON-GAAP
SELECTED BUSINESS SEGMENT INFORMATION (UNAUDITED)(1)
(in thousands, except percentages)
Three Months Ended
Nine Months Ended
September 27, 2025
September 28, 2024
September 27, 2025
September 28, 2024
Research Models and Services
Revenue
$
213,474
$
197,824
$
639,818
$
625,120
Operating income
34,553
27,544
113,944
100,641
Operating income as a % of revenue
16.2
%
13.9
%
17.8
%
16.1
%
Add back:
Amortization related to acquisitions
12,905
9,086
36,266
26,731
Acquisition, integration, and divestiture-related adjustments (3)
—
—
14
337
Severance
136
2,651
3,664
3,685
Asset impairment
4,635
1,266
7,458
14,909
Site consolidation charges
1,053
1,052
3,545
3,983
Total non-GAAP adjustments to operating income
$
18,729
$
14,055
$
50,947
$
49,645
Operating income, excluding non-GAAP adjustments
$
53,282
$
41,599
$
164,891
$
150,286
Non-GAAP operating income as a % of revenue
25.0
%
21.0
%
25.8
%
24.0
%
Depreciation and amortization
$
21,939
$
18,389
$
63,410
$
53,050
Capital expenditures
$
3,173
$
7,186
$
14,099
$
36,543
Discovery and Safety Assessment
Revenue
$
600,685
$
615,060
$
1,811,323
$
1,847,931
Operating income
123,153
126,436
339,886
379,651
Operating income as a % of revenue
20.5
%
20.6
%
18.8
%
20.5
%
Add back:
Amortization related to acquisitions
19,198
19,818
55,581
58,712
Acquisition, integration, and divestiture-related adjustments (3)
2,407
1,714
4,755
7,497
Severance
(148
)
12,550
5,068
20,463
Asset impairment
693
552
22,390
1,064
Site consolidation charges
3,985
772
10,690
2,604
Third-party legal and advisory costs and certain related items(4)
3,242
6,713
25,029
11,014
Total non-GAAP adjustments to operating income
$
29,377
$
42,119
$
123,513
$
101,354
Operating income, excluding non-GAAP adjustments
$
152,530
$
168,555
$
463,399
$
481,005
Non-GAAP operating income as a % of revenue
25.4
%
27.4
%
25.6
%
26.0
%
Depreciation and amortization
$
44,001
$
47,751
$
128,660
$
141,269
Capital expenditures
$
25,709
$
22,773
$
78,730
$
91,176
Manufacturing Solutions
Revenue
$
190,693
$
196,879
$
570,014
$
574,389
Operating income
39,926
40,188
43,367
111,099
Operating income as a % of revenue
20.9
%
20.4
%
7.6
%
19.3
%
Add back:
Amortization related to acquisitions (2)
8,265
10,802
100,675
32,363
Acquisition, integration, and divestiture-related adjustments (3)
—
143
—
1,386
Severance
1,281
4,892
3,102
8,086
Asset impairment
91
—
6,449
25
Site consolidation charges
1,263
502
4,239
1,567
Total non-GAAP adjustments to operating income
$
10,900
$
16,339
$
114,465
$
43,427
Operating income, excluding non-GAAP adjustments
$
50,826
$
56,527
$
157,832
$
154,526
Non-GAAP operating income as a % of revenue
26.7
%
28.7
%
27.7
%
26.9
%
Depreciation and amortization
$
17,377
$
20,298
$
127,343
$
60,176
Capital expenditures
$
5,191
$
8,735
$
33,631
$
28,180
Unallocated Corporate Overhead
$
(63,833
)
$
(76,763
)
$
(188,595
)
$
(196,357
)
Add back:
Acquisition, integration, and divestiture-related adjustments (3)
772
4,082
3,663
7,719
Severance
3,527
6,443
5,103
9,237
Asset impairment
—
—
184
—
Site consolidation charges
767
—
1,436
—
Third-party legal and advisory costs (4)
(146
)
—
6,230
—
Total non-GAAP adjustments to operating expense
$
4,920
$
10,525
$
16,616
$
16,956
Unallocated corporate overhead, excluding non-GAAP adjustments
$
(58,913
)
$
(66,238
)
$
(171,979
)
$
(179,401
)
Total
Revenue
$
1,004,852
$
1,009,763
$
3,021,155
$
3,047,440
Operating income
133,799
117,405
308,602
395,034
Operating income as a % of revenue
13.3
%
11.6
%
10.2
%
13.0
%
Add back:
Amortization related to acquisitions (2)
40,368
39,706
192,522
117,806
Acquisition, integration, and divestiture-related adjustments (3)
3,179
5,939
8,432
16,939
Severance
4,796
26,536
16,937
41,471
Asset impairment
5,419
1,818
36,481
15,998
Site consolidation charges
7,068
2,326
19,910
8,154
Third-party legal and advisory costs and certain related items(4)
3,096
6,713
31,259
11,014
Total non-GAAP adjustments to operating income
$
63,926
$
83,038
$
305,541
$
211,382
Operating income, excluding non-GAAP adjustments
$
197,725
$
200,443
$
614,143
$
606,416
Non-GAAP operating income as a % of revenue
19.7
%
19.9
%
20.3
%
19.9
%
Depreciation and amortization
$
85,164
$
88,198
$
325,035
$
259,637
Capital expenditures
$
35,580
$
38,721
$
130,202
$
157,351
(1)
Charles River management believes that supplementary non-GAAP financial measures provide useful information to allow investors to gain a meaningful understanding of our core operating results and future prospects, without the effect of often-one-time charges and other items which are outside our normal operations, consistent with the manner in which management measures and forecasts the Company’s performance. The supplementary non-GAAP financial measures included are not meant to be considered superior to, or a substitute for results of operations prepared in accordance with U.S. GAAP. The Company intends to continue to assess the potential value of reporting non-GAAP results consistent with applicable rules, regulations and guidance.
(2)
Amortization related to acquisitions for the nine months ended September 27, 2025 includes $71.0 million of accelerated amortization of certain client relationships in the Biologics Solutions reporting unit within the Manufacturing Solutions segment.
(3)
These adjustments are related to the evaluation and integration of acquisitions and divestitures, and primarily include transaction, advisory, certain third-party integration, certain compensation costs, and related costs; as well as fair value adjustments associated with contingent consideration arrangements.
(4)
Third-party legal and advisory costs incurred within Unallocated Corporate are associated with the execution of the Cooperation Agreement with a shareholder. Within our DSA business, third-party legal costs incurred are associated with investigations by the U.S. government into the NHP supply chain. Additionally included within DSA, due to the utilization of NHPs, are reductions to the previous $27 million inventory charge incurred during fiscal 2024, to write down inventory associated with the Cambodia-sourced non-human primate matter from February 16, 2023, as a result of the cases being closed during fiscal 2025.
CHARLES RIVER LABORATORIES INTERNATIONAL, INC.
SCHEDULE 5
RECONCILIATION OF GAAP EARNINGS TO NON-GAAP EARNINGS (UNAUDITED)(1)
(in thousands, except per share data)
Three Months Ended
Nine Months Ended
September 27, 2025
September 28, 2024
September 27, 2025
September 28, 2024
Net income available to Charles River Laboratories International, Inc. common shareholders
$
54,422
$
68,679
$
132,217
$
225,996
Add back:
Adjustment of redeemable noncontrolling interest (2)
—
379
—
1,081
Incremental dividends attributable to noncontrolling interest holders (3)
—
599
—
9,621
Non-GAAP adjustments to operating income (4)
62,632
82,315
302,104
209,332
Venture capital and strategic equity investment (gains) losses and impairments, net
20,201
(2,507
)
31,594
(9,171
)
(Gain) loss on divestitures (5)
—
—
(3,376
)
658
Tax effect of non-GAAP adjustments:
Non-cash tax provision related to international financing structure (6)
—
292
—
1,504
Enacted tax law changes
3,236
3,596
3,236
3,596
Tax effect of the remaining non-GAAP adjustments
(20,148
)
(19,608
)
(72,330
)
(46,323
)
Net income available to Charles River Laboratories International, Inc. common shareholders, excluding non-GAAP adjustments
$
120,343
$
133,745
$
393,445
$
396,294
Weighted average shares outstanding - Basic
49,213
51,394
49,680
51,461
Effect of dilutive securities:
Stock options, restricted stock units and performance share units
213
189
186
252
Weighted average shares outstanding - Diluted
49,426
51,583
49,866
51,713
Earnings per share attributable to common shareholders:
Basic
$
1.11
$
1.34
$
2.66
$
4.39
Diluted
$
1.10
$
1.33
$
2.65
$
4.37
Basic, excluding non-GAAP adjustments
$
2.45
$
2.60
$
7.92
$
7.70
Diluted, excluding non-GAAP adjustments
$
2.43
$
2.59
$
7.89
$
7.66
(1)
Charles River management believes that supplementary non-GAAP financial measures provide useful information to allow investors to gain a meaningful understanding of our core operating results and future prospects, without the effect of often-one-time charges and other items which are outside our normal operations, consistent with the manner in which management measures and forecasts the Company’s performance. The supplementary non-GAAP financial measures included are not meant to be considered superior to, or a substitute for results of operations prepared in accordance with U.S. GAAP. The Company intends to continue to assess the potential value of reporting non-GAAP results consistent with applicable rules, regulations and guidance.
(2)
This amount represents accretion adjustments of the Noveprim redeemable noncontrolling interest.
(3)
This amount represents incremental declared dividends attributable to Noveprim noncontrolling interest holders who receive preferential dividends for fiscal year 2024.
(4)
This amount excludes non-GAAP adjustments attributable to noncontrolling interest holders.
(5)
The amount included in 2025 relates to a gain on the sale of a DSA site while the amount included in 2024 relates to a loss on the sale of a DSA site.
(6)
This amount relates to the recognition of deferred tax assets expected to be utilized as a result of changes to the Company's international financing structure.
CHARLES RIVER LABORATORIES INTERNATIONAL, INC.
SCHEDULE 6
RECONCILIATION OF GAAP REVENUE GROWTH
TO NON-GAAP REVENUE GROWTH, ORGANIC (UNAUDITED) (1)
Three Months Ended September 27, 2025
Total CRL
RMS Segment
DSA Segment
MS Segment
Revenue growth, reported
(0.5
)%
7.9
%
(2.3
)%
(3.1
)%
(Increase) decrease due to foreign exchange
(1.3
)%
(1.4
)%
(1.2
)%
(2.0
)%
Impact of divestitures (2)
0.2
%
—
%
0.4
%
—
%
Non-GAAP revenue growth, organic (3)
(1.6
)%
6.5
%
(3.1
)%
(5.1
)%
Nine Months Ended September 27, 2025
Total CRL
RMS Segment
DSA Segment
MS Segment
Revenue growth, reported
(0.9
)%
2.4
%
(2.0
)%
(0.8
)%
(Increase) decrease due to foreign exchange
(0.5
)%
(0.5
)%
(0.5
)%
(0.7
)%
Impact of divestitures (2)
0.1
%
—
%
0.2
%
—
%
Non-GAAP revenue growth, organic (3)
(1.3
)%
1.9
%
(2.3
)%
(1.5
)%
(1)
Charles River management believes that supplementary non-GAAP financial measures provide useful information to allow investors to gain a meaningful understanding of our core operating results and future prospects, without the effect of often-one-time charges and other items which are outside our normal operations, consistent with the manner in which management measures and forecasts the Company’s performance. The supplementary non-GAAP financial measures included are not meant to be considered superior to, or a substitute for results of operations prepared in accordance with U.S. GAAP. The Company intends to continue to assess the potential value of reporting non-GAAP results consistent with applicable rules, regulations and guidance.
(2)
Impact of divestitures relates to the sale of a site within DSA.
(3)
Organic revenue growth is defined as reported revenue growth adjusted for divestitures and foreign exchange.
财报
2024-12-05
WILMINGTON, Mass.--(
BUSINESS WIRE
)--Charles River Laboratories International, Inc. (NYSE: CRL) today announced the launch of the Charles River Incubator Program (CIP), specializing in supporting early-stage biotechnology companies in the discovery, development and phase-appropriate manufacturing of advanced therapies.
“The Charles River Incubator Program launch, through our Global Innovation Center of Excellence, demonstrates a continued commitment to the global biotechnology industry by offering knowledge, connectivity, and priority access to the Charles River portfolio,” said Kerstin Dolph, Corporate Senior Vice President, Global Manufacturing, Charles River.
Building on the success of the Company’s established global
Cell and Gene Therapy (CGT) Accelerator Program
(CAP), the CIP focuses on nurturing innovative start-up and early-stage biotechnology companies. The objective of the CIP is to form a strong foundation for commercial viability as its participants gain momentum with the goal of imparting cost-effective, consultative regulatory and quality expertise, personnel training initiatives, and enabling access to laboratory space and equipment. Developers are invited to
apply
to be part of the next cohort today:
CIP
– Incubates biotechnology developers in the discovery phase, 24+ months from Investigational New Drug (IND) or Clinical Trial Application (CTA) submission.
CAP
– Accelerates advanced therapy developers 18-24 months from IND or CTA submission.
Leveraging a Concept to Cure Portfolio
The CIP and CAP are reinforced by the Company’s Global Innovation Center of Excellence (CoE), strategically positioned and fully integrated at the heart of Charles River’s extensive virtual and physical network. The Global Innovation CoE amalgamates a cross-functional team of scientific, regulatory and manufacturing experts in:
Drug Discovery
Safety Assessment
Research Models
Clinical to Commercial Contract Development and Manufacturing
Microbial Solutions
Based out of the Company’s contract development and manufacturing organization (CDMO) CoE located in the
Alderley Park
campus, the UK’s largest, single-site life science ecosystem, the Global Innovation CoE is geared to foster and accelerate life sciences innovation, with enhanced access to life sciences and biotechnology experts.
In alignment with the Company’s strategic areas of interest and commitment to driving innovation, the applicant selection process remains at the discretion of Charles River and the next cohort shortlist will be identified in conjunction with the upcoming
Cell and Gene Therapy Summit
, March 4, 2025, in San Francisco, CA.
Our Experts: An Extension of Your Team
Bolstering its concept to cure capabilities, Charles River is proud to showcase a
world-class team of scientific experts
across the drug development continuum, providing broad experience and consultative advice.
With distinguished operational, quality, and regulatory experts including previous FDA, EMA, and MHRA advisors, the integrated network of Charles River professionals has supported thousands of IND and CTA submissions, reducing overall risk and setting programs up for success.
Meet with a Charles River expert at Advanced Therapies Week, January 20-23, 2025, in Dallas, TX to discuss the Global Innovation CoE, CIP, and how our cross-functional team and fit-for purpose facilities can support your program from concept to cure. Schedule a meeting:
https://bit.ly/3ZjKKla
About Charles River
Charles River provides essential products and services to help pharmaceutical and biotechnology companies, government agencies and leading academic institutions around the globe accelerate their research and drug development efforts. Our dedicated employees are focused on providing clients with exactly what they need to improve and expedite the discovery, early-stage development and safe manufacture of new therapies for the patients who need them. To learn more about our unique portfolio and breadth of services, visit
www.criver.com
.
临床研究
2024-08-07
WILMINGTON, Mass.--(
BUSINESS WIRE
)--Charles River Laboratories International, Inc. (NYSE: CRL) today reported its results for the second quarter of 2024. For the quarter, revenue was $1.03 billion, a decrease of 3.2% from $1.06 billion in the second quarter of 2023.
The impact of foreign currency translation reduced reported revenue by 0.3%, a divestiture reduced reported revenue by 0.2%, and an acquisition contributed 0.5% to consolidated second-quarter revenue. Excluding the effect of these items, revenue also declined 3.2% on an organic basis. On a segment basis, organic revenue growth in the Manufacturing Solutions (Manufacturing) segment was more than offset by lower revenue in the Discovery and Safety Assessment (DSA) and Research Models and Services (RMS) segments.
In the second quarter of 2024, the GAAP operating margin decreased to 14.8% from 15.6% in the second quarter of 2023. This GAAP decrease was primarily driven by lower operating margins in the RMS and DSA segments, due in part to costs associated with the Company’s restructuring initiatives. On a non-GAAP basis, the second-quarter operating margin increased to 21.3% from 20.4%, driven primarily by lower performance-based compensation accruals, as well as operating margin improvement in the Manufacturing segment.
On a GAAP basis, second-quarter net income attributable to common shareholders was $90.0 million, a decrease of 7.2% from $97.0 million for the same period in 2023. Second-quarter diluted earnings per share on a GAAP basis were $1.74, a decrease of 7.9% from $1.89 for the second quarter of 2023. The GAAP net income and earnings per share decreases were driven primarily by lower revenue and operating income, which included higher costs associated with the Company’s restructuring initiatives. On a non-GAAP basis, net income was $144.9 million for the second quarter of 2024, an increase of 4.8% from $138.3 million for the same period in 2023. Second-quarter diluted earnings per share on a non-GAAP basis were $2.80, an increase of 4.1% from $2.69 per share for the second quarter of 2024. The increases in non-GAAP net income and earnings per share were driven primarily by lower performance-based compensation accruals, as well as higher revenue and operating income in the Manufacturing segment.
James C. Foster, Chair, President and Chief Executive Officer, said, “
Our financial performance through the first half of this year has been largely in line with our initial outlook; however, forward-looking DSA trends suggest that demand will not improve during the second half of the year as we had previously anticipated, and in fact, will decline for global biopharmaceutical clients. This has caused us to take a much more negative view of our growth prospects for the second half of the year. We believe that our clients are currently more focused on reassessing their budgets and reprioritizing their pipelines, but continue to view strategic outsourcing as a compelling solution to improve their cost efficiency and speed to market, presenting a longer-term opportunity for us.”
“
Therefore, it is imperative for us to navigate through this period of softer demand by aggressively managing our cost structure, initiating new and innovative ways to transform our business, being disciplined with our investments, and enhancing our commercial efforts to win new business. We firmly believe that our clients will continue to seek life-saving treatments for rare diseases and other unmet medical needs, which drives us to take further steps to position Charles River for the future. These steps will enable us to emerge as a stronger, leaner partner to help our clients achieve their goals by utilizing our scientific expertise and flexible solutions,” Mr. Foster concluded.
Second-Quarter Segment Results
Research Models and Services (RMS)
Revenue for the RMS segment was $206.4 million in the second quarter of 2024, a decrease of 1.7% from $209.9 million in the second quarter of 2023. The Noveprim acquisition in November 2023 contributed 2.7% to second-quarter RMS reported revenue, and the impact of foreign currency translation reduced revenue by 0.5%. Organic revenue decreased by 3.9%, due primarily to lower revenue for non-human primates (NHPs) in China. In addition, lower revenue for research model services and the Cell Solutions business also contributed to the decline. The decline was partially offset by higher sales of small research models, particularly in Europe and China.
In the second quarter of 2024, the RMS segment’s GAAP operating margin decreased to 14.5% from 23.3% in the second quarter of 2023. On a non-GAAP basis, the operating margin decreased to 23.1% from 26.4%. The GAAP and non-GAAP operating margin declines were driven primarily by lower NHP revenue. On a GAAP basis, the lower operating margin also reflects higher costs associated with the Company’s restructuring initiatives, including site consolidation costs related to the Company’s CRADL operations in California.
Discovery and Safety Assessment (DSA)
Revenue for the DSA segment was $627.4 million in the second quarter of 2024, a decrease of 5.4% from $663.5 million in the second quarter of 2023. A divestiture of a small Safety Assessment site reduced reported revenue by 0.3% and the impact of foreign currency translation reduced DSA revenue by 0.1%. Organic revenue decreased by 5.0%, driven by lower revenue in the Discovery Services and Safety Assessment businesses.
In the second quarter of 2024, the DSA segment’s GAAP operating margin decreased to 22.1% from 24.3% in the second quarter of 2023. On a non-GAAP basis, the operating margin decreased to 27.1% from 27.6% in the second quarter of 2023. The GAAP and non-GAAP operating margin decreases were driven primarily by the impact of lower sales volume, partially offset by lower performance-based compensation accruals. On a GAAP basis, the lower operating margin also reflects higher costs associated with the Company’s restructuring initiatives, as well as higher acquisition-related adjustments associated with Noveprim.
Manufacturing Solutions (Manufacturing)
Revenue for the Manufacturing segment was $192.3 million in the second quarter of 2024, an increase of 3.1% from $186.5 million in the second quarter of 2023. The impact of foreign currency translation reduced Manufacturing revenue by 0.6%. Organic revenue growth of 3.7% reflected higher revenue across all of the segment’s businesses.
In the second quarter of 2024, the Manufacturing segment’s GAAP operating margin increased to 19.4% from 13.1% in the second quarter of 2023, and on a non-GAAP basis, the operating margin increased to 26.6%, from 22.9% in the second quarter of 2023. The GAAP and non-GAAP operating margin increases were driven primarily by improved profitability for each of segment’s businesses. On a GAAP basis, lower third-party legal costs related to the Microbial Solutions business and lower acquisition-related adjustments also contributed to the increase.
New Stock Repurchase Authorization
The Company’s Board of Directors has approved a new stock repurchase authorization of $1.0 billion. This new authorization replaces a prior stock repurchase authorization of $1.3 billion that had $129.1 million remaining on the plan when it was terminated.
Revises 2024 Guidance
The Company is revising its financial guidance for 2024, which was previously updated on May 9, 2024. The reduced guidance primarily reflects the lack of a recovery in demand from our small and mid-sized biotechnology clients in the second half of the year, as well as softer demand trends from global biopharmaceutical clients whose deterioration has become increasingly evident in the past couple of months. As a result, the Company no longer expects that overall demand trends will improve during the second half of the year. In particular, these trends will have a meaningful impact on the outlook for the DSA segment. The Company is implementing restructuring initiatives that are expected to result in annualized cost savings of over $150 million (inclusive of actions implemented last year through the third quarter of 2024), of which approximately $100 million will be realized in 2024.
The Company’s 2024 guidance for revenue growth and earnings per share is as follows:
2024 GUIDANCE
CURRENT
PRIOR
Revenue growth/(decrease), reported
(4.5)% – (2.5)%
1.0% – 4.0%
Impact of divestitures/(acquisitions), net
~(0.5)%
~(0.5)%
(Favorable)/unfavorable impact of foreign exchange
--
~(0.5)%
Revenue growth/(decrease), organic (1)
(5.0)% – (3.0)%
0.0% – 3.0%
GAAP EPS estimate
$5.65 – $5.95
$7.60 – $8.10
Acquisition-related amortization (2)
~$2.75
~$2.50
Acquisition and integration-related adjustments (3)
~$0.20
~$0.10
Costs associated with restructuring actions (4)
~$1.00
~$0.35
Certain venture capital and other strategic investment losses/(gains), net (5)
($0.14)
($0.08)
Incremental dividends related to Noveprim (6)
~$0.25
~$0.25
Other items (7)
~$0.20
~$0.20
Non-GAAP EPS estimate
$9.90 – $10.20
$10.90 – $11.40
Footnotes to Guidance Table:
(1) Organic revenue growth is defined as reported revenue growth adjusted for completed acquisitions and divestitures, as well as foreign currency translation.
(2) These adjustments include amortization related to intangible assets, as well as the purchase accounting step-up on inventory and certain long-term biological assets.
(3) These adjustments are related to the evaluation and integration of acquisitions and divestitures, and primarily include transaction, advisory, certain third-party integration, and related costs; as well as fair value adjustments associated with contingent consideration arrangements.
(4) These adjustments primarily include site consolidation, severance, impairment, and other costs related to the Company’s restructuring actions.
(5) Certain venture capital and other strategic investment performance only includes recognized gains or losses on certain investments. The Company does not forecast the future performance of these investments.
(6) This item primarily relates to incremental dividends attributable to Noveprim noncontrolling interest holders who may receive preferential dividends for fiscal year 2024.
(7) These items primarily relate to (i) certain third-party legal costs related to investigations by the U.S. government into the NHP supply chain related to our Safety Assessment business; and (ii) charges associated with U.S. and international tax legislation that necessitated changes to the Company’s international financing structure.
Webcast
Charles River has scheduled a live webcast on Wednesday, August 7
th
, at 9:00 a.m. ET to discuss matters relating to this press release. To participate, please go to
ir.criver.com
and select the webcast link. You can also find the associated slide presentation and reconciliations of GAAP financial measures to non-GAAP financial measures on the website.
Non-GAAP Reconciliations
The Company reports non-GAAP results in this press release, which exclude often-one-time charges and other items that are outside of normal operations. A reconciliation of GAAP to non-GAAP results is provided in the schedules at the end of this press release.
Use of Non-GAAP Financial Measures
This press release contains non-GAAP financial measures, such as non-GAAP earnings per diluted share, non-GAAP operating income, non-GAAP operating margin, and non-GAAP net income. Non-GAAP financial measures exclude, but are not limited to, the amortization of intangible assets and the purchase accounting step-up adjustment on inventory and certain long term biological assets, and other charges and adjustments related to our acquisitions and divestitures, including incremental dividends attributable to Noveprim noncontrolling interest holders and the gain on our sale of our Avian Vaccine business; expenses associated with evaluating and integrating acquisitions and divestitures, including advisory fees and certain other transaction-related costs, as well as fair value adjustments associated with contingent consideration; charges, gains, and losses attributable to businesses or properties we plan to close, consolidate, or divest; severance and other costs associated with our restructuring initiatives; the write-off of deferred financing costs and fees related to debt financing; investment gains or losses associated with our venture capital and other strategic equity investments; certain legal costs in our Microbial Solutions business related to environmental litigation and in our Safety Assessment business related to U.S. government investigations into the NHP supply chain; tax effect of all of the aforementioned matters; and adjustments related to the recognition of deferred tax assets expected to be utilized as a result of changes to the our international financing structure and the revaluation of deferred tax liabilities as a result of foreign tax legislation. This press release also refers to our revenue on both a GAAP and non-GAAP basis: “organic revenue growth,” which we define as reported revenue growth adjusted for foreign currency translation, acquisitions, and divestitures. We exclude these items from the non-GAAP financial measures because they are outside our normal operations. There are limitations in using non-GAAP financial measures, as they are not presented in accordance with generally accepted accounting principles, and may be different than non-GAAP financial measures used by other companies. In particular, we believe that the inclusion of supplementary non-GAAP financial measures in this press release helps investors to gain a meaningful understanding of our core operating results and future prospects without the effect of these often-one-time charges, and is consistent with how management measures and forecasts the Company's performance, especially when comparing such results to prior periods or forecasts. We believe that the financial impact of our acquisitions and divestitures (and in certain cases, the evaluation of such acquisitions and divestitures, whether or not ultimately consummated) is often large relative to our overall financial performance, which can adversely affect the comparability of our results on a period-to-period basis. In addition, certain activities and their underlying associated costs, such as business acquisitions, generally occur periodically but on an unpredictable basis. We calculate non-GAAP integration costs to include third-party integration costs incurred post-acquisition. Presenting revenue on an organic basis allows investors to measure our revenue growth exclusive of acquisitions, divestitures, and foreign currency exchange fluctuations more clearly. Non-GAAP results also allow investors to compare the Company’s operations against the financial results of other companies in the industry who similarly provide non-GAAP results. The non-GAAP financial measures included in this press release are not meant to be considered superior to or a substitute for results of operations presented in accordance with GAAP. The Company intends to continue to assess the potential value of reporting non-GAAP results consistent with applicable rules and regulations. Reconciliations of the non-GAAP financial measures used in this press release to the most directly comparable GAAP financial measures are set forth in this press release, and can also be found on the Company’s website at
ir.criver.com
.
Caution Concerning Forward-Looking Statements
This press release includes forward-looking statements within the meaning of the Private Securities Litigation Reform Act of 1995. Forward-looking statements may be identified by the use of words such as “anticipate,” “believe,” “expect,” “intend,” “will,” “would,” “may,” “estimate,” “plan,” “outlook,” and “project,” and other similar expressions that predict or indicate future events or trends or that are not statements of historical matters. These statements also include statements regarding Charles River’s expectations regarding the availability of Cambodia-sourced NHPs; the impact of the investigations by the U.S. government into the Cambodia NHP supply chain, including but not limited to Charles River’s ability to cooperate fully with the U.S. government; Charles River’s ability to effectively manage any Cambodia NHP supply impact; the projected future financial performance of Charles River and our specific businesses, including our expectations with respect to the impact of NHP supply constraints and our ability to gain market share; earnings per share; operating margin; client demand, particularly the future demand for drug discovery and development products and services, including our expectations for future revenue trends; our expectations with respect to pricing of our products and services; our expectations with respect to future tax rates and the impact of such tax rates on our business; our expectations with respect to the impact of acquisitions and divestitures completed in 2021, 2022, and 2023, including the Noveprim acquisition, on the Company, our service offerings, client perception, strategic relationships, revenue, revenue growth rates, revenue growth drivers, and earnings; the development and performance of our services and products, including our investments in our portfolio; market and industry conditions including the outsourcing of services and identification of spending trends by our clients and funding available to them; ability to gain market share and capitalize on business opportunities; the impact of our restructuring initiatives, including annualized savings; the impact of our stock repurchase authorization; and Charles River’s future performance as delineated in our forward-looking guidance, and particularly our expectations with respect to revenue, the impact of foreign exchange, interest rates, enhanced efficiency initiatives. Forward-looking statements are based on Charles River’s current expectations and beliefs, and involve a number of risks and uncertainties that are difficult to predict and that could cause actual results to differ materially from those stated or implied by the forward-looking statements. Those risks and uncertainties include, but are not limited to: NHP supply constraints and the investigations by the U.S. Department of Justice, including the impact on our projected future financial performance, the timing of the resumption of Cambodia NHP imports into the U.S., our ability to manage supply impact, and potential study delays in our Safety Assessment business attributable to NHP supply constraints; changes and uncertainties in the global economy and financial markets; the ability to successfully integrate businesses we acquire, including Noveprim; the timing and magnitude of our share repurchases; negative trends in research and development spending, negative trends in the level of outsourced services, or other cost reduction actions by our clients; the ability to convert backlog to revenue; special interest groups; contaminations; industry trends; new displacement technologies; USDA and FDA regulations; changes in law; continued availability of products and supplies; loss of key personnel; interest rate and foreign currency exchange rate fluctuations; changes in tax regulation and laws; changes in generally accepted accounting principles; disruptions in the global economy caused by geopolitical conflicts; and any changes in business, political, or economic conditions due to the threat of future terrorist activity in the U.S. and other parts of the world, and related U.S. military action overseas. A further description of these risks, uncertainties, and other matters can be found in the Risk Factors detailed in Charles River's Annual Report on Form 10-K as filed on February 14, 2024, as well as other filings we make with the Securities and Exchange Commission. Because forward-looking statements involve risks and uncertainties, actual results and events may differ materially from results and events currently expected by Charles River, and Charles River assumes no obligation and expressly disclaims any duty to update information contained in this press release except as required by law.
About Charles River
Charles River provides essential products and services to help pharmaceutical and biotechnology companies, government agencies and leading academic institutions around the globe accelerate their research and drug development efforts. Our dedicated employees are focused on providing clients with exactly what they need to improve and expedite the discovery, early-stage development and safe manufacture of new therapies for the patients who need them. To learn more about our unique portfolio and breadth of services, visit
www.criver.com
.
CHARLES RIVER LABORATORIES INTERNATIONAL, INC.
SCHEDULE 1
CONDENSED CONSOLIDATED STATEMENTS OF INCOME (UNAUDITED)
(in thousands, except for per share data)
Three Months Ended
Six Months Ended
June 29, 2024
July 1, 2023
June 29, 2024
July 1, 2023
Service revenue
$
842,900
$
874,891
$
1,659,762
$
1,732,257
Product revenue
183,217
185,046
377,915
357,053
Total revenue
1,026,117
1,059,937
2,037,677
2,089,310
Costs and expenses:
Cost of services provided (excluding amortization of intangible assets)
577,383
578,099
1,155,547
1,143,576
Cost of products sold (excluding amortization of intangible assets)
95,021
82,861
183,574
169,103
Selling, general and administrative
169,791
199,758
356,082
374,604
Amortization of intangible assets
32,270
34,274
64,845
69,190
Operating income
151,652
164,945
277,629
332,837
Other income (expense):
Interest income
3,010
1,426
5,212
2,232
Interest expense
(32,769
)
(35,044
)
(67,770
)
(69,424
)
Other income (expense), net
(2,240
)
(2,663
)
3,593
(5,940
)
Income before income taxes
119,653
128,664
218,664
259,705
Provision for income taxes
25,392
29,221
49,921
56,308
Net income
94,261
99,443
168,743
203,397
Less: Net income attributable to noncontrolling interests
180
2,423
1,702
3,246
Net income available to Charles River Laboratories International, Inc.
$
94,081
$
97,020
$
167,041
$
200,151
Calculation of net income per share attributable to common shareholders of Charles River Laboratories International, Inc.
Net income available to Charles River Laboratories International, Inc.
$
94,081
$
97,020
$
167,041
$
200,151
Less: Adjustment of redeemable noncontrolling interest
301
—
702
—
Less: Incremental dividends attributable to noncontrolling interest holders
3,792
—
9,022
—
Net income available to Charles River Laboratories International, Inc. common shareholders
$
89,988
$
97,020
$
157,317
$
200,151
Earnings per common share
Net income attributable to common shareholders:
Basic
$
1.75
$
1.89
$
3.06
$
3.91
Diluted
$
1.74
$
1.89
$
3.04
$
3.90
Weighted-average number of common shares outstanding:
Basic
51,551
51,216
51,494
51,157
Diluted
51,846
51,467
51,810
51,382
CHARLES RIVER LABORATORIES INTERNATIONAL, INC.
SCHEDULE 2
CONDENSED CONSOLIDATED BALANCE SHEETS (UNAUDITED)
(in thousands, except per share amounts)
June 29, 2024
December 30, 2023
Assets
Current assets:
Cash and cash equivalents
$
179,213
$
276,771
Trade receivables and contract assets, net of allowances for credit losses of $24,951 and $25,722, respectively
762,221
780,375
Inventories
349,111
380,259
Prepaid assets
97,892
87,879
Other current assets
110,836
83,378
Total current assets
1,499,273
1,608,662
Property, plant and equipment, net
1,613,895
1,639,741
Venture capital and strategic equity investments
231,859
243,811
Operating lease right-of-use assets, net
386,147
394,029
Goodwill
3,079,693
3,095,045
Intangible assets, net
800,129
864,051
Deferred tax assets
36,109
40,279
Other assets
301,178
309,383
Total assets
$
7,948,283
$
8,195,001
Liabilities, Redeemable Noncontrolling Interests and Equity
Current liabilities:
Accounts payable
$
133,101
$
168,937
Accrued compensation
176,667
213,290
Deferred revenue
247,177
241,820
Accrued liabilities
192,156
227,825
Other current liabilities
198,418
203,210
Total current liabilities
947,519
1,055,082
Long-term debt, net and finance leases
2,409,380
2,647,147
Operating lease right-of-use liabilities
428,587
419,234
Deferred tax liabilities
165,183
191,349
Other long-term liabilities
224,520
223,191
Total liabilities
4,175,189
4,536,003
Redeemable noncontrolling interest
46,076
56,722
Equity:
Preferred stock, $0.01 par value; 20,000 shares authorized; no shares issued and outstanding
—
—
Common stock, $0.01 par value; 120,000 shares authorized; 51,696 shares issued and 51,613 shares outstanding as of June 29, 2024, and 51,338 shares issued and outstanding as of December 30, 2023
517
513
Additional paid-in capital
1,956,629
1,905,578
Retained earnings
2,053,557
1,887,218
Treasury stock, at cost, 83 and zero shares, as of June 29, 2024 and December 30, 2023, respectively
(18,265
)
—
Accumulated other comprehensive loss
(269,709
)
(196,427
)
Total Charles River Laboratories International, Inc. equity
3,722,729
3,596,882
Nonredeemable noncontrolling interests
4,289
5,394
Total equity
3,727,018
3,602,276
Total liabilities, equity and noncontrolling interests
$
7,948,283
$
8,195,001
CHARLES RIVER LABORATORIES INTERNATIONAL, INC.
SCHEDULE 3
CONDENSED CONSOLIDATED STATEMENTS OF CASH FLOWS (UNAUDITED)
(in thousands)
Six Months Ended
June 29, 2024
July 1, 2023
Cash flows relating to operating activities
Net income
$
168,743
$
203,397
Adjustments to reconcile net income to net cash provided by operating activities:
Depreciation and amortization
171,439
154,740
Stock-based compensation
33,325
29,730
Deferred income taxes
(13,073
)
(16,555
)
Long-lived asset impairment charges
14,250
10,453
(Gain) loss on venture capital & strategic equity investments, net
(6,305
)
5,176
Provision for credit losses
4,719
9,849
Loss on divestitures, net
659
563
Other, net
9,090
3,229
Changes in assets and liabilities:
Trade receivables and contract assets, net
1,072
(48,249
)
Inventories
9,750
(32,671
)
Accounts payable
(6,436
)
(24,985
)
Accrued compensation
(33,153
)
(7,648
)
Deferred revenue
8,151
(6,796
)
Customer contract deposits
7,849
(17,519
)
Other assets and liabilities, net
(46,657
)
(5,209
)
Net cash provided by operating activities
323,423
257,505
Cash flows relating to investing activities
Acquisition of businesses and assets, net of cash acquired
(5,479
)
(50,166
)
Capital expenditures
(118,630
)
(174,258
)
Purchases of investments and contributions to venture capital investments
(35,538
)
(22,689
)
Proceeds from sale of investments
12,359
2,943
Other, net
(370
)
(1,057
)
Net cash used in investing activities
(147,658
)
(245,227
)
Cash flows relating to financing activities
Proceeds from long-term debt and revolving credit facility
741,200
281,796
Proceeds from exercises of stock options
22,331
15,719
Payments on long-term debt, revolving credit facility, and finance lease obligations
(987,344
)
(317,049
)
Purchase of treasury stock
(18,265
)
(23,978
)
Payments of contingent consideration
—
(2,711
)
Purchases of additional equity interests, net
(12,000
)
—
Other, net
(13,434
)
—
Net cash provided by financing activities
(267,512
)
(46,223
)
Effect of exchange rate changes on cash, cash equivalents, and restricted cash
(11,729
)
1,508
Net change in cash, cash equivalents, and restricted cash
(103,476
)
(32,437
)
Cash, cash equivalents, and restricted cash, beginning of period
284,480
241,214
Cash, cash equivalents, and restricted cash, end of period
$
181,004
$
208,777
CHARLES RIVER LABORATORIES INTERNATIONAL, INC.
SCHEDULE 4
RECONCILIATION OF GAAP TO NON-GAAP
SELECTED BUSINESS SEGMENT INFORMATION (UNAUDITED)
(1)
(in thousands, except percentages)
Three Months Ended
Six Months Ended
June 29, 2024
July 1, 2023
June 29, 2024
July 1, 2023
Research Models and Services
Revenue
$
206,389
$
209,948
$
427,296
$
409,714
Operating income
29,948
48,918
73,097
89,327
Operating income as a % of revenue
14.5
%
23.3
%
17.1
%
21.8
%
Add back:
Amortization related to acquisitions
7,357
5,491
17,645
10,985
Acquisition related adjustments
(2)
174
997
337
1,827
Severance
494
—
1,034
—
Site consolidation and impairment charges
9,728
—
16,574
—
Total non-GAAP adjustments to operating income
$
17,753
$
6,488
$
35,590
$
12,812
Operating income, excluding non-GAAP adjustments
$
47,701
$
55,406
$
108,687
$
102,139
Non-GAAP operating income as a % of revenue
23.1
%
26.4
%
25.4
%
24.9
%
Depreciation and amortization
$
16,538
$
13,949
$
34,661
$
27,438
Capital expenditures
$
9,313
$
7,493
$
29,357
$
26,577
Discovery and Safety Assessment
Revenue
$
627,419
$
663,457
$
1,232,871
$
1,325,810
Operating income
138,376
161,538
253,215
332,969
Operating income as a % of revenue
22.1
%
24.3
%
20.5
%
25.1
%
Add back:
Amortization related to acquisitions
20,298
17,744
38,894
35,231
Acquisition related adjustments
(2)
5,591
2,359
5,783
2,603
Severance
2,429
—
7,913
—
Site consolidation and impairment charges
1,337
—
2,344
—
Third-party legal costs
(3)
2,110
1,492
4,301
4,297
Total non-GAAP adjustments to operating income
$
31,765
$
21,595
$
59,235
$
42,131
Operating income, excluding non-GAAP adjustments
$
170,141
$
183,133
$
312,450
$
375,100
Non-GAAP operating income as a % of revenue
27.1
%
27.6
%
25.3
%
28.3
%
Depreciation and amortization
$
47,729
$
43,124
$
93,518
$
85,574
Capital expenditures
$
19,444
$
48,326
$
68,403
$
113,510
Manufacturing Solutions
Revenue
$
192,309
$
186,532
$
377,510
$
353,786
Operating income
37,230
24,403
70,911
26,509
Operating income as a % of revenue
19.4
%
13.1
%
18.8
%
7.5
%
Add back:
Amortization related to acquisitions
10,768
11,125
21,561
23,146
Acquisition related adjustments
(2)
544
2,182
1,243
3,011
Severance
1,671
2,517
3,194
3,433
Site consolidation and impairment charges
990
182
1,090
2,754
Third-party legal costs
(3)
—
2,368
—
6,858
Total non-GAAP adjustments to operating income
$
13,973
$
18,374
$
27,088
$
39,202
Operating income, excluding non-GAAP adjustments
$
51,203
$
42,777
$
97,999
$
65,711
Non-GAAP operating income as a % of revenue
26.6
%
22.9
%
26.0
%
18.6
%
Depreciation and amortization
$
20,073
$
19,523
$
39,878
$
39,607
Capital expenditures
$
10,583
$
10,862
$
19,445
$
32,600
Unallocated Corporate Overhead
$
(53,902
)
$
(69,914
)
$
(119,594
)
$
(115,968
)
Add back:
Acquisition related adjustments
(2)
2,108
4,799
3,637
7,002
Severance
1,304
—
2,794
—
Total non-GAAP adjustments to operating expense
$
3,412
$
4,799
$
6,431
$
7,002
Unallocated corporate overhead, excluding non-GAAP adjustments
$
(50,490
)
$
(65,115
)
$
(113,163
)
$
(108,966
)
Total
Revenue
$
1,026,117
$
1,059,937
$
2,037,677
$
2,089,310
Operating income
151,652
164,945
277,629
332,837
Operating income as a % of revenue
14.8
%
15.6
%
13.6
%
15.9
%
Add back:
Amortization related to acquisitions
38,423
34,360
78,100
69,362
Acquisition related adjustments
(2)
8,417
10,337
11,000
14,443
Severance
5,898
2,517
14,935
3,433
Site consolidation and impairment charges
12,055
182
20,008
2,754
Third-party legal costs
(3)
2,110
3,860
4,301
11,155
Total non-GAAP adjustments to operating income
$
66,903
$
51,256
$
128,344
$
101,147
Operating income, excluding non-GAAP adjustments
$
218,555
$
216,201
$
405,973
$
433,984
Non-GAAP operating income as a % of revenue
21.3
%
20.4
%
19.9
%
20.8
%
Depreciation and amortization
$
86,082
$
77,671
$
171,439
$
154,740
Capital expenditures
$
39,486
$
67,383
$
118,630
$
174,258
(1)
Charles River management believes that supplementary non-GAAP financial measures provide useful information to allow investors to gain a meaningful understanding of our core operating results and future prospects, without the effect of often-one-time charges and other items which are outside our normal operations, consistent with the manner in which management measures and forecasts the Company’s performance. The supplementary non-GAAP financial measures included are not meant to be considered superior to, or a substitute for results of operations prepared in accordance with U.S. GAAP. The Company intends to continue to assess the potential value of reporting non-GAAP results consistent with applicable rules, regulations and guidance.
(2)
These adjustments are related to the evaluation and integration of acquisitions, which primarily include transaction, third-party integration, and certain compensation costs, and fair value adjustments associated with contingent consideration arrangements.
(3)
Third-party legal costs are related to (a) an environmental litigation related to the Microbial Solutions business and (b) investigations by the U.S. government into the NHP supply chain applicable to our Safety Assessment business.
CHARLES RIVER LABORATORIES INTERNATIONAL, INC.
SCHEDULE 5
RECONCILIATION OF GAAP EARNINGS TO NON-GAAP EARNINGS (UNAUDITED)
(1)
(in thousands, except per share data)
Three Months Ended
Six Months Ended
June 29, 2024
July 1, 2023
June 29, 2024
July 1, 2023
Net income available to Charles River Laboratories International, Inc. common shareholders
$
89,988
$
97,020
$
157,317
$
200,151
Add back:
Adjustment of redeemable noncontrolling interest
(2)
301
—
702
—
Incremental dividends attributable to noncontrolling interest holders
(3)
3,792
—
9,022
—
Non-GAAP adjustments to operating income
(4)
65,576
51,256
127,017
101,147
Venture capital and strategic equity investment (gains) losses, net
(902
)
1,873
(6,664
)
5,155
(Gain) loss on divestitures
(5)
—
1,003
658
562
Other
(6)
—
596
—
495
Tax effect of non-GAAP adjustments:
Non-cash tax provision related to international financing structure
(7)
871
1,296
1,212
2,420
Tax effect of the remaining non-GAAP adjustments
(14,687
)
(14,759
)
(26,715
)
(28,658
)
Net income attributable to Charles River Laboratories International, Inc. common shareholders, excluding non-GAAP adjustments
$
144,939
$
138,285
$
262,549
$
281,272
Weighted average shares outstanding - Basic
51,551
51,216
51,494
51,157
Effect of dilutive securities:
Stock options, restricted stock units and performance share units
295
251
316
225
Weighted average shares outstanding - Diluted
51,846
51,467
51,810
51,382
Earnings per share attributable to common shareholders:
Basic
$
1.75
$
1.89
$
3.06
$
3.91
Diluted
$
1.74
$
1.89
$
3.04
$
3.90
Basic, excluding non-GAAP adjustments
$
2.81
$
2.70
$
5.10
$
5.50
Diluted, excluding non-GAAP adjustments
$
2.80
$
2.69
$
5.07
$
5.47
(1)
Charles River management believes that supplementary non-GAAP financial measures provide useful information to allow investors to gain a meaningful understanding of our core operating results and future prospects, without the effect of often-one-time charges and other items which are outside our normal operations, consistent with the manner in which management measures and forecasts the Company’s performance. The supplementary non-GAAP financial measures included are not meant to be considered superior to, or a substitute for results of operations prepared in accordance with U.S. GAAP. The Company intends to continue to assess the potential value of reporting non-GAAP results consistent with applicable rules, regulations and guidance.
(2)
This amount represents accretion adjustments of the Noveprim redeemable noncontrolling interest.
(3)
This amount represents incremental undeclared dividends attributable to Noveprim noncontrolling interest holders who receive preferential dividends for fiscal year 2024.
(4)
This amount excludes Non-GAAP adjustments attributable to noncontrolling interest holders.
(5)
The amount included in 2024 relates to a loss on the sale of a Safety Assessment site. Adjustments included in 2023 relate to the gain on the sale of our Avian Vaccine business, which was divested in 2022.
(6)
Amounts included in 2023 relate to a final adjustment on the termination of a Canadian pension plan.
(7)
This amount relates to the recognition of deferred tax assets expected to be utilized as a result of changes to the Company's international financing structure.
CHARLES RIVER LABORATORIES INTERNATIONAL, INC.
SCHEDULE 6
RECONCILIATION OF GAAP REVENUE GROWTH
TO NON-GAAP REVENUE GROWTH, ORGANIC (UNAUDITED)
(1)
Three Months Ended June 29, 2024
Total CRL
RMS Segment
DSA Segment
MS Segment
Revenue growth, reported
(3.2
)%
(1.7
)%
(5.4
)%
3.1
%
(Increase) decrease due to foreign exchange
0.3
%
0.5
%
0.1
%
0.6
%
Contribution from acquisitions
(2)
(0.5
)%
(2.7
)%
—
%
—
%
Impact of divestitures
(3)
0.2
%
—
%
0.3
%
—
%
Non-GAAP revenue growth, organic
(4)
(3.2
)%
(3.9
)%
(5.0
)%
3.7
%
Six Months Ended June 29, 2024
Total CRL
RMS Segment
DSA Segment
MS Segment
Revenue growth, reported
(2.5
)%
4.3
%
(7.0
)%
6.7
%
(Increase) decrease due to foreign exchange
—
%
0.4
%
(0.3
)%
0.2
%
Contribution from acquisitions
(2)
(1.0
)%
(5.1
)%
—
%
—
%
Impact of divestitures
(3)
0.3
%
—
%
0.4
%
—
%
Non-GAAP revenue growth, organic
(4)
(3.2
)%
(0.4
)%
(6.9
)%
6.9
%
(1)
Charles River management believes that supplementary non-GAAP financial measures provide useful information to allow investors to gain a meaningful understanding of our core operating results and future prospects, without the effect of often-one-time charges and other items which are outside our normal operations, consistent with the manner in which management measures and forecasts the Company’s performance. The supplementary non-GAAP financial measures included are not meant to be considered superior to, or a substitute for results of operations prepared in accordance with U.S. GAAP. The Company intends to continue to assess the potential value of reporting non-GAAP results consistent with applicable rules, regulations and guidance.
(2)
The contribution from acquisitions reflects only completed acquisitions.
(3)
Impact of divestitures relates to the sale of a site within our Safety Assessment business.
(4)
Organic revenue growth is defined as reported revenue growth adjusted for acquisitions, divestitures, and foreign exchange.
并购财报
100 项与 Microbial Solutions Ltd. 相关的药物交易
登录后查看更多信息
100 项与 Microbial Solutions Ltd. 相关的转化医学
登录后查看更多信息
组织架构
使用我们的机构树数据加速您的研究。
登录
或
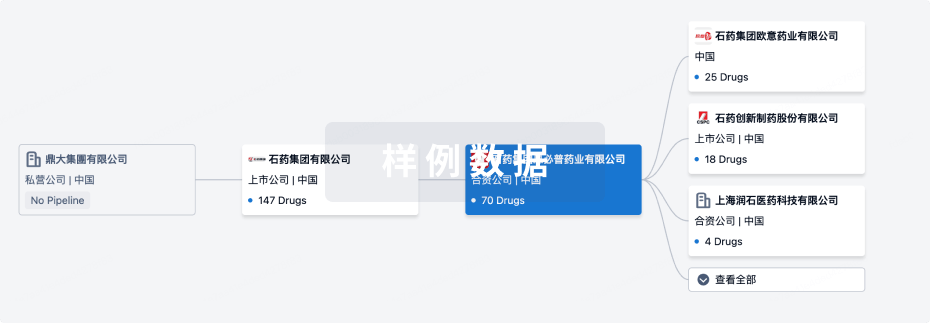
管线布局
2026年02月08日管线快照
无数据报导
登录后保持更新
药物交易
使用我们的药物交易数据加速您的研究。
登录
或
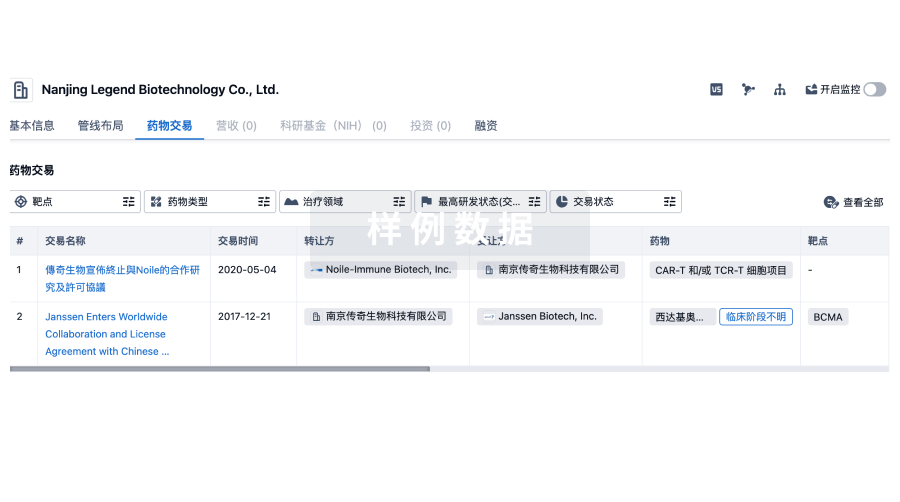
转化医学
使用我们的转化医学数据加速您的研究。
登录
或
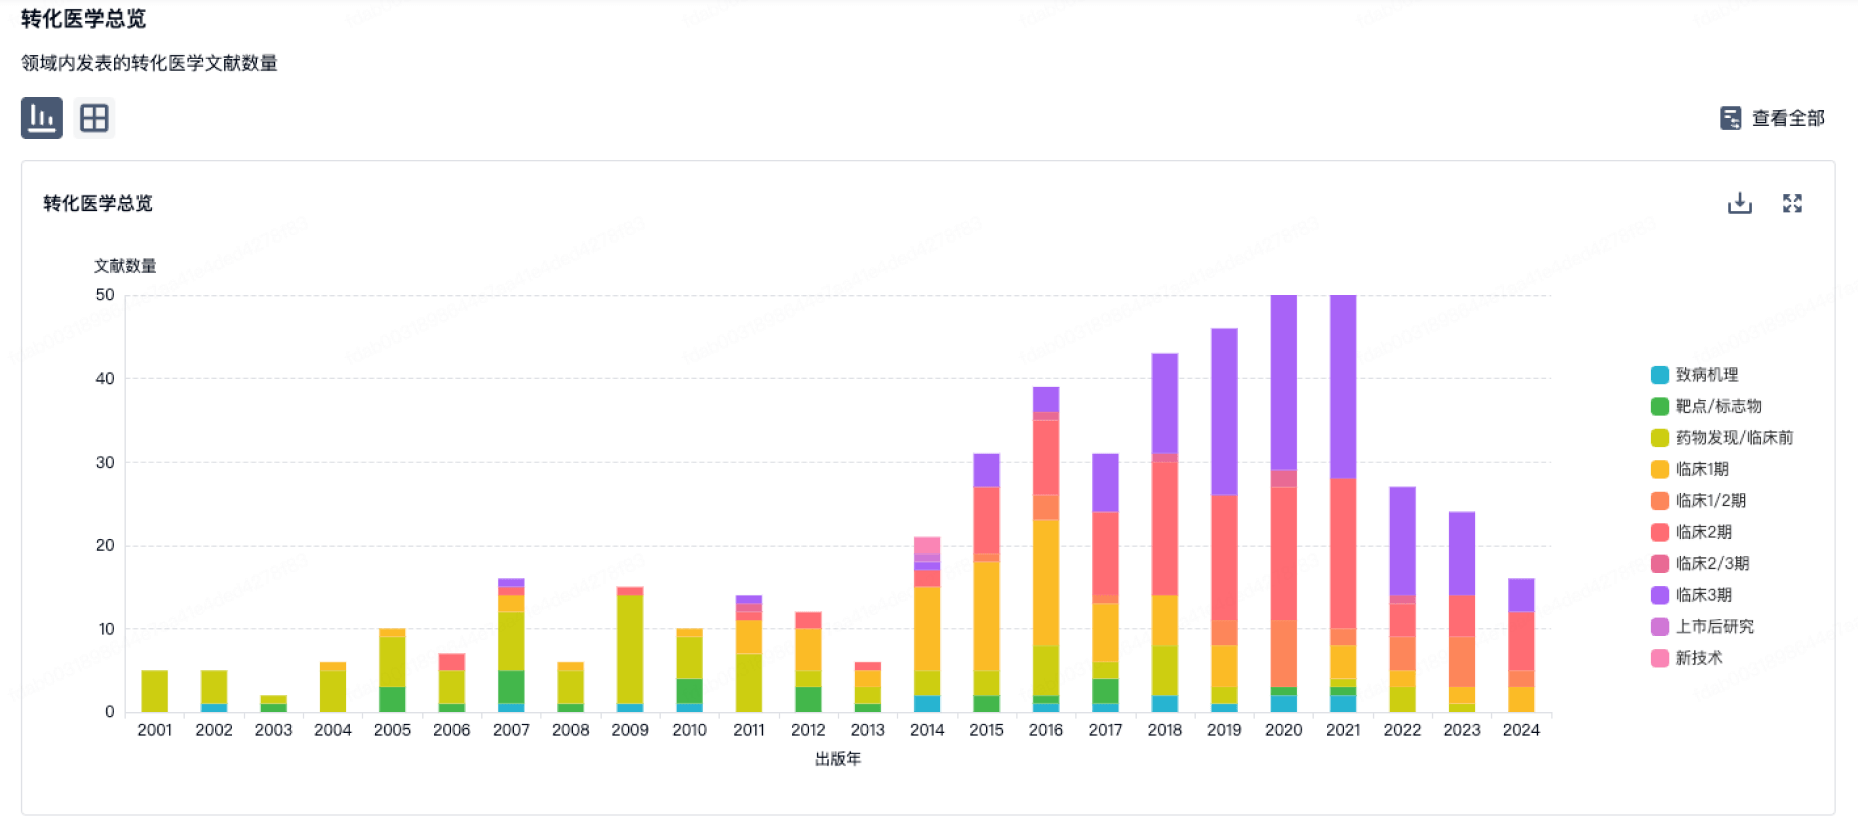
营收
使用 Synapse 探索超过 36 万个组织的财务状况。
登录
或
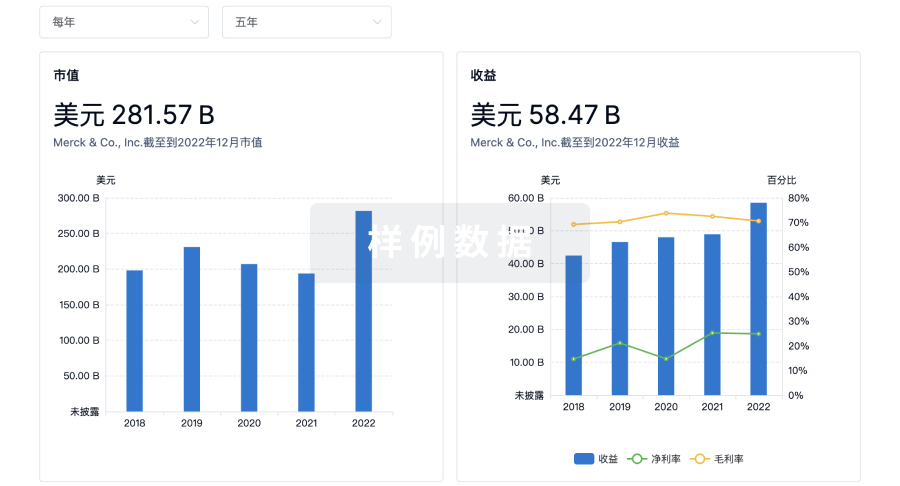
科研基金(NIH)
访问超过 200 万项资助和基金信息,以提升您的研究之旅。
登录
或
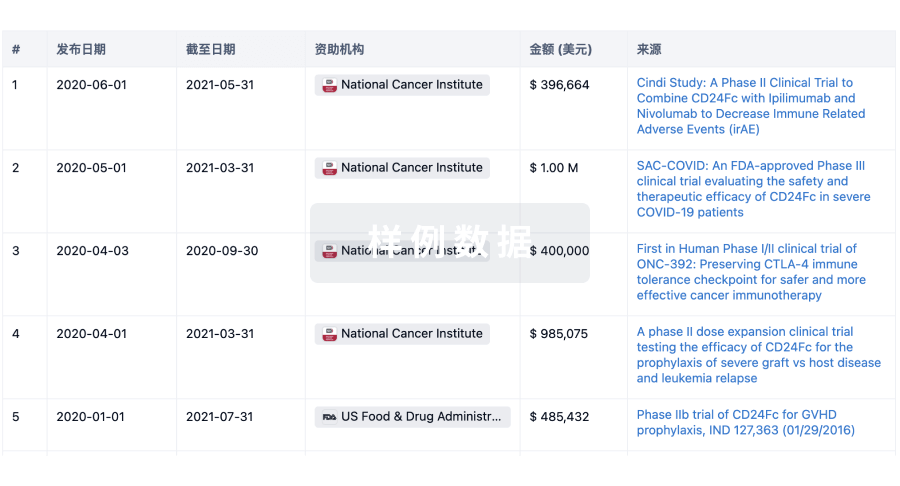
投资
深入了解从初创企业到成熟企业的最新公司投资动态。
登录
或
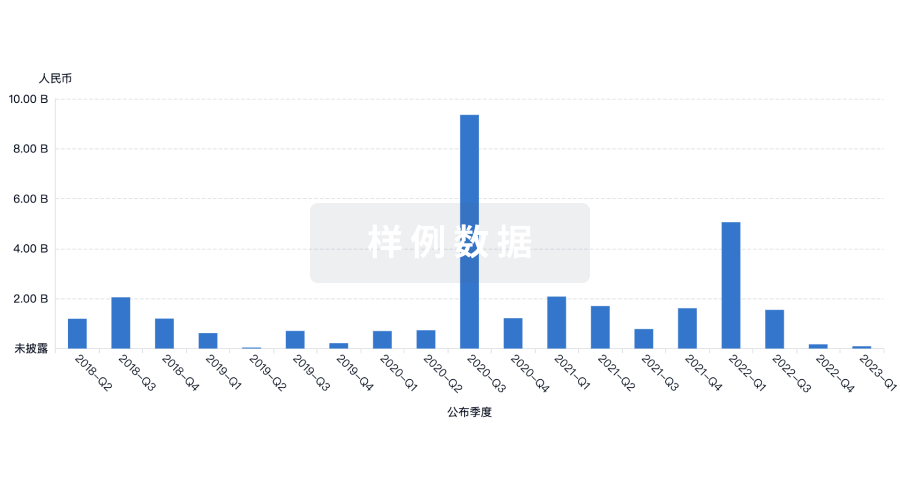
融资
发掘融资趋势以验证和推进您的投资机会。
登录
或
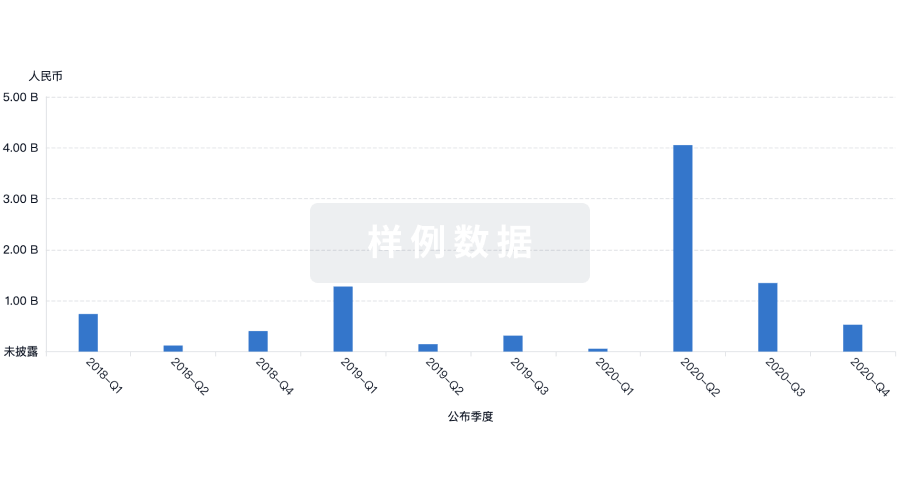
生物医药百科问答
全新生物医药AI Agent 覆盖科研全链路,让突破性发现快人一步
立即开始免费试用!
智慧芽新药情报库是智慧芽专为生命科学人士构建的基于AI的创新药情报平台,助您全方位提升您的研发与决策效率。
立即开始数据试用!
智慧芽新药库数据也通过智慧芽数据服务平台,以API或者数据包形式对外开放,助您更加充分利用智慧芽新药情报信息。
生物序列数据库
生物药研发创新
免费使用
化学结构数据库
小分子化药研发创新
免费使用