预约演示
更新于:2025-05-07
Healthcare, Inc.
更新于:2025-05-07
概览
关联
1
项与 Healthcare, Inc. 相关的临床试验NCT05152355
Multi-center, Single Blind, Randomized, Parallel Study to Compare the Clinical Efficacy and Safety of Dusama (Budesonide) HFA MDI With Pulmicort (Budesonide) Turbuhaler in Mild to Moderate Chinese Asthma Patients
The primary objective of this study is to compare the efficacy and safety of budesonide HFA MDI 200 mcg 2 puffs BID versus budesonide DPI (Turbuhaler) 100 mcg 4 puffs BID in Chinese mild to moderate Asthma patients.
开始日期2019-04-22 |
申办/合作机构  益得生物科技股份有限公司 益得生物科技股份有限公司 [+11] |
100 项与 Healthcare, Inc. 相关的临床结果
登录后查看更多信息
0 项与 Healthcare, Inc. 相关的专利(医药)
登录后查看更多信息
12
项与 Healthcare, Inc. 相关的新闻(医药)2024-11-06
LAFAYETTE, La., Nov. 06, 2024 (GLOBE NEWSWIRE) -- Viemed Healthcare, Inc. (the “Company” or “Viemed”) (NASDAQ:VMD), a national leader in respiratory care and technology-enabled home medical equipment services, announced today that it has reported its financial results for the three and nine months ended September 30, 2024. Operational highlights (all dollar amounts are USD; comparisons are to the period ended September 30, 2023 unless otherwise noted): Net revenues increased 17.4% for the quarter ended September 30, 2024 to $58.0 million, setting another Company record, and increased 5.5% sequentially over the second quarter ended June 30, 2024. Excluding acquired revenue of $1.1 million, non-acquired net revenues increased by 15% for the quarter ended September 30, 2024. Net income increased 33% for the quarter ended September 30, 2024 to $3.9 million, or $0.10 per diluted share. Adjusted EBITDA for the quarter ended September 30, 2024 increased 15.5% to $14.0 million. A reconciliation of reported non-GAAP financial measures to their most directly comparable U.S. GAAP financial measures can be found in the tables accompanying this press release. The Company increased its ventilator patient count by 11.0% to 11,374 on September 30, 2024 and increased ventilator patient count by 4.3% sequentially from June 30, 2024. The Company increased its sleep therapy patient count by 11.0% sequentially to 19,478 on September 30, 2024; the Company also increased its sleep resupply orders by 9.7% sequentially to 22,143 on September 30, 2024. As of September 30, 2024, the Company maintains a strong cash balance of $11.3 million and an overall working capital balance of $11.3 million. Long term debt as of September 30, 2024 amounted to $3.7 million and the Company has $55.3 million available under existing credit facilities. The Company exceeded the high end of its previously projected net revenue range for the third quarter of 2024, and now expects to generate net revenues of approximately $59.7 million to $60.9 million during the fourth quarter of 2024. Casey Hoyt, Viemed’s CEO, noted, “Viemed continues to earn a trusted place in the home with our high-touch, technology-enabled clinical approach to delivering complex respiratory care services. As a vital link between patients, providers and payers, we are demonstrating Viemed’s value in increasing patient satisfaction, improving compliance, and reducing rehospitalizations. This valuable position is helping us increase the patient population that we can serve for non-invasive ventilation, sleep, staffing and other complementary services. “The combination of Viemed’s well-earned place in the home, the sales force restructuring initiatives we completed earlier this year, and the operational efficiencies facilitating greater patient compliance are fueling our strong organic revenue growth. The improved outlook for the balance of 2024 is predicated on continued benefits from these sales initiatives and operational efficiencies driving organic growth and greater penetration of our underserved markets through expanded service and home-based product offerings,” added Mr. Hoyt. Conference Call Details The Company will host a conference call to discuss third quarter results on Thursday, November 7, 2024 at 12:00 p.m. ET. Interested parties may participate in the call by dialing: 877-407-6176 (US Toll-Free)+1 201-689-8451 (International) Live Audio Webcast: https://event.choruscall.com/mediaframe/webcast.html?webcastid=qSIpA5NC Following the conclusion of the call, an audio recording and transcript of the call can be accessed on the Company's website. ABOUT VIEMED HEALTHCARE, INC. Viemed is an in-home clinical care provider of post-acute respiratory healthcare equipment and services in the United States, including non-invasive ventilators (NIV), sleep therapy, staffing, and other complementary products and services. Viemed focuses on efficient and effective in-home treatment with clinical practitioners providing therapy, education and counseling to patients in their homes using high-touch and high-tech services. Visit our website at www.viemed.com. For further information, please contact: Glen AkselrodBristol Capital905-326-1888glen@bristolir.com Todd ZehnderChief Operating OfficerViemed Healthcare, Inc.337-504-3802investorinfo@viemed.com Forward-Looking Statements Certain statements contained in this press release may constitute “forward-looking statements” within the meaning of the U.S. Private Securities Litigation Reform Act of 1995 or “forward-looking information” as such term is defined in applicable Canadian securities legislation (collectively, “forward-looking statements”). Often, but not always, forward-looking statements can be identified by the use of words such as “plans”, “expects”, “is expected”, “budget”, “potential”, “scheduled”, “estimates”, “forecasts”, “intends”, “anticipates”, “believes”, “projects”, or the negatives thereof or variations of such words and phrases or statements that certain actions, events or results “will”, “should”, “may”, “could”, “would”, “might” or “will be taken”, “occur” or “be achieved” or the negative of these terms or comparable terminology. All statements other than statements of historical fact, including those that express, or involve discussions as to, expectations, beliefs, plans, objectives, assumptions or future events or performance, including the Company's net revenue guidance for the fourth quarter, are not historical facts and may be forward-looking statements and may involve estimates, assumptions and uncertainties that could cause actual results or outcomes to differ materially from those expressed in the forward-looking statements. Such statements reflect the Company's current views and intentions with respect to future events, and current information available to the Company, and are subject to certain risks, uncertainties and assumptions. Many factors could cause the actual results, performance or achievements that may be expressed or implied by such forward-looking statements to vary from those described herein should one or more of these risks or uncertainties materialize. These factors include, without limitation: the general business, market and economic conditions in the regions in which the Company operates; significant capital requirements and operating risks that the Company may be subject to; the ability of the Company to implement business strategies and pursue business opportunities; volatility in the market price of the Company's common shares; the state of the capital markets; the availability of funds and resources to pursue operations; inflation; reductions in reimbursement rates and audits of reimbursement claims by various governmental and private payor entities; dependence on few payors; possible new drug discoveries; dependence on key suppliers; granting of permits and licenses in a highly regulated business; competition; disruptions in or attacks (including cyber-attacks) on the Company's information technology, internet, network access or other voice or data communications systems or services; the evolution of various types of fraud or other criminal behavior to which the Company is exposed; difficulty integrating newly acquired businesses; the impact of new and changes to, or application of, current laws and regulations; the overall difficult litigation and regulatory environment; increased competition; increased funding costs and market volatility due to market illiquidity and competition for funding; critical accounting estimates and changes to accounting standards, policies, and methods used by the Company; the Company’s status as an emerging growth company; and the occurrence of natural and unnatural catastrophic events or health epidemics or concerns, and claims resulting from such events or concerns; as well as those risk factors discussed or referred to in the Company’s disclosure documents filed with the U.S. Securities and Exchange Commission (the “SEC”) available on the SEC’s website at www.sec.gov, including the Company’s most recent Annual Report on Form 10-K and Quarterly Report on Form 10-Q, and with the securities regulatory authorities in certain provinces of Canada available at www.sedar.com. Should any factor affect the Company in an unexpected manner, or should assumptions underlying the forward-looking statements prove incorrect, the actual results or events may differ materially from the results or events predicted. Any such forward-looking statements are expressly qualified in their entirety by this cautionary statement. Moreover, the Company does not assume responsibility for the accuracy or completeness of such forward-looking statements. The forward-looking statements included in this press release are made as of the date of this press release and the Company undertakes no obligation to publicly update or revise any forward-looking statements, other than as required by applicable law. VIEMED HEALTHCARE, INC.CONDENSED CONSOLIDATED BALANCE SHEETS(Expressed in thousands of U.S. Dollars, except share amounts)(Unaudited) AtSeptember 30, 2024 AtDecember 31, 2023ASSETS Current assets Cash and cash equivalents $11,347 $12,839 Accounts receivable, net 27,051 18,451 Inventory 4,311 4,628 Prepaid expenses and other assets 4,989 2,449 Total current assets $47,698 $38,367 Long-term assets Property and equipment, net 74,397 73,579 Finance lease right-of-use assets 70 401 Operating lease right-of-use assets 2,758 2,872 Equity investments 1,794 1,680 Debt investment 875 2,219 Deferred tax asset 8,065 4,558 Identifiable intangibles, net 880 567 Goodwill 32,989 29,765 Other long-term assets — 887 Total long-term assets $121,828 $116,528 TOTAL ASSETS $169,526 $154,895 LIABILITIES Current liabilities Trade payables $6,007 $4,180 Deferred revenue 6,819 6,207 Income taxes payable 2,077 2,153 Accrued liabilities 19,918 17,578 Finance lease liabilities, current portion 69 256 Operating lease liabilities, current portion 742 678 Current portion of long-term debt 812 1,072 Total current liabilities $36,444 $32,124 Long-term liabilities Accrued liabilities 652 558 Finance lease liabilities, less current portion — 132 Operating lease liabilities, less current portion 1,985 2,184 Long-term debt 3,650 6,002 Total long-term liabilities $6,287 $8,876 TOTAL LIABILITIES $42,731 $41,000 Commitments and Contingencies — — SHAREHOLDERS' EQUITY Common stock - No par value: unlimited authorized; 38,932,247 and 38,506,161 issued and outstanding as of September 30, 2024 and December 31, 2023, respectively 22,749 18,702 Additional paid-in capital 16,831 15,698 Retained earnings 85,379 79,495 TOTAL VIEMED HEALTHCARE, INC.'S SHAREHOLDERS' EQUITY $124,959 $113,895 Noncontrolling interest in subsidiary 1,836 — TOTAL SHAREHOLDERS' EQUITY 126,795 113,895 TOTAL LIABILITIES AND SHAREHOLDERS' EQUITY $169,526 $154,895 VIEMED HEALTHCARE, INC.CONDENSED CONSOLIDATED STATEMENTS OF INCOME(Expressed in thousands of U.S. Dollars, except outstanding shares and per share amounts)(Unaudited) Three Months Ended September 30, Nine Months Ended September 30, 2024 2023 2024 2023 Revenue $58,004 $49,402 $163,562 $132,269
Cost of revenue 23,633 18,840 66,497 51,597
Gross profit $34,371 $30,562 $97,065 $80,672
Operating expenses
Selling, general and administrative 26,671 23,654 77,988 63,979 Research and development 757 593 2,265 2,131 Stock-based compensation 1,712 1,453 4,764 4,315 Depreciation and amortization 348 419 1,140 957 Loss (gain) on disposal of property and equipment (469) 278 (801) 373 Other expense (income), net (276) (41) 261 (124)Income from operations $5,628 $4,206 $11,448 $9,041
Non-operating income and expenses
Income (expense) from investments 96 270 (954) 442 Interest expense, net (225) (237) (629) (168)
Net income before taxes 5,499 4,239 9,865 9,315 Provision for income taxes 1,594 1,320 2,880 2,549 Net income $3,905 $2,919 $6,985 $6,766 Net income attributable to noncontrolling interest 27 — 36 — Net income attributable to Viemed Healthcare, Inc. $3,878 $2,919 $6,949 $6,766
Net income per share
Basic $0.10 $0.08 $0.18 $0.18 Diluted $0.10 $0.07 $0.17 $0.17
Weighted average number of common shares outstanding:
Basic 38,870,823 38,438,058 38,803,887 38,307,343 Diluted 40,779,414 40,420,615 40,702,001 40,391,729 VIEMED HEALTHCARE, INC.CONDENSED CONSOLIDATED STATEMENTS OF CASH FLOWS(Expressed in thousands of U.S. Dollars)(Unaudited) Nine Months Ended September 30, 2024 2023 Cash flows from operating activities Net income $6,985 $6,766 Adjustments for: Depreciation and amortization 19,002 15,943 Stock-based compensation expense 4,764 4,315 Distributions of earnings received from equity method investments 147 833 Income from equity method investments (261) (442)Loss (income) from debt investment 1,344 (164)Loss (gain) on disposal of property and equipment (801) 373 Amortization of deferred financing costs 135 — Deferred income tax benefit (3,507) (791)Changes in working capital: Accounts receivable, net (8,213) (533)Inventory 583 (514)Prepaid expenses and other assets 340 1,193 Trade payables 747 (255)Deferred revenue 489 859 Accrued liabilities 2,424 4,086 Income tax payable/receivable (76) 259 Net cash provided by operating activities $24,102 $31,928 Cash flows from investing activities Purchase of property and equipment (25,942) (18,161)Investment in equity investments — (7)Cash paid for acquisitions, net of cash acquired (2,999) (28,580)Proceeds from sale of property and equipment 7,440 2,128 Net cash used in investing activities $(21,501) $(44,620)Cash flows from financing activities Proceeds from exercise of options 416 1,234 Proceeds from term notes — 5,000 Principal payments on term notes (954) (2,746)Proceeds from revolving credit facilities 3,000 8,000 Payments on revolving credit facilities (5,000) (5,005)Payments for debt issuance costs (171) — Shares redeemed to pay income tax (1,065) (595)Repayments of finance lease liabilities (319) (32)Net cash provided by (used in) financing activities $(4,093) $5,856 Net decrease in cash and cash equivalents (1,492) (6,836)Cash and cash equivalents at beginning of year 12,839 16,914 Cash and cash equivalents at end of period $11,347 $10,078 Supplemental disclosures of cash flow information Cash paid during the period for interest $745 $497 Cash paid during the period for income taxes, net of refunds $6,416 $3,218 Supplemental disclosures of non-cash transactions Equipment and other fixed asset purchases payable at end of period $2,854 $2,598 Equipment sales receivable at end of period $1,683 $— Non-GAAP Financial Measures This press release refers to “Adjusted EBITDA”, which is a financial measure that is not prepared in accordance with generally accepted accounting principles in the United States ("GAAP"). Adjusted EBITDA should be considered in addition to, not as a substitute for, or superior to, financial measures calculated in accordance with U.S. GAAP. Management believes Adjusted EBITDA provides helpful information with respect to the Company’s operating performance as viewed by management, including a view of the Company’s business that is not dependent on the impact of the Company’s capitalization structure and items that are not part of the Company’s day-to-day operations. Management uses Adjusted EBITDA (i) to compare the Company’s operating performance on a consistent basis, (ii) to calculate incentive compensation for the Company’s employees, (iii) for planning purposes, including the preparation of the Company’s internal annual operating budget, and (iv) to evaluate the performance and effectiveness of the Company’s operational strategies. Accordingly, management believes that Adjusted EBITDA provides useful information in understanding and evaluating the Company’s operating performance in the same manner as management. Adjusted EBITDA is not a measurement of the Company’s financial performance under U.S. GAAP and should not be considered as an alternative to revenue or net income, as applicable, or any other performance measures derived in accordance with U.S. GAAP. Adjusted EBITDA has limitations as an analytical tool and you should not consider it in isolation or as a substitute for analysis of the Company’s operating results as reported under U.S. GAAP. Adjusted EBITDA does not reflect the impact of certain cash charges resulting from matters the Company considers not to be indicative of ongoing operations; and other companies in the Company’s industry may calculate Adjusted EBITDA differently than we do, limiting its usefulness as a comparative measure. In calculating Adjusted EBITDA, certain items (mostly non-cash) are excluded from net income including depreciation and amortization of capitalized assets, net interest expense (income), stock based compensation, transaction costs, impairment of assets, and taxes. The following table is a reconciliation of net income (loss), the most directly comparable U.S. GAAP measure, to Adjusted EBITDA, on a historical basis for the periods indicated: VIEMED HEALTHCARE, INC.Reconciliation of Net Income to Non-GAAP Adjusted EBITDA(Expressed in thousands of U.S. Dollars)(Unaudited) For the quarter endedSeptember30, 2024June 30,2024March 31,2024December31, 2023September30, 2023June 30,2023March 31,2023December31, 2022Net income attributable to Viemed Healthcare, Inc.$3,878 $1,468 $1,603 $3,477 $2,919 $2,330 $1,517 $2,438 Add back:
Depreciation & amortization 6,408 6,309 6,285 5,918 5,975 5,207 4,762 4,373 Interest expense (income) 225 254 150 256 237 (20) (49) 32 Stock-based compensation(a) 1,712 1,620 1,432 1,534 1,453 1,471 1,391 1,317 Transaction costs(b) 12 221 110 61 177 94 206 — Impairment of assets(c) 125 2,173 — — — — — — Income tax expense 1,594 768 518 1,599 1,320 728 501 1,146 Adjusted EBITDA$13,954 $12,813 $10,098 $12,845 $12,081 $9,810 $8,328 $9,306 (a) Represents non-cash, equity-based compensation expense associated with option and RSU awards.(b) Represents transaction costs and expenses related to acquisition and integration efforts associated with recently announced or completed acquisitions.(c) Represents impairments of the fair value of investment and litigation-related assets. VIEMED HEALTHCARE, INC.Key Financial and Operational Information(Expressed in thousands of U.S. Dollars, except vent patients)(Unaudited) For the quarter endedSeptember30,2024June 30,2024March 31,2024December31, 2023September30, 2023June 30,2023March 31,2023December31, 2022Financial Information:
Revenue$58,004 $54,965 $50,593 $50,739 $49,402 $43,311 $39,556 $37,508 Gross Profit$34,371 $32,892 $29,802 $32,111 $30,562 $26,106 $24,004 $22,896 Gross Profit % 59% 60% 59% 63% 62% 60% 61% 61%Net Income$3,905 $1,477 $1,603 $3,477 $2,919 $2,330 $1,517 $2,438 Cash (As of)$11,347 $8,807 $7,309 $12,839 $10,078 $10,224 $23,544 $16,914 Total Assets (As of)$169,526 $163,947 $154,875 $154,895 $149,400 $149,117 $124,634 $117,043 Adjusted EBITDA(1)$13,954 $12,813 $10,098 $12,845 $12,081 $9,810 $8,328 $9,306 Operational Information:
Vent Patients(2) 11,374 10,905 10,450 10,327 10,244 10,005 9,337 9,306 (1) Refer to "Non-GAAP Financial Measures" section above for definition of Adjusted EBITDA.(2) Vent Patients represents the number of active ventilator patients on recurring billing service at the end of each calendar quarter. The revenues from each major source are summarized in the following table: Three Months EndedSeptember 30, Nine Months EndedSeptember 30, 2024 2023 2024 2023 Revenue from rentals
Ventilator rentals, non-invasive and invasive $31,772 $28,322 $91,404 $79,181 Other home medical equipment rentals 12,459 11,119 35,604 26,441 Revenue from sales and services
Equipment and supply sales 8,440 7,742 21,956 19,287 Service revenues 5,333 2,219 14,598 7,360 Total revenues $58,004 $49,402 $163,562 $132,269
财报
2024-04-02
LAFAYETTE, La., April 02, 2024 (GLOBE NEWSWIRE) -- Viemed Healthcare, Inc. (the “Company” or “Viemed”) (NASDAQ:VMD), a national leader in respiratory care and technology-enabled home medical equipment services, announced the finalization of its strategic partnership with East Alabama Health (“EAH”), providing Viemed with the controlling interest of East Alabama HomeMed, LLC ("HomeMed"). HomeMed provides home medical equipment services to patients within the EAH network as well as those in the surrounding areas of Eastern Alabama. "We are thrilled to join forces with the exceptional team at East Alabama Health to deliver best-in-class home medical services to their patients and expand HomeMed’s business through the strategic partnership," said Viemed Chief Executive Officer Casey Hoyt. "This marks a significant milestone in our ongoing growth strategy, which includes hospital joint ventures and institutional partnerships. We view this transaction as a blueprint that can be replicated nationwide, enhancing care quality while simultaneously creating value for healthcare systems." Laura Grill, President and CEO of EAH, emphasized that the collaboration with Viemed aligns seamlessly with East Alabama Health’s organizational mission to provide the best possible care for every patient, every time, and to do so with empathy, kindness and caring. The EAH network encompasses East Alabama Medical Center in Opelika, AL, and EAMC-Lanier Hospital in Valley, AL, with a combined medical staff of 380 physicians. The transaction closed on April 1, 2024, with Viemed acquiring a majority ownership interest and assuming managerial responsibilities of HomeMed. EAH will retain a minority, non-controlling interest in the entity. Viemed expects incremental annualized revenue from the acquired operations of approximately $4 million. ABOUT VIEMED HEALTHCARE, INC. Viemed is a provider of in-home medical equipment and post-acute respiratory healthcare services in the United States. Viemed’s service offerings are focused on effective in-home treatment with clinical practitioners providing therapy and counseling to patients in their homes using cutting-edge technology. Visit our website at www.viemed.com. For further information, please contact: Glen AkselrodBristol Capital905-326-1888glen@bristolir.com Todd ZehnderChief Operating OfficerViemed Healthcare, Inc.337-504-3802investorinfo@viemed.com Forward-Looking Statements Certain statements contained in this press release may constitute “forward-looking statements” within the meaning of the U.S. Private Securities Litigation Reform Act of 1995 or “forward-looking information” as such term is defined in applicable Canadian securities legislation (collectively, “forward-looking statements”). Often, but not always, forward-looking statements can be identified by the use of words such as “plans”, “expects”, “is expected”, “budget”, “potential”, “scheduled”, “estimates”, “forecasts”, “intends”, “anticipates”, “believes”, “projects”, or the negatives thereof or variations of such words and phrases or statements that certain actions, events or results “will”, “should”, “may”, “could”, “would”, “might” or “will be taken”, “occur” or “be achieved” or the negative of these terms or comparable terminology. All statements other than statements of historical fact, including those that express, or involve discussions as to, expectations, beliefs, plans, objectives, assumptions or future events or performance, including the Company's ability to expand HomeMed’s business, to replicate the transaction nationwide, and expected annualized revenue associated with the acquisition, are not historical facts and may be forward-looking statements and may involve estimates, assumptions and uncertainties that could cause actual results or outcomes to differ materially from those expressed in the forward-looking statements. Such statements reflect the Company's current views and intentions with respect to future events, and current information available to the Company, and are subject to certain risks, uncertainties and assumptions. Many factors could cause the actual results, performance or achievements that may be expressed or implied by such forward-looking statements to vary from those described herein should one or more of these risks or uncertainties materialize. These factors include, without limitation: the general business, market and economic conditions in the regions in which the Company operates; significant capital requirements and operating risks that the Company may be subject to; the ability of the Company to implement business strategies and pursue business opportunities; volatility in the market price of the Company's common shares; the state of the capital markets; the availability of funds and resources to pursue operations; inflation; reductions in reimbursement rates and audits of reimbursement claims by various governmental and private payor entities; dependence on few payors; possible new drug discoveries; dependence on key suppliers; granting of permits and licenses in a highly regulated business; competition; disruptions in or attacks (including cyber-attacks) on the Company's information technology, internet, network access or other voice or data communications systems or services; the evolution of various types of fraud or other criminal behavior to which the Company is exposed; difficulty integrating newly acquired businesses; the impact of new and changes to, or application of, current laws and regulations; the overall difficult litigation and regulatory environment; increased competition; increased funding costs and market volatility due to market illiquidity and competition for funding; critical accounting estimates and changes to accounting standards, policies, and methods used by the Company; the Company’s status as an emerging growth company and a smaller reporting company; and the occurrence of natural and unnatural catastrophic events or health epidemics or concerns, and claims resulting from such events or concerns; as well as those risk factors discussed or referred to in the Company’s disclosure documents filed with the U.S. Securities and Exchange Commission (the “SEC”) available on the SEC’s website at www.sec.gov, including the Company’s most recent Annual Report on Form 10-K, and with the securities regulatory authorities in certain provinces of Canada available at www.sedar.com. Should any factor affect the Company in an unexpected manner, or should assumptions underlying the forward-looking statements prove incorrect, the actual results or events may differ materially from the results or events predicted. Any such forward-looking statements are expressly qualified in their entirety by this cautionary statement. Moreover, the Company does not assume responsibility for the accuracy or completeness of such forward-looking statements. The forward-looking statements included in this press release are made as of the date of this press release and the Company undertakes no obligation to publicly update or revise any forward-looking statements, other than as required by applicable law.
并购
2024-03-06
LAFAYETTE, La., March 06, 2024 (GLOBE NEWSWIRE) -- Viemed Healthcare, Inc. (the “Company” or “Viemed”) (NASDAQ:VMD), a national leader in respiratory care and technology-enabled home medical equipment services, announced today that it has reported its financial results for the three months and year ended December 31, 2023. Operational highlights (all dollar amounts are USD): Net revenues for the quarter ended December 31, 2023 reached a new Company record of $50.7 million representing an increase of $13.2 million, or 35%, over net revenues reported for the comparable quarter ended December 31, 2022. Total net revenues for the year ended December 31, 2023 were a record-breaking $183.0 million, an increase of $44.2 million, or 32%, over the year ended December 31, 2022.Net income for the quarter ended December 31, 2023 totaled $3.5 million, an increase of 43% over net income reported for the comparable quarter ended December 31, 2022. Net income for the year ended December 31, 2023 totaled $10.2 million, an increase of 65% over the year ended December 31, 2022, marking the Company's seventh consecutive year of positive net income.Adjusted EBITDA for the quarter and year ended December 31, 2023 totaled $12.8 million and a record $43.1 million, respectively. A reconciliation of reported non-GAAP financial measures to their most directly comparable U.S. GAAP financial measures can be found in the tables accompanying this press release.Net cash provided by operating activities for the year ended December 31, 2023 totaled $45.2 million, an increase of $17.5 million, or 62.9%, over the year ended December 31, 2022. Free Cash Flow for the year ended December 31, 2023 totaled $19.1 million, an increase of $14.3 million, or 294%, over the year ended December 31, 2022.As of December 31, 2023, the Company maintains a strong cash balance of $12.8 million ($16.9 million at December 31, 2022), and an overall working capital balance of $6.2 million ($20.9 million at December 31, 2022). Long-term debt as of December 31, 2023 amounted to $6.0 million (the company had no long-term debt at December 31, 2022). After successfully completing an approximately $30 million acquisition during 2023, the Company ended the year with no net debt and has approximately $53 million available under existing credit facilities.The Company expects to generate net revenues of approximately $49.7 million to $51.0 million during the first quarter of 2024 and assumes that the 75/25 blended Medicare reimbursement rate adjustment in non-rural, non-competitive bid areas is not extended. "We're thrilled to announce another exceptional year of financial performance at Viemed, marked by robust double-digit annual growth and sustained profitability," said Casey Hoyt, Viemed's CEO. "We are particularly pleased with the Company's capacity to generate free cash flow, enabling us to fuel continued strong growth. This underscores the effectiveness of our strategic initiatives and the dedication of our entire team. These accomplishments reaffirm our commitment to delivering enduring value to our stakeholders." Conference Call Details The Company will host a conference call to discuss fourth quarter and year end results on Thursday, March 7, 2024 at 11:00 a.m. ET. Interested parties may participate in the call by dialing: 877-407-6176 (US Toll-Free)+1-201-689-8451 (International) Live Audio Webcast: https://event.choruscall.com/mediaframe/webcast.html?webcastid=Axpi0DDw Following the conclusion of the call, an audio recording and transcript of the call can be accessed on the Company's website. ABOUT VIEMED HEALTHCARE, INC. Viemed is a provider of in-home medical equipment and post-acute respiratory healthcare services in the United States. Viemed’s service offerings are focused on effective in-home treatment with clinical practitioners providing therapy and counseling to patients in their homes using cutting-edge technology. Visit our website at www.viemed.com. For further information, please contact: Glen AkselrodBristol Capital905-326-1888glen@bristolir.com Todd ZehnderChief Operating OfficerViemed Healthcare, Inc.337-504-3802investorinfo@viemed.com Forward-Looking Statements Certain statements contained in this press release may constitute “forward-looking statements” within the meaning of the U.S. Private Securities Litigation Reform Act of 1995 or “forward-looking information” as such term is defined in applicable Canadian securities legislation (collectively, “forward-looking statements”). Often, but not always, forward-looking statements can be identified by the use of words such as “plans”, “expects”, “is expected”, “budget”, “potential”, “scheduled”, “estimates”, “forecasts”, “intends”, “anticipates”, “believes”, “projects”, or the negatives thereof or variations of such words and phrases or statements that certain actions, events or results “will”, “should”, “may”, “could”, “would”, “might” or “will be taken”, “occur” or “be achieved” or the negative of these terms or comparable terminology. All statements other than statements of historical fact, including those that express, or involve discussions as to, expectations, beliefs, plans, objectives, assumptions or future events or performance, including the Company's net revenue guidance for the first quarter, are not historical facts and may be forward-looking statements and may involve estimates, assumptions and uncertainties that could cause actual results or outcomes to differ materially from those expressed in the forward-looking statements. Such statements reflect the Company's current views and intentions with respect to future events, and current information available to the Company, and are subject to certain risks, uncertainties and assumptions. Many factors could cause the actual results, performance or achievements that may be expressed or implied by such forward-looking statements to vary from those described herein should one or more of these risks or uncertainties materialize. These factors include, without limitation: the general business, market and economic conditions in the regions in which the Company operates; significant capital requirements and operating risks that the Company may be subject to; the ability of the Company to implement business strategies and pursue business opportunities; volatility in the market price of the Company's common shares; the state of the capital markets; the availability of funds and resources to pursue operations; inflation; reductions in reimbursement rates and audits of reimbursement claims by various governmental and private payor entities; dependence on few payors; possible new drug discoveries; dependence on key suppliers; granting of permits and licenses in a highly regulated business; competition; disruptions in or attacks (including cyber-attacks) on the Company's information technology, internet, network access or other voice or data communications systems or services; the evolution of various types of fraud or other criminal behavior to which the Company is exposed; difficulty integrating newly acquired businesses; the impact of new and changes to, or application of, current laws and regulations; the overall difficult litigation and regulatory environment; increased competition; increased funding costs and market volatility due to market illiquidity and competition for funding; critical accounting estimates and changes to accounting standards, policies, and methods used by the Company; the Company’s status as an emerging growth company and a smaller reporting company; and the occurrence of natural and unnatural catastrophic events or health epidemics or concerns, and claims resulting from such events or concerns; as well as those risk factors discussed or referred to in the Company’s disclosure documents filed with the U.S. Securities and Exchange Commission (the “SEC”) available on the SEC’s website at www.sec.gov, including the Company’s most recent Annual Report on Form 10-K, and with the securities regulatory authorities in certain provinces of Canada available at www.sedar.com. Should any factor affect the Company in an unexpected manner, or should assumptions underlying the forward-looking statements prove incorrect, the actual results or events may differ materially from the results or events predicted. Any such forward-looking statements are expressly qualified in their entirety by this cautionary statement. Moreover, the Company does not assume responsibility for the accuracy or completeness of such forward-looking statements. The forward-looking statements included in this press release are made as of the date of this press release and the Company undertakes no obligation to publicly update or revise any forward-looking statements, other than as required by applicable law. Use of Non-GAAP Financial Measures This press release refers to Adjusted EBITDA and Free Cash Flow, which are financial measures that are not prepared in accordance with generally accepted accounting principles in the United States ("GAAP"). Adjusted EBITDA and Free Cash Flow should be considered in addition to, not as a substitute for, or superior to, financial measures calculated in accordance with U.S. GAAP. Management believes Adjusted EBITDA provides helpful information with respect to the Company’s operating performance as viewed by management, including a view of the Company’s business that is not dependent on the impact of the Company’s capitalization structure and items that are not part of the Company’s day-to-day operations. Management uses Adjusted EBITDA (i) to compare the Company’s operating performance on a consistent basis, (ii) to calculate incentive compensation for the Company’s employees, (iii) for planning purposes, including the preparation of the Company’s internal annual operating budget, and (iv) to evaluate the performance and effectiveness of the Company’s operational strategies. Accordingly, management believes that Adjusted EBITDA provides useful information in understanding and evaluating the Company’s operating performance in the same manner as management. Adjusted EBITDA is not a measurement of the Company’s financial performance under U.S. GAAP and should not be considered as an alternative to revenue or net income, as applicable, or any other performance measures derived in accordance with U.S. GAAP and may not be comparable to other similarly titled measures of other businesses. Adjusted EBITDA has limitations as an analytical tool and you should not consider it in isolation or as a substitute for analysis of the Company’s operating results as reported under U.S. GAAP. Adjusted EBITDA does not reflect the impact of certain cash charges resulting from matters the Company considers not to be indicative of ongoing operations; and other companies in the Company’s industry may calculate Adjusted EBITDA differently than we do, limiting its usefulness as a comparative measure. The Company uses Free Cash Flow in its operational and financial decision-making and believes free cash flow is useful to investors because similar measures are frequently used by securities analysts, investors, ratings agencies and other interested parties to evaluate the Company's competitors and to measure the ability of companies to service their debt. The Company's presentation of Free Cash Flow should not be construed as a measure of liquidity or discretionary cash available to the Company to fund its cash needs, including investing in the growth of its business and meeting its obligations. VIEMED HEALTHCARE, INC.CONSOLIDATED BALANCE SHEETS(Expressed in thousands of U.S. Dollars, except share amounts) AtDecember 31, 2023 AtDecember 31, 2022ASSETS Current assets Cash and cash equivalents $12,839 $16,914Accounts receivable, net 18,451 15,379Inventory 4,628 3,574Income tax receivable — 26Prepaid expenses and other assets 2,449 3,849Total current assets $38,367 $39,742Long-term assets Property and equipment, net 73,579 67,743Finance lease right-of-use assets 401 —Operating lease right-of-use assets 2,872 694Equity investments 1,680 2,155Debt investment 2,219 2,000Deferred tax asset 4,558 3,119Identifiable intangibles, net 567 —Goodwill 29,765 —Other long-term assets 887 1,590Total long-term assets 116,528 77,301TOTAL ASSETS $154,895 $117,043
LIABILITIES Current liabilities Trade payables $4,180 $2,650Deferred revenue 6,207 4,624Income taxes payable 2,153 —Accrued liabilities 17,578 11,092Finance lease liabilities, current portion 256 —Operating lease liabilities, current portion 678 495Current debt 1,072 —Total current liabilities $32,124 $18,861Long-term liabilities Accrued liabilities 558 889Finance lease liabilities, less current portion 132 —Operating lease liabilities, less current portion 2,184 199Long-term debt 6,002 —Total long-term liabilities $8,876 $1,088TOTAL LIABILITIES $41,000 $19,949
Commitments and Contingencies — —
SHAREHOLDERS' EQUITY Common stock - No par value: unlimited authorized; 38,506,161 and 38,049,739 issued and outstanding as of December 31, 2023 and December 31, 2022, respectively 18,702 15,123Additional paid-in capital 15,698 12,125Retained earnings 79,495 69,846TOTAL SHAREHOLDERS' EQUITY $113,895 $97,094TOTAL LIABILITIES AND SHAREHOLDERS' EQUITY $154,895 $117,043 VIEMED HEALTHCARE, INC.CONSOLIDATED STATEMENTS OF INCOME AND COMPREHENSIVE INCOME(Expressed in thousands of U.S. Dollars, except outstanding shares and per share amounts) Three Months EndedDecember 31, Year EndedDecember 31, 2023 2022 2023 2022 Revenue$50,739 $37,508 $183,008 $138,832
Cost of revenue 18,628 14,612 70,225 54,152
Gross profit$32,111 $22,896 $112,783 $84,680
Operating expenses
Selling, general and administrative 23,905 17,172 87,884 68,161 Research and development 651 722 2,782 2,696 Stock-based compensation 1,534 1,317 5,849 5,202 Depreciation and amortization 434 241 1,391 1,012 Loss on disposal of property and equipment 272 178 645 346 Other income, net 26 (268) (98) (989)Income from operations$5,289 $3,534 $14,330 $8,252
Non-operating income and expenses
Income from equity method investments 43 82 485 935 Interest expense, net (256) (32) (424) (197)
Net income before taxes 5,076 3,584 14,391 8,990 Provision for income taxes 1,599 1,146 4,148 2,768
Net income$3,477 $2,438 $10,243 $6,222
Other comprehensive income
Change in unrealized gain/loss on derivative instruments, net of tax — (56) — 278 Other comprehensive income$— $(56) $— $278
Comprehensive income$3,477 $2,382 $10,243 $6,500
Net income per share
Basic$0.09 $0.06 $0.27 $0.16 Diluted$0.09 $0.06 $0.25 $0.16
Weighted average number of common shares outstanding:
Basic 38,492,731 38,015,795 38,354,071 38,655,403 Diluted 40,383,109 39,513,158 40,378,922 39,807,434 VIEMED HEALTHCARE, INC.CONSOLIDATED STATEMENTS OF CASH FLOWS(Expressed in thousands of U.S. Dollars) Year Ended December 31, 2023 2022 Cash flows from operating activities Net income $10,243 $6,222 Adjustments for: Depreciation and amortization 21,862 15,630 Change in inventory reserve — (1,418)Stock-based compensation expense 5,849 5,202 Distributions of earnings received from equity method investments 980 1,079 Income from equity method investments (485) (935)Income from debt investment (219) — Loss on disposal of property and equipment 645 346 Deferred income tax (benefit) expense (1,439) 1,746 Changes in working capital, net of effects from acquisitions: Accounts receivable, net (1,058) (2,556)Inventory (472) 301 Prepaid expenses and other assets 2,176 (2,838)Trade payables (859) (318)Deferred revenue 851 871 Accrued liabilities 4,959 2,549 Income tax payable/receivable 2,179 1,867 Net cash provided by operating activities $45,212 $27,748
Cash flows from investing activities Purchase of property and equipment (26,093) (22,898)Investment in equity investments (20) (141)Cash paid for acquisition of HMP, net of cash acquired (28,588) — Investment in debt security — (2,000)Proceeds from sale of property and equipment 2,588 1,063 Net cash used in investing activities $(52,113) $(23,976)
Cash flows from financing activities Proceeds from exercise of options 1,303 283 Proceeds from term notes 5,000 — Principal payments on term notes (3,721) (5,796)Proceeds from revolving credit facilities 8,000 — Payments on revolving credit facilities (7,005) — Shares redeemed to pay income tax (594) (143)Shares repurchased under the share repurchase program — (9,568)Repayments of lease liabilities (157) (42)Net cash provided by (used in) financing activities $2,826 $(15,266)
Net decrease in cash and cash equivalents (4,075) (11,494)Cash and cash equivalents at beginning of year 16,914 28,408 Cash and cash equivalents at end of period $12,839 $16,914
Supplemental disclosures of cash flow information Cash paid during the period for interest $851 $231 Cash paid (received) during the period for income taxes, net of refunds $3,566 $(846)Supplemental disclosures of non-cash transactions Non-cash change in debt from the reclassification of debt issuance costs $(594) $— Net non-cash changes to operating lease $(41) $530 Non-GAAP Financial Measures This press release refers to “Adjusted EBITDA” which is a non-GAAP financial measure that does not have a standardized meaning prescribed by U.S. GAAP. Adjusted EBITDA is defined as net income (loss) before net interest expense (income), income tax expense (benefit), depreciation and amortization, and stock-based compensation. Beginning with financial results reported for periods in fiscal year 2023, Adjusted EBITDA also excludes transaction costs and expenses related to acquisition and integration efforts associated with recently announced or completed acquisitions. This modification enables investors to compare period-over-period results on a more consistent basis without the effects of acquisitions. We have recast Adjusted EBITDA for prior periods when reported to conform to the modified presentation. The Company's presentation of this financial measure may not be comparable to similarly titled measures used by other companies. The following table is a reconciliation of net income (loss), the most directly comparable U.S. GAAP measure, to Adjusted EBITDA, on a historical basis for the periods indicated: VIEMED HEALTHCARE, INC.Reconciliation of Net Income to Non-GAAP Adjusted EBITDA(Expressed in thousands of U.S. Dollars)(Unaudited)For the quarter endedDecember 31,2023September 30,2023June 30,2023March 31,2023December 31,2022September 30,2022June 30,2022March 31,2022Net Income$3,477$2,919$2,330 $1,517 $2,438$1,055$967$1,762Add back:
Depreciation & amortization 5,918 5,975 5,207 4,762 4,373 4,120 3,740 3,397Interest expense (income) 256 237 (20) (49) 32 42 59 64Stock-based compensation(a) 1,534 1,453 1,471 1,391 1,317 1,309 1,271 1,305Transaction costs(b) 61 177 94 206 — — — —Income tax expense 1,599 1,320 728 501 1,146 456 421 745Adjusted EBITDA$12,845$12,081$9,810 $8,328 $9,306$6,982$6,458$7,273 (a) Represents non-cash, equity-based compensation expense associated with option and RSU awards.(b) Represents transaction costs and expenses related to acquisition and integration efforts associated with recently announced or completed acquisitions. Year Ended December 31, 2023Net Income $10,243Add back: Depreciation & amortization 21,862Interest expense (income) 424Stock-based compensation(a) 5,849Transaction costs(b) 538Income tax expense 4,148Adjusted EBITDA $43,064 Free Cash Flow This press release refers to “Free Cash Flow” which is a non-GAAP financial measure that does not have a standardized meaning prescribed by U.S. GAAP. Free Cash Flow is defined as net cash provided by operating activities less cash paid for purchases of property and equipment. The Company's presentation of this financial measure may not be comparable to similarly titled measures used by other companies. The following unaudited table is a reconciliation of net cash provided by operating activities, the most directly comparable U.S. GAAP measure, to Free Cash Flow, on a historical basis for the periods indicated: (in thousands) Three Months Ended December 31, Year Ended December 31, 2023 2022 2023 2022 Net cash provided by operating activities $13,284 $7,684 $45,212 $27,748 Purchase of property and equipment (7,932) (5,572) (26,093) (22,898)Free Cash Flow $5,352 $2,112 $19,119 $4,850 VIEMED HEALTHCARE, INC.Key Financial and Operational Information(Expressed in thousands of U.S. Dollars, except vent patients)(Unaudited)For the quarter endedDecember 31,2023September 30,2023June 30,2023March 31,2023December 31,2022September 30,2022June 30,2022March 31,2022Financial Information:
Revenue$50,739 $49,402 $43,311 $39,556 $37,508 $35,759 $33,310 $32,255 Gross Profit 32,111 30,562 26,106 24,004 22,896 21,651 20,390 19,743 Gross Profit % 63% 62% 60% 61% 61% 61% 61% 61%Net Income 3,477 2,919 2,330 1,517 2,438 1,055 967 1,762 Cash and Cash Equivalents (As of) 12,839 10,078 10,224 23,544 16,914 21,478 21,922 29,248 Total Assets (As of) 154,895 149,400 149,117 124,634 117,043 119,419 115,904 119,007 Adjusted EBITDA(1) 12,845 12,081 9,810 8,328 9,306 6,982 6,458 7,273 Operational Information:
Vent Patients(2) 10,327 10,244 10,005 9,337 9,306 9,127 8,837 8,434 (1)Refer to "Non-GAAP Financial Measures" section above for definition of Adjusted EBITDA.(2)Vent Patients represents the number of active ventilator patients on recurring billing service at the end of each calendar quarter.
并购财报
100 项与 Healthcare, Inc. 相关的药物交易
登录后查看更多信息
100 项与 Healthcare, Inc. 相关的转化医学
登录后查看更多信息
组织架构
使用我们的机构树数据加速您的研究。
登录
或
管线布局
2026年03月21日管线快照
无数据报导
登录后保持更新
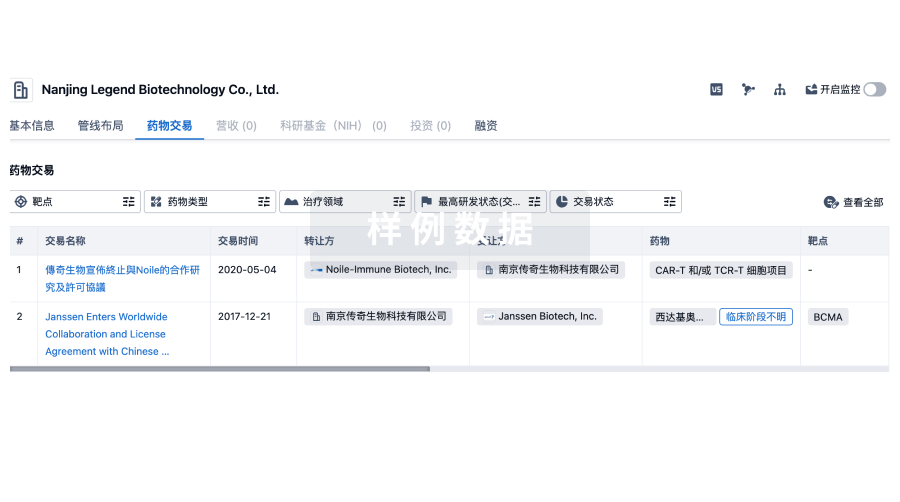
药物交易
使用我们的药物交易数据加速您的研究。
登录
或
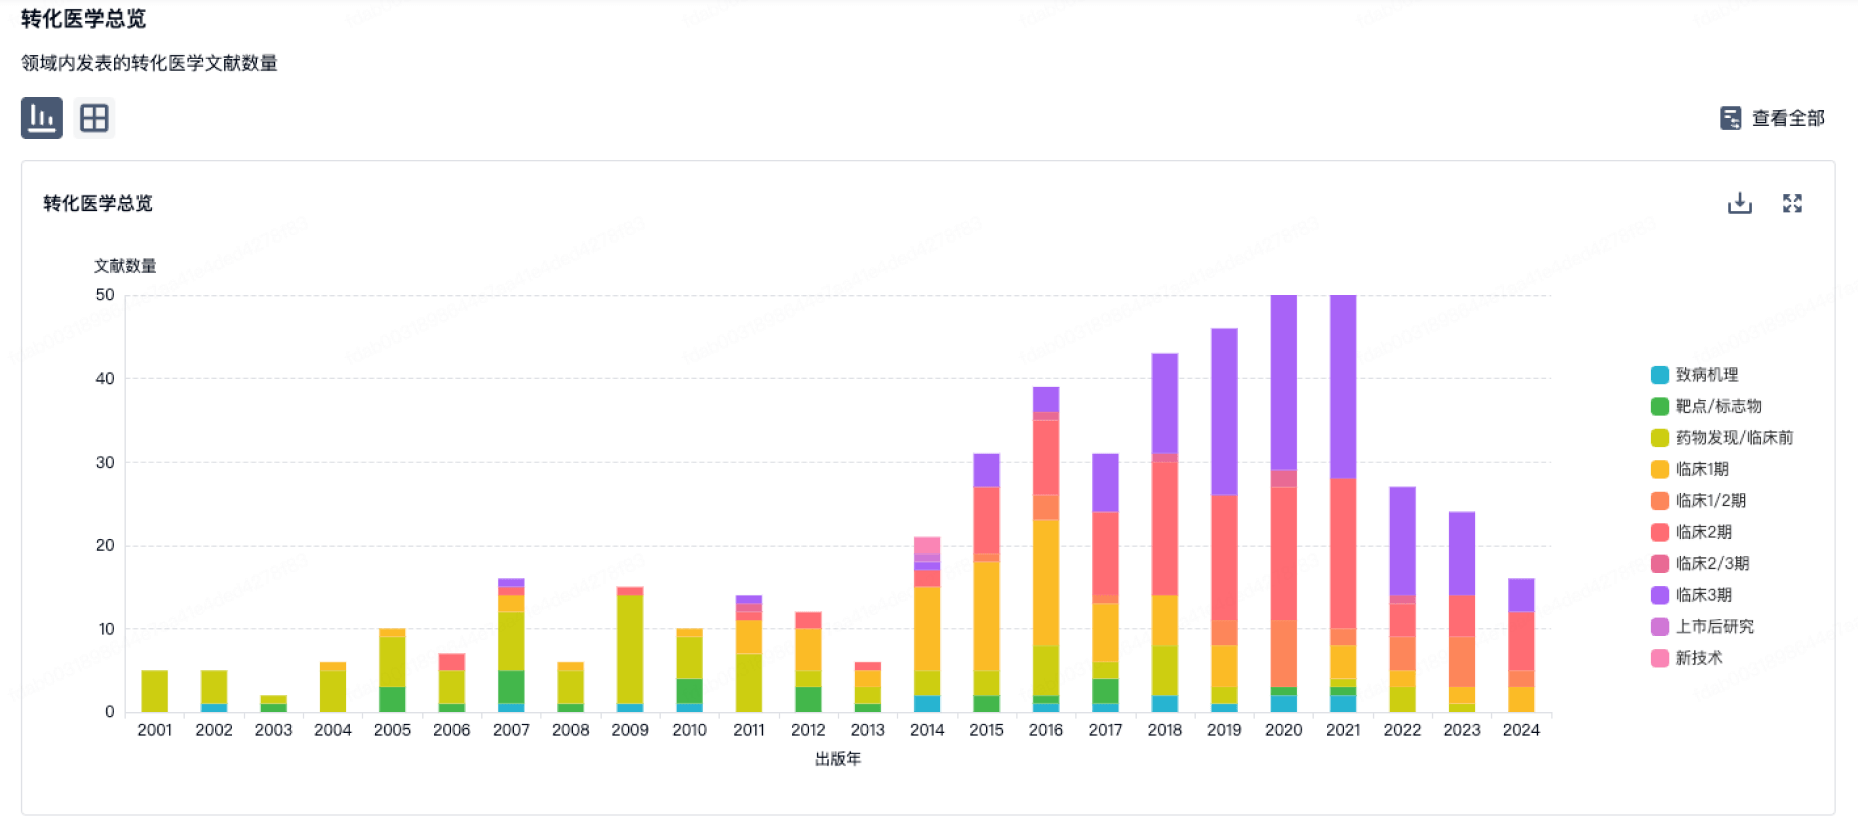
转化医学
使用我们的转化医学数据加速您的研究。
登录
或
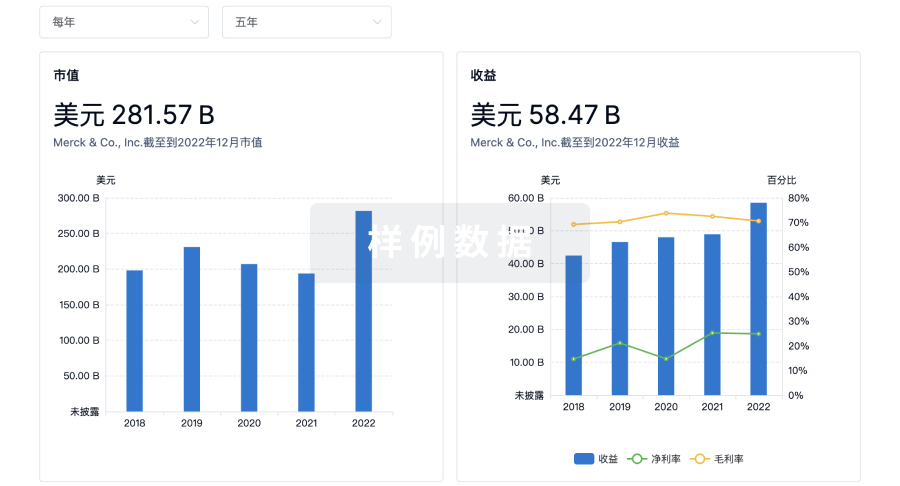
营收
使用 Synapse 探索超过 36 万个组织的财务状况。
登录
或
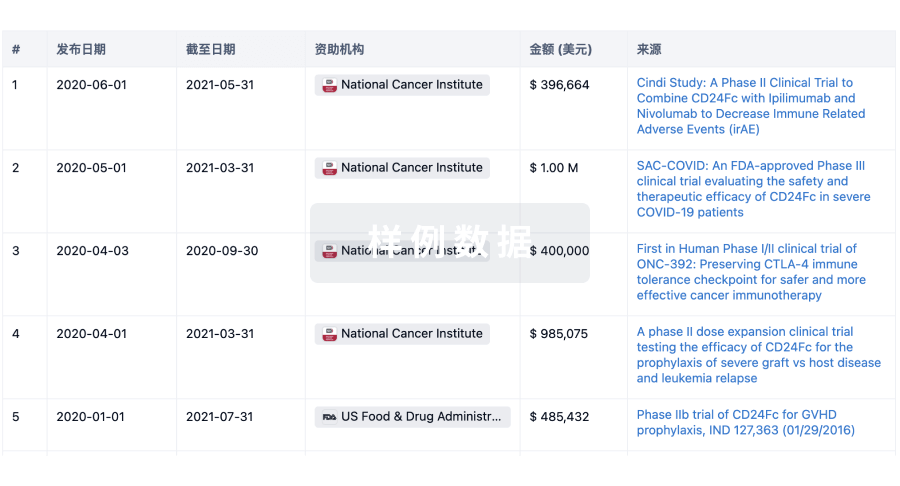
科研基金(NIH)
访问超过 200 万项资助和基金信息,以提升您的研究之旅。
登录
或
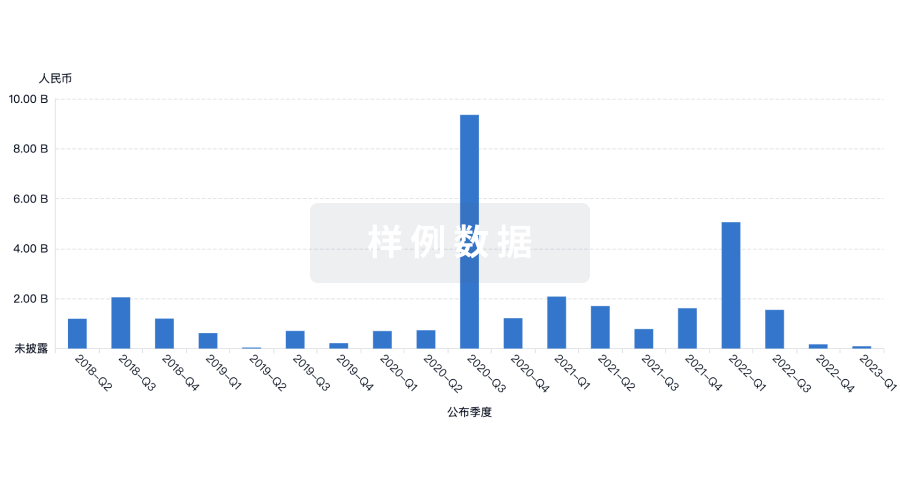
投资
深入了解从初创企业到成熟企业的最新公司投资动态。
登录
或
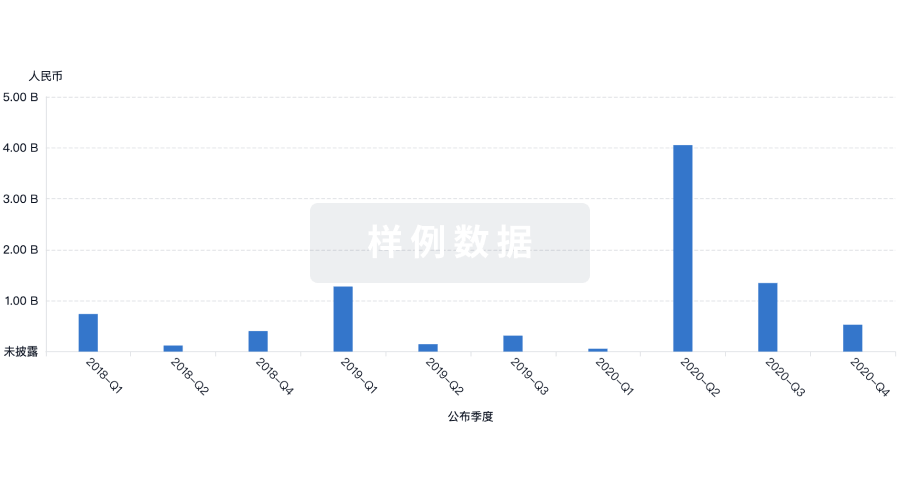
融资
发掘融资趋势以验证和推进您的投资机会。
登录
或
生物医药百科问答
全新生物医药AI Agent 覆盖科研全链路,让突破性发现快人一步
立即开始免费试用!
智慧芽新药情报库是智慧芽专为生命科学人士构建的基于AI的创新药情报平台,助您全方位提升您的研发与决策效率。
立即开始数据试用!
智慧芽新药库数据也通过智慧芽数据服务平台,以API或者数据包形式对外开放,助您更加充分利用智慧芽新药情报信息。
生物序列数据库
生物药研发创新
免费使用
化学结构数据库
小分子化药研发创新
免费使用