预约演示
更新于:2025-05-07
PD-A (Beech Tree Labs)
更新于:2025-05-07
概要
基本信息
非在研机构- |
权益机构- |
最高研发阶段临床前 |
首次获批日期- |
最高研发阶段(中国)- |
特殊审评- |
关联
100 项与 PD-A (Beech Tree Labs) 相关的临床结果
登录后查看更多信息
100 项与 PD-A (Beech Tree Labs) 相关的转化医学
登录后查看更多信息
100 项与 PD-A (Beech Tree Labs) 相关的专利(医药)
登录后查看更多信息
4
项与 PD-A (Beech Tree Labs) 相关的文献(医药)2002-05-01·Peritoneal Dialysis International: Journal of the International Society for Peritoneal Dialysis4区 · 医学
Peritoneal Function and Adequacy Calculations: Current Programs versus PD Adequest 2.0
4区 · 医学
Article
作者: Teixidó–Planas, Josep
2002-03-01·Zhongguo Zhong xi yi jie he za zhi Zhongguo Zhongxiyi jiehe zazhi = Chinese journal of integrated traditional and Western medicine
[The intervention effects of Angelica sinensis, Salvia miltiorrhiza and ligustrazine on peritoneal macrophages during peritoneal dialysis].
Article
作者: Li, Ji-cheng ; Yang, Ze-ran ; Zhang, Kai
2002-01-01·American Journal of Physiology-Regulatory, Integrative and Comparative Physiology2区 · 医学
Sodium appetite and Fos activation in serotonergic neurons
2区 · 医学
Article
作者: Johnson, Alan Kim ; Franchini, Lucia F. ; Vivas, Laura ; de Olmos, José
1
项与 PD-A (Beech Tree Labs) 相关的新闻(医药)2023-12-18
PD-1, or programmed cell death protein 1, is a crucial immune checkpoint receptor found on the surface of certain immune cells in the human body. Its primary role is to regulate the immune response and prevent excessive activation of immune cells, thereby maintaining immune homeostasis. PD-1 acts as a brake on the immune system by binding to its ligands, PD-L1 and PD-L2, which are expressed on various cells, including cancer cells. This interaction inhibits the immune response, allowing cancer cells to evade detection and destruction by the immune system. Targeting the PD-1 pathway has revolutionized cancer treatment, leading to the development of immune checkpoint inhibitors that unleash the immune system's ability to fight cancer.
PD-1 inhibitors are a group of checkpoint inhibitor anticancer drugs that block the activity of PD-1 and PD-L1 immune checkpoint proteins present on the surface of cells. The concept of blocking PD-1 and PD-L1 for the treatment of cancer was first published in 2001. The first clinical trial was launched in 2006, evaluating nivolumab. As of 2017, more than 500 clinical trials involving PD-1 and PD-L1 inhibitors have been conducted in more than 20,000 patients.
The analysis of the target PD-1 reveals a competitive landscape with multiple companies actively involved in the development of PD-1 inhibitors. Akeso, Inc., Bristol Myers Squibb Co., Merck & Co., Inc., and Innovent Biologics, Inc. are leading in terms of R&D progress. The approved indications for PD-1 inhibitors cover a wide range of cancers, including esophageal squamous cell carcinoma, Hodgkin's lymphoma, non-small cell lung cancer, melanoma, and hepatocellular carcinoma. Monoclonal antibodies are the most prominent drug type, followed by bispecific antibodies and biosimilars. China, the United States, and the European Union are the key locations for PD-1 inhibitor development, with China leading in terms of drug count. Overall, the target PD-1 shows a promising future in the pharmaceutical industry, with ongoing research and development efforts focused on expanding indications and improving treatment options for various cancers.
How do they work?PD-1 inhibitors are a type of medication used in biomedicine to treat certain types of cancer. PD-1 stands for programmed cell death protein 1, which is a protein found on the surface of immune cells called T cells. This protein plays a role in regulating the immune response by preventing T cells from attacking healthy cells in the body.
In some cases, cancer cells can exploit the PD-1 pathway to evade the immune system and continue growing. PD-1 inhibitors work by blocking the interaction between PD-1 and its ligands, which are molecules that bind to PD-1 and inhibit T cell activity. By blocking this interaction, PD-1 inhibitors help to unleash the immune system's ability to recognize and attack cancer cells.
By using PD-1 inhibitors, the immune system can be activated to target and destroy cancer cells more effectively. These inhibitors have shown promising results in the treatment of various types of cancer, including melanoma, lung cancer, kidney cancer, and bladder cancer.
It is important to note that PD-1 inhibitors can have side effects, as they can also affect the normal immune response and potentially lead to autoimmune reactions. Common side effects include fatigue, rash, diarrhea, and inflammation in various organs. However, the benefits of using PD-1 inhibitors in treating cancer often outweigh the potential risks.
Overall, PD-1 inhibitors are a valuable class of drugs in biomedicine that help enhance the immune system's ability to fight cancer by blocking the PD-1 pathway.
List of PD-1 InhibitorsThe currently marketed PD-1 inhibitors include:
RetifanlimabPucotenlimabCadonilimabCadonilimabNivolumab/RelatlimabZimberelimabPenpulimabDostarlimab-gxlyProlgolimabTislelizumabFor more information, please click on the image below.
What are PD-1 inhibitors used for?The approved indications for PD-1 inhibitors cover a wide range of cancers, including esophageal squamous cell carcinoma, Hodgkin's lymphoma, non-small cell lung cancer, melanoma, and hepatocellular carcinoma. For more information, please click on the image below to log in and search.
How to obtain the latest development progress of PD-1 inhibitors?In the Synapse database, you can keep abreast of the latest research and development advances of PD-1 inhibitors anywhere and anytime, daily or weekly, through the "Set Alert" function. Click on the image below to embark on a brand new journey of drug discovery!
100 项与 PD-A (Beech Tree Labs) 相关的药物交易
登录后查看更多信息
研发状态
10 条进展最快的记录, 后查看更多信息
登录
| 适应症 | 最高研发状态 | 国家/地区 | 公司 | 日期 |
|---|---|---|---|---|
| 帕金森病 | 临床前 | 美国 | 2023-12-11 |
登录后查看更多信息
临床结果
临床结果
适应症
分期
评价
查看全部结果
| 研究 | 分期 | 人群特征 | 评价人数 | 分组 | 结果 | 评价 | 发布日期 |
|---|
No Data | |||||||
登录后查看更多信息
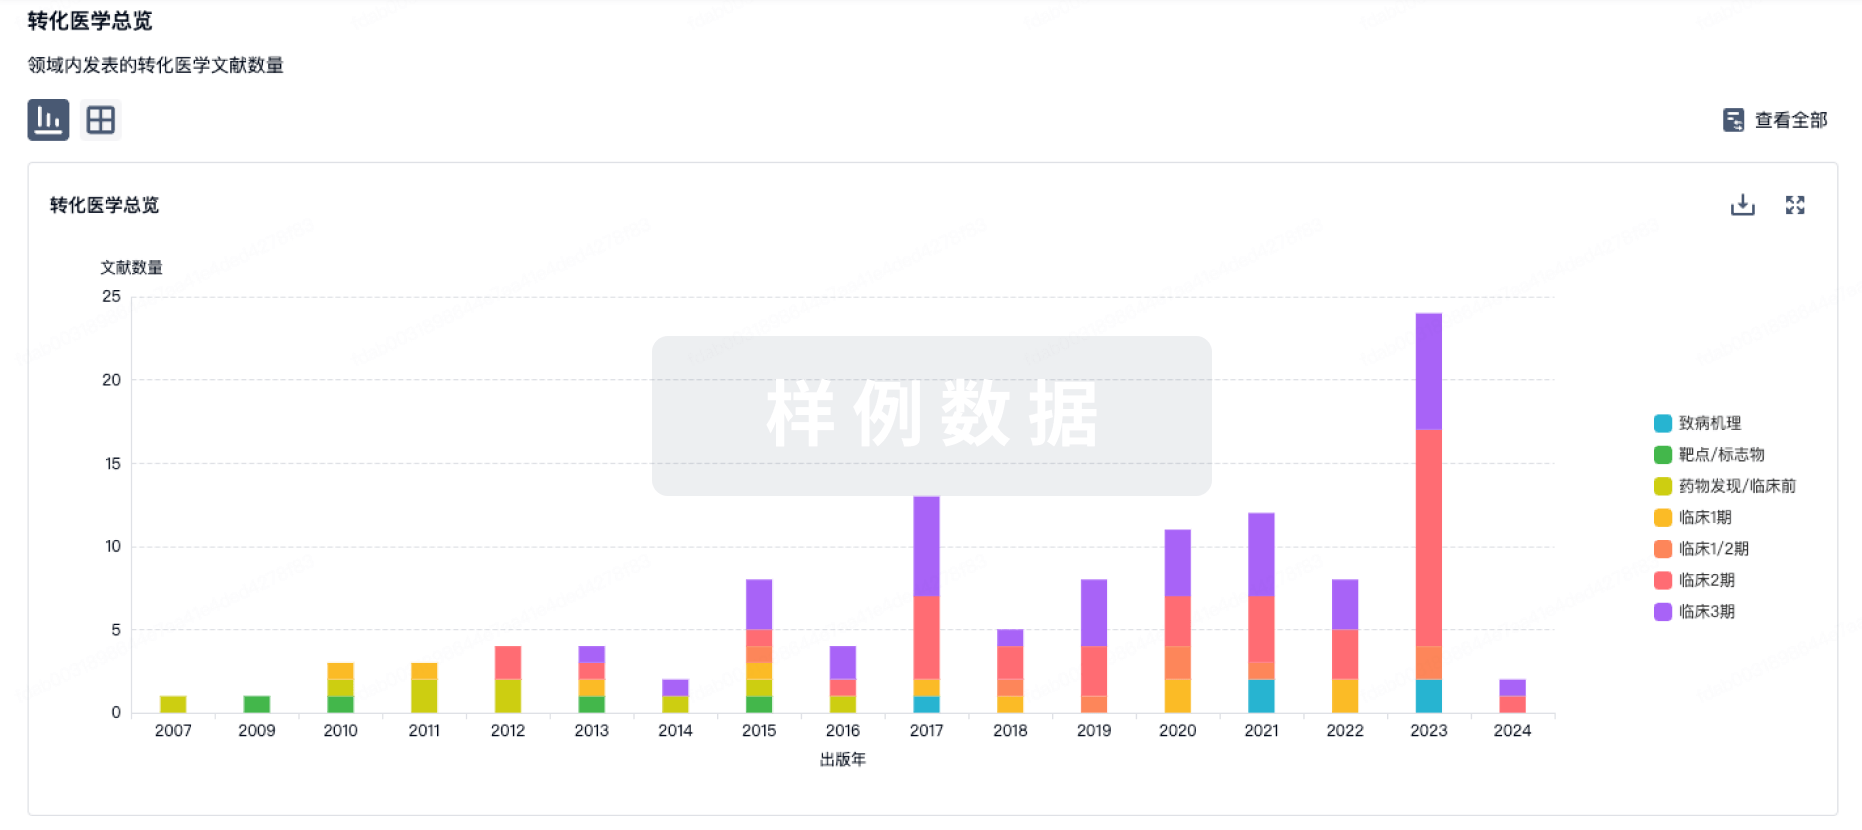
转化医学
使用我们的转化医学数据加速您的研究。
登录
或
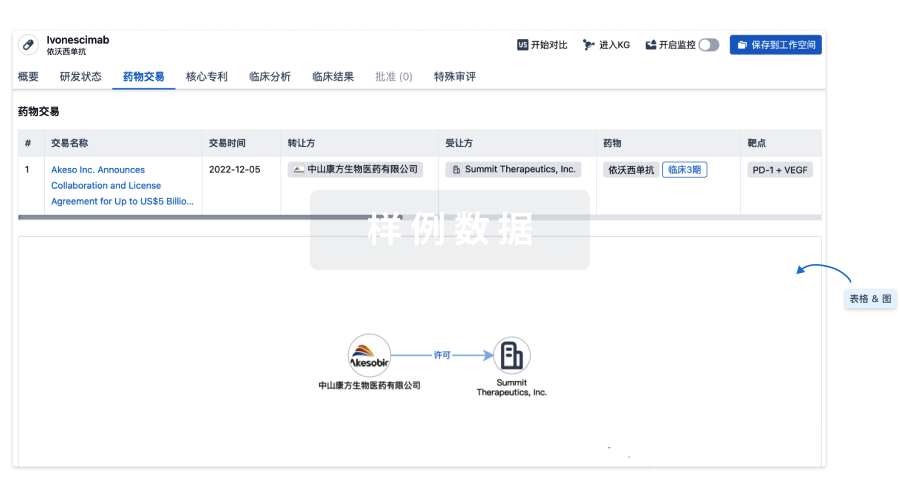
药物交易
使用我们的药物交易数据加速您的研究。
登录
或
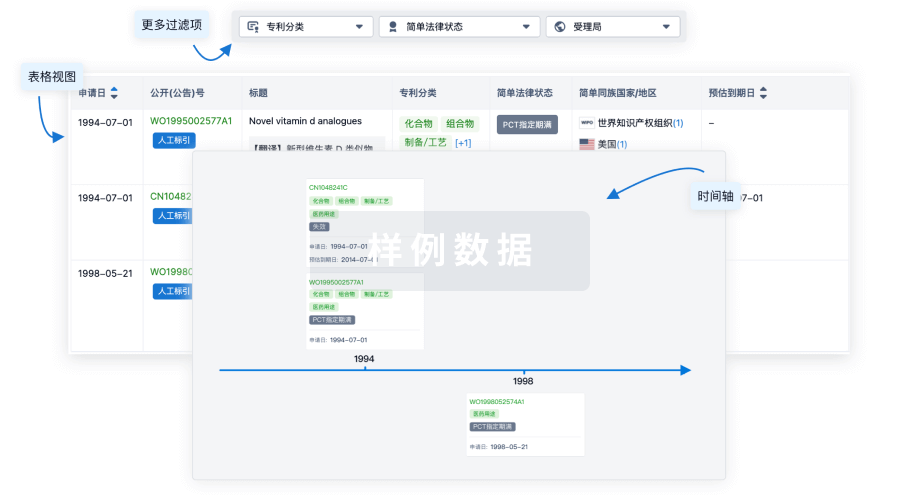
核心专利
使用我们的核心专利数据促进您的研究。
登录
或
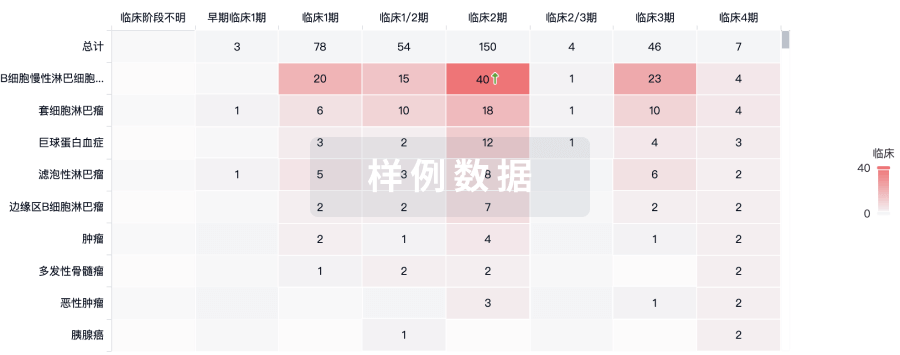
临床分析
紧跟全球注册中心的最新临床试验。
登录
或
批准
利用最新的监管批准信息加速您的研究。
登录
或
特殊审评
只需点击几下即可了解关键药物信息。
登录
或
生物医药百科问答
全新生物医药AI Agent 覆盖科研全链路,让突破性发现快人一步
立即开始免费试用!
智慧芽新药情报库是智慧芽专为生命科学人士构建的基于AI的创新药情报平台,助您全方位提升您的研发与决策效率。
立即开始数据试用!
智慧芽新药库数据也通过智慧芽数据服务平台,以API或者数据包形式对外开放,助您更加充分利用智慧芽新药情报信息。
生物序列数据库
生物药研发创新
免费使用
化学结构数据库
小分子化药研发创新
免费使用
