预约演示
The Medical Device Contract Manufacturing Market to grow at a CAGR of 11.19% from 2021 to 2026|Benchmark Electronics Inc., Celestica Inc., Flex Ltd., and more to emerge as key players -Technavio
2023-07-17
并购
NEW YORK, July 17, 2023 /PRNewswire/ -- The
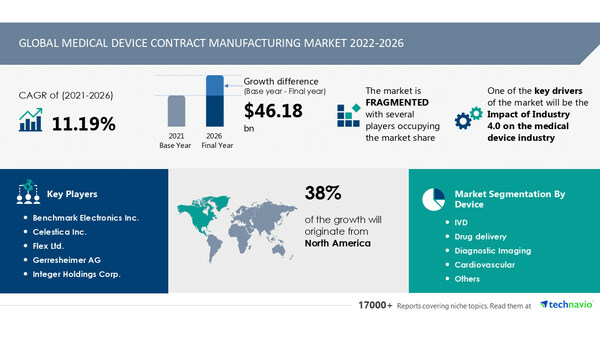
medical device contract manufacturing market share is expected to increase by
USD 46.18 billion from 2021 to 2026, and the market's growth momentum will accelerate at a
CAGR of 11.19%, according to Technavio
. The growing competition in the market is compelling vendors to adopt various growth strategies such as promotional activities and spending on advertisements to improve the visibility of their services. Technavio report analyzes the market's competitive landscape and offers information on several market vendors including - Benchmark Electronics Inc., Celestica Inc., Flex Ltd., Gerresheimer AG, Integer Holdings Corp., Jabil Inc., Kimball Electronics Inc., Nemera, Nipro Corp., Nordson Corp., Nortech Systems Inc., Plexus Corp., Recipharm AB, Sanmina Corp., Scientific Molding Corp. Ltd., TE Connectivity Ltd., Tecomet Inc., Teleflex Inc., Tessy Plastics Corp., and West Pharmaceutical Services Inc
. - Download Sample Report in minutes.
Continue Reading
Preview
来源: PRNewswire
Technavio has announced its latest market research report titled Global Medical Device Contract Manufacturing Market
Medical Device Contract Manufacturing Market Insights -
Vendors: 15+, Including Benchmark Electronics Inc., Celestica Inc., Flex Ltd., Gerresheimer AG, Integer Holdings Corp., Jabil Inc., Kimball Electronics Inc., Nemera, Nipro Corp., Nordson Corp., Nortech Systems Inc., Plexus Corp., Recipharm AB, Sanmina Corp., Scientific Molding Corp. Ltd., TE Connectivity Ltd., Tecomet Inc., Teleflex Inc., Tessy Plastics Corp., and West Pharmaceutical Services Inc., among others
Coverage: Parent market analysis; key drivers, major trends, and challenges; customer and vendor landscape; vendor product insights and recent developments; key vendors; and market positioning of vendors
Segments: Device (IVD, drug delivery, diagnostic imaging, cardiovascular, and others) and Geography (North America, Europe, Asia, and Rest of World (ROW))
To understand more about the medical device contract manufacturing market, request a sample report
Key Drivers - The impact of Industry 4.0 on the medical device industry is one of the key factors driving market growth. The increasing development and production of complex medical devices, which include pacemakers and implantable medical devices, are driving the innovations in Class III medical devices. Furthermore, many medical device manufacturing companies are facing challenges in producing Class III devices in high volumes because of the complex assembly and testing processes involved. Automated manufacturing and fabrication have become popular because of the complexity of manufacturing these devices. As a result, to overcome these challenges, medical device contract manufacturers are using industry 4.0 technologies which include cloud computing, machine-to-machine (M2M) communication, and network-physical systems. Hence, these advanced technologies are expected to drive market growth during the forecast period.
Major Trends- The shift from centralized to point-of-care testing is a major trend in the market. A centralized laboratory is where automated analytical test methods are used to detect target components. However, the various advantages point-of-care testing and diagnostic devices offer in comparison with conventional diagnostic procedures are affordability and ease of use and provide the rapid results needed for making quick decisions about medical diagnosis and treatment of diseases and conditions. The increased adoption of POCT devices is highly affected by the need to make healthcare more patient-centric. This includes organizing healthcare services around the patient rather than the provider. Furthermore, the growth of self-monitoring of blood glucose has been driven by the need for more convenient and effective healthcare services. Thus, these factors are expected to drive market growth during the forecast period.
Significant Challenges- Consolidation in the medical device industry is a significant challenge restricting market growth. Many major medical device manufacturers are highly investing in acquiring small and medium-sized specialist companies to improve their capabilities and increase their product portfolios. As a result, it will limit outsourcing to contract manufacturing organizations (CMOs) as these major players undertake the in-house manufacturing of medical devices.
For Instance, Linden Capital Partners (Linden) acquired Avalign Technologies, Inc, which is a contract manufacturer of precision implants, instruments, cutting tools, specialty instruments, and cases/trays. This acquisition helped the company to grow and significantly expand its capabilities in terms of its product portfolio. Similarly, many other medical device companies have also acquired CMOs to reduce the costs involved in contract manufacturing. Hence, these negative factors are expected to restrict market growth during the forecast period.
Drivers, & Challenges have an impact on market dynamics and can impact businesses. Find some insights from a
sample report!
The medical device contract manufacturing market report provides critical information and factual data, with a qualitative and quantitative study of the market based on market drivers and limitations as well as prospects.
Why Buy?
Add credibility to the strategy
Analyzes competitor's offerings
Get a holistic view of the market
Grow your profit margin with Technavio
- Buy the Report
What are the key data covered in this Medical Device Contract Manufacturing Market report?
CAGR of the market during the forecast period
Detailed information on factors that will drive the growth of the medical device contract manufacturing market between 2022 and 2026
Precise estimation of the size of the medical device contract manufacturing market and its contribution to the market with a focus on the parent market
Accurate predictions about upcoming trends and changes in consumer behavior
Growth of the medical device contract manufacturing market across North America, Europe, Asia, and the Rest of the World (ROW)
A thorough analysis of the market's competitive landscape and detailed information about vendors
Comprehensive analysis of factors that will challenge the growth of medical device contract manufacturing market vendors
Gain instant access to 17,000+ market research reports.
Technavio SUBSCRIPTION platform
Related Reports
The
ophthalmic handheld surgical instruments market size is estimated to grow by USD 360.3 million at a CAGR of 3.3% between 2022 and 2027. Furthermore, this report extensively covers market segmentation by end-user (hospitals, ophthalmic clinics, and others), product (ophthalmic knives, forceps, and scissors, and others), and geography (North America, Europe, Asia, and the Rest of the World (ROW)). The increasing detection of ophthalmic diseases is a key factor driving the market growth during the forecast period.
The
pain management devices market size is estimated to grow at a CAGR of 8.92% between 2022 and 2027. The market size is forecast to increase by USD 2,705.68 million. Furthermore, this report extensively covers market segmentation by application (neuropathic pain, musculoskeletal disorder, cancer, facial and migraine, and others), product (neurostimulation devices, infusion pumps, and ablation devices), and geography (North America, Asia, Europe, and Rest of World (ROW)). The growing demand for drug-free therapy is a key factor driving the market growth during the forecast period.
Table of Contents
1 Executive Summary
1.1 Market overview
Exhibit 01: Executive Summary – Chart on Market Overview
Exhibit 02: Executive Summary – Data Table on Market Overview
Exhibit 03: Executive Summary – Chart on Global Market Characteristics
Exhibit 04: Executive Summary – Chart on Market by Geography
Exhibit 05: Executive Summary – Chart on Market Segmentation by Device
Exhibit 06: Executive Summary – Chart on Incremental Growth
Exhibit 07: Executive Summary – Data Table on Incremental Growth
Exhibit 08: Executive Summary – Chart on Vendor Market Positioning
2 Market Landscape
2.1 Market ecosystem
Exhibit 09: Parent market
Exhibit 10: Market Characteristics
3 Market Sizing
3.1 Market definition
Exhibit 11: Offerings of vendors included in the market definition
3.2 Market segment analysis
Exhibit 12: Market segments
3.3 Market size 2021
3.4 Market outlook: Forecast for 2021-2026
Exhibit 13: Chart on Global - Market size and forecast 2021-2026 ($ million)
Exhibit 14: Data Table on Global - Market size and forecast 2021-2026 ($ million)
Exhibit 15: Chart on Global Market: Year-over-year growth 2021-2026 (%)
Exhibit 16: Data Table on Global Market: Year-over-year growth 2021-2026 (%)
4 Five Forces Analysis
4.1 Five forces summary
Exhibit 17: Five forces analysis - Comparison between 2021 and 2026
4.2 Bargaining power of buyers
Exhibit 18: Chart on Bargaining power of buyers – Impact of key factors 2021 and 2026
4.3 Bargaining power of suppliers
Exhibit 19: Bargaining power of suppliers – Impact of key factors in 2021 and 2026
4.4 Threat of new entrants
Exhibit 20: Threat of new entrants – Impact of key factors in 2021 and 2026
4.5 Threat of substitutes
Exhibit 21: Threat of substitutes – Impact of key factors in 2021 and 2026
4.6 Threat of rivalry
Exhibit 22: Threat of rivalry – Impact of key factors in 2021 and 2026
4.7 Market condition
Exhibit 23: Chart on Market condition - Five forces 2021 and 2026
5 Market Segmentation by Device
5.1 Market segments
Exhibit 24: Chart on Device - Market share 2021-2026 (%)
Exhibit 25: Data Table on Device - Market share 2021-2026 (%)
5.2 Comparison by Device
Exhibit 26: Chart on Comparison by Device
Exhibit 27: Data Table on Comparison by Device
5.3 IVD - Market size and forecast 2021-2026
Exhibit 28: Chart on IVD - Market size and forecast 2021-2026 ($ million)
Exhibit 29: Data Table on IVD - Market size and forecast 2021-2026 ($ million)
Exhibit 30: Chart on IVD - Year-over-year growth 2021-2026 (%)
Exhibit 31: Data Table on IVD - Year-over-year growth 2021-2026 (%)
5.4 Drug delivery - Market size and forecast 2021-2026
Exhibit 32: Chart on Drug delivery - Market size and forecast 2021-2026 ($ million)
Exhibit 33: Data Table on Drug delivery - Market size and forecast 2021-2026 ($ million)
Exhibit 34: Chart on Drug delivery - Year-over-year growth 2021-2026 (%)
Exhibit 35: Data Table on Drug delivery - Year-over-year growth 2021-2026 (%)
5.5 Diagnostic Imaging - Market size and forecast 2021-2026
Exhibit 36: Chart on Diagnostic Imaging - Market size and forecast 2021-2026 ($ million)
Exhibit 37: Data Table on Diagnostic Imaging - Market size and forecast 2021-2026 ($ million)
Exhibit 38: Chart on Diagnostic Imaging - Year-over-year growth 2021-2026 (%)
Exhibit 39: Data Table on Diagnostic Imaging - Year-over-year growth 2021-2026 (%)
5.6 Cardiovascular - Market size and forecast 2021-2026
Exhibit 40: Chart on Cardiovascular - Market size and forecast 2021-2026 ($ million)
Exhibit 41: Data Table on Cardiovascular - Market size and forecast 2021-2026 ($ million)
Exhibit 42: Chart on Cardiovascular - Year-over-year growth 2021-2026 (%)
Exhibit 43: Data Table on Cardiovascular - Year-over-year growth 2021-2026 (%)
5.7 Others - Market size and forecast 2021-2026
Exhibit 44: Chart on Others - Market size and forecast 2021-2026 ($ million)
Exhibit 45: Data Table on Others - Market size and forecast 2021-2026 ($ million)
Exhibit 46: Chart on Others - Year-over-year growth 2021-2026 (%)
Exhibit 47: Data Table on Others - Year-over-year growth 2021-2026 (%)
5.8 Market opportunity by Device
Exhibit 48: Market opportunity by Device ($ million)
6 Customer Landscape
6.1 Customer landscape overview
Exhibit 49: Analysis of price sensitivity, lifecycle, customer purchase basket, adoption rates, and purchase criteria
7 Geographic Landscape
7.1 Geographic segmentation
Exhibit 50: Chart on Market share by geography 2021-2026 (%)
Exhibit 51: Data Table on Market share by geography 2021-2026 (%)
7.2 Geographic comparison
Exhibit 52: Chart on Geographic comparison
Exhibit 53: Data Table on Geographic comparison
7.3 North America - Market size and forecast 2021-2026
Exhibit 54: Chart on North America - Market size and forecast 2021-2026 ($ million)
Exhibit 55: Data Table on North America - Market size and forecast 2021-2026 ($ million)
Exhibit 56: Chart on North America - Year-over-year growth 2021-2026 (%)
Exhibit 57: Data Table on North America - Year-over-year growth 2021-2026 (%)
7.4 Europe - Market size and forecast 2021-2026
Exhibit 58: Chart on Europe - Market size and forecast 2021-2026 ($ million)
Exhibit 59: Data Table on Europe - Market size and forecast 2021-2026 ($ million)
Exhibit 60: Chart on Europe - Year-over-year growth 2021-2026 (%)
Exhibit 61: Data Table on Europe - Year-over-year growth 2021-2026 (%)
7.5 Asia - Market size and forecast 2021-2026
Exhibit 62: Chart on Asia - Market size and forecast 2021-2026 ($ million)
Exhibit 63: Data Table on Asia - Market size and forecast 2021-2026 ($ million)
Exhibit 64: Chart on Asia - Year-over-year growth 2021-2026 (%)
Exhibit 65: Data Table on Asia - Year-over-year growth 2021-2026 (%)
7.6 Rest of World (ROW) - Market size and forecast 2021-2026
Exhibit 66: Chart on Rest of World (ROW) - Market size and forecast 2021-2026 ($ million)
Exhibit 67: Data Table on Rest of World (ROW) - Market size and forecast 2021-2026 ($ million)
Exhibit 68: Chart on Rest of World (ROW) - Year-over-year growth 2021-2026 (%)
Exhibit 69: Data Table on Rest of World (ROW) - Year-over-year growth 2021-2026 (%)
7.7 US - Market size and forecast 2021-2026
Exhibit 70: Chart on US - Market size and forecast 2021-2026 ($ million)
Exhibit 71: Data Table on US - Market size and forecast 2021-2026 ($ million)
Exhibit 72: Chart on US - Year-over-year growth 2021-2026 (%)
Exhibit 73: Data Table on US - Year-over-year growth 2021-2026 (%)
7.8 Germany - Market size and forecast 2021-2026
Exhibit 74: Chart on Germany - Market size and forecast 2021-2026 ($ million)
Exhibit 75: Data Table on Germany - Market size and forecast 2021-2026 ($ million)
Exhibit 76: Chart on Germany - Year-over-year growth 2021-2026 (%)
Exhibit 77: Data Table on Germany - Year-over-year growth 2021-2026 (%)
7.9 Canada - Market size and forecast 2021-2026
Exhibit 78: Chart on Canada - Market size and forecast 2021-2026 ($ million)
Exhibit 79: Data Table on Canada - Market size and forecast 2021-2026 ($ million)
Exhibit 80: Chart on Canada - Year-over-year growth 2021-2026 (%)
Exhibit 81: Data Table on Canada - Year-over-year growth 2021-2026 (%)
7.10 China - Market size and forecast 2021-2026
Exhibit 82: Chart on China - Market size and forecast 2021-2026 ($ million)
Exhibit 83: Data Table on China - Market size and forecast 2021-2026 ($ million)
Exhibit 84: Chart on China - Year-over-year growth 2021-2026 (%)
Exhibit 85: Data Table on China - Year-over-year growth 2021-2026 (%)
7.11 Japan - Market size and forecast 2021-2026
Exhibit 86: Chart on Japan - Market size and forecast 2021-2026 ($ million)
Exhibit 87: Data Table on Japan - Market size and forecast 2021-2026 ($ million)
Exhibit 88: Chart on Japan - Year-over-year growth 2021-2026 (%)
Exhibit 89: Data Table on Japan - Year-over-year growth 2021-2026 (%)
7.12 Republic of Korea - Market size and forecast 2021-2026
Exhibit 90: Chart on Republic of Korea - Market size and forecast 2021-2026 ($ million)
Exhibit 91: Data Table on Republic of Korea - Market size and forecast 2021-2026 ($ million)
Exhibit 92: Chart on Republic of Korea - Year-over-year growth 2021-2026 (%)
Exhibit 93: Data Table on Republic of Korea - Year-over-year growth 2021-2026 (%)
7.13 Market opportunity by geography
Exhibit 94: Market opportunity by geography ($ million)
8 Drivers, Challenges, and Trends
8.1 Market drivers
8.2 Market challenges
8.3 Impact of drivers and challenges
Exhibit 95: Impact of drivers and challenges in 2021 and 2026
8.4 Market trends
9 Vendor Landscape
9.1 Overview
9.2 Vendor landscape
Exhibit 96: Overview on Criticality of inputs and Factors of differentiation
9.3 Landscape disruption
Exhibit 97: Overview on factors of disruption
9.4 Industry risks
Exhibit 98: Impact of key risks on business
10 Vendor Analysis
10.1 Vendors covered
Exhibit 99: Vendors covered
10.2 Market positioning of vendors
Exhibit 100: Matrix on vendor position and classification
10.3 Benchmark Electronics Inc.
Exhibit 101: Benchmark Electronics Inc. - Overview
Exhibit 102: Benchmark Electronics Inc. - Business segments
Exhibit 103: Benchmark Electronics Inc. - Key news
Exhibit 104: Benchmark Electronics Inc. - Key offerings
Exhibit 105: Benchmark Electronics Inc. - Segment focus
10.4 Celestica Inc.
Exhibit 106: Celestica Inc. - Overview
Exhibit 107: Celestica Inc. - Business segments
Exhibit 108: Celestica Inc. - Key news
Exhibit 109: Celestica Inc. - Key offerings
Exhibit 110: Celestica Inc. - Segment focus
10.5 Flex Ltd.
Exhibit 111: Flex Ltd. - Overview
Exhibit 112: Flex Ltd. - Business segments
Exhibit 113: Flex Ltd. - Key news
Exhibit 114: Flex Ltd. - Key offerings
Exhibit 115: Flex Ltd. - Segment focus
10.6 Gerresheimer AG
Exhibit 116: Gerresheimer AG - Overview
Exhibit 117: Gerresheimer AG - Business segments
Exhibit 118: Gerresheimer AG - Key news
Exhibit 119: Gerresheimer AG - Key offerings
Exhibit 120: Gerresheimer AG - Segment focus
Exhibit 121: Integer Holdings Corp. - Overview
Exhibit 122: Integer Holdings Corp. - Business segments
Exhibit 123: Integer Holdings Corp. - Key news
Exhibit 124: Integer Holdings Corp. - Key offerings
Exhibit 125: Integer Holdings Corp. - Segment focus
10.8 Jabil Inc.
Exhibit 126: Jabil Inc. - Overview
Exhibit 127: Jabil Inc. - Business segments
Exhibit 128: Jabil Inc. - Key offerings
Exhibit 129: Jabil Inc. - Segment focus
10.9 Nipro Corp.
Exhibit 130: Nipro Corp. - Overview
Exhibit 131: Nipro Corp. - Business segments
Exhibit 132: Nipro Corp. - Key offerings
Exhibit 133: Nipro Corp. - Segment focus
10.10 Plexus Corp.
Exhibit 134: Plexus Corp. - Overview
Exhibit 135: Plexus Corp. - Business segments
Exhibit 136: Plexus Corp. - Key news
Exhibit 137: Plexus Corp. - Key offerings
Exhibit 138: Plexus Corp. - Segment focus
10.11 Sanmina Corp.
Exhibit 139: Sanmina Corp. - Overview
Exhibit 140: Sanmina Corp. - Business segments
Exhibit 141: Sanmina Corp. - Key offerings
Exhibit 142: Sanmina Corp. - Segment focus
10.12 TE Connectivity Ltd.
Exhibit 143: TE Connectivity Ltd. - Overview
Exhibit 144: TE Connectivity Ltd. - Business segments
Exhibit 145: TE Connectivity Ltd. - Key offerings
Exhibit 146: TE Connectivity Ltd. - Segment focus
11 Appendix
11.1 Scope of the report
11.2 Inclusions and exclusions checklist
Exhibit 147: Inclusions checklist
Exhibit 148: Exclusions checklist
11.3 Currency conversion rates for US$
Exhibit 149: Currency conversion rates for US$
11.4 Research methodology
Exhibit 150: Research methodology
Exhibit 151: Validation techniques employed for market sizing
Exhibit 152: Information sources
11.5 List of abbreviations
Exhibit 153: List of abbreviations
About Us
Technavio is a leading global technology research and advisory company. Their research and analysis focus on emerging market trends and provide actionable insights to help businesses identify market opportunities and develop effective strategies to optimize their market positions. With over 500 specialized analysts, Technavio's report library consists of more than 17,000 reports and counting, covering 800 technologies, spanning 50 countries. Their client base consists of enterprises of all sizes, including more than 100 Fortune 500 companies. This growing client base relies on Technavio's comprehensive coverage, extensive research, and actionable market insights to identify opportunities in existing and potential markets and assess their competitive positions within changing market scenarios.
Contact
Technavio Research
Jesse Maida
Media & Marketing Executive
US: +1 844 364 1100
UK: +44 203 893 3200
Email: [email protected]
Website: www.technavio.com
SOURCE Technavio
更多内容,请访问原始网站
文中所述内容并不反映新药情报库及其所属公司任何意见及观点,如有版权侵扰或错误之处,请及时联系我们,我们会在24小时内配合处理。
靶点
-药物
-生物医药百科问答
全新生物医药AI Agent 覆盖科研全链路,让突破性发现快人一步


立即开始免费试用!
智慧芽新药情报库是智慧芽专为生命科学人士构建的基于AI的创新药情报平台,助您全方位提升您的研发与决策效率。
立即开始数据试用!
智慧芽新药库数据也通过智慧芽数据服务平台,以API或者数据包形式对外开放,助您更加充分利用智慧芽新药情报信息。