预约演示
Human Microbiome Therapeutics Market size to grow at a CAGR of 30.11% from 2022 to 2027 | Increase in industry-academia collaboration for the development of novel therapeutics is a major trend- Technavio
2023-08-02
NEW YORK, Aug. 2, 2023 /PRNewswire/ -- The
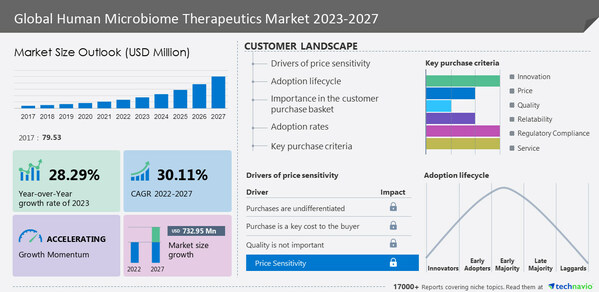
human microbiome therapeutics market size is estimated to increase by
USD 732.95 million from 2022 to 2027, at a
CAGR of 30.11%, according to a recent market study by Technavio. This report also offers a 5-year historical (2017-2021) data projection of market size, segmentation, and region.
Discover some insights on market size before buying the full report -Request a sample report
Human Microbiome Therapeutics Market 2023-2027 – Vendor Scope
Continue Reading
Preview
来源: PRNewswire
Technavio has announced its latest market research report titled Global Human Microbiome Therapeutics Market
The human microbiome therapeutics market report also offers information on the criticality of inputs, R&D, CAPEX, technology, and products of 15 companies listed below -
4D Pharma Plc, BiomX Inc., Eligo Bioscience, ENTEROME SA, Evelo Biosciences Inc., Evogene Ltd., Ferring BV, Finch Therapeutics Group Inc., Flightpath Biosciences, Johnson and Johnson Services Inc., MaaT Pharma, Microbiotica Ltd., OptiBiotix Health Plc, PureTech Health Plc, Second Genome Therapeutics, Seres Therapeutics Inc., Synlogic Inc., Takeda Pharmaceutical Co. Ltd., YSOPIA Bioscience, and Locus Biosciences Inc.
Download a Sample
Rep
ort
Chart & Data Table on 5-Year Historic (2017-2021) Market Size, Comparative Analysis of Segments, and Y-O-Y Growth of Human microbiome therapeutics market
Human Microbiome Therapeutics Market 2023-2027: Segmentation
The market is segmented by product (probiotics, prebiotics, medical foods, and prescription drugs), application (gastrointestinal disorders, infectious diseases, and others), and geography (North America, Europe, Asia, and the Rest of the World (ROW))
The market share of the
probiotics segment is estimated to witness significant growth during the forecast period. Probiotics are living microbes that, when given in sufficient quantities, boost the host's health. Probiotics are bacteria and yeast that support a balanced microbial environment in human intestines. They are generally found in yogurt and other fermented foods. Additionally, they improve the immune system and shield lipids and proteins from oxidative damage. Hence, these factors are expected to drive segment growth during the forecast period.
North America is estimated to contribute
41% to the growth of the global market during the forecast period. However, the region is expected to be slower than Europe and Asia. The market in the region is driven by factors such as significant investments in R & D for the development of novel therapeutic procedures and a high prevalence of gastrointestinal, metabolic, and immunological illnesses. Hence, these factors are expected to drive segment growth during the forecast period.
To procure the data - Buy the report!
Human Microbiome Therapeutics Market 2023-2027 –
Market Dynamics
Key Driver
The growing prevalence of chronic diseases is a key factor driving market growth. These diseases also lead to the development of other serious diseases which include diabetes, hypertension, and obesity. Hypertension can also be caused by improper lifestyle choices and genetic factors. High blood pressure usually causes no symptoms. In addition, studies have shown that obese middle-aged men have a 50 to 60% higher risk of heart failure than nonobese middle-aged men. Hence, these factors are expected to drive market growth during the forecast period.
Major Trends
The increase in industry-academia collaboration for the development of novel therapeutics is a major trend in the market. To support the R&D of novel medicines for the treatment of diabetes, the major companies in the global pharmaceutical drugs industry are increasingly extending their assistance to academic institutions. Collaborations between businesses and academic institutions make it possible to combine the marketing knowledge of pharmaceutical companies with the scientific competence of academic organizations. Hence, this trend is expected to drive market growth during the forecast period.
Significant Challenges
The indiscriminate use of antibiotics is a significant challenge restricting market growth. In primary care, where viruses typically cause infections, overprescribing of antibiotics is a problem. The already overcrowded healthcare system incurs additional costs because of antibiotic resistance because it reduces both the number of medications that may be used for treatment and the long-term efficacy of the currently available drugs. But indiscriminate antibiotic use harms our body's natural flora and interferes with the effectiveness of microbial medicinal medicines. Hence, the above-mentioned factors are expected to restrict market growth during the forecast period.
For Insights on the market dynamics & segmentations VIEW PDF SAMPLE!
What are the key data covered in this Human Microbiome Therapeutics Market report?
CAGR of the market during the forecast period
Detailed information on factors that will drive the growth of the human microbiome therapeutics market between 2023 and 2027
Precise estimation of the size of the human microbiome therapeutics market and its contribution to the market with a focus on the parent market
Accurate predictions about upcoming trends and changes in consumer behavior
Growth of the human microbiome therapeutics market across North America, Europe, Asia, and Rest of the World (ROW)
A thorough analysis of the market's competitive landscape and detailed information about companies
Comprehensive analysis of factors that will challenge the growth of human microbiome therapeutics market companies.
Gain instant access to 17,000+ market research reports.
Technavio's SUBSCRIPTION platform
Related Reports
The
vertigo drugs market is estimated to grow by USD 551.42 million at a CAGR of 5.58% between 2022 and 2027. Furthermore, this report extensively covers market segmentation by type (vertigo, and central vertigo), distribution channel (offline and online), and geography (North America, Europe, Asia, and the Rest of the World (ROW)). Integration of digital health solutions in vertigo is a major trend in the market.
The
specialty pharmaceuticals market is estimated to grow by USD 331.12 billion at a CAGR of 12.59% between 2022 and 2027. Furthermore, this report extensively covers market segmentation by application (oncology, multiple sclerosis, inflammatory conditions, infectious diseases, and others), distribution channel (offline and online), and geography (North America, Europe, Asia, and the Rest of the World (ROW)). The increasing demand for R&D due to government healthcare expenditure is a key factor driving market growth during the forecast period.
Table of Contents
1 Executive Summary
1.1 Market Overview
Exhibit 01: Executive Summary – Chart on Market Overview
Exhibit 02: Executive Summary – Data Table on Market Overview
Exhibit 03: Executive Summary – Chart on Global Market Characteristics
Exhibit 04: Executive Summary – Chart on Market by Geography
Exhibit 05: Executive Summary – Chart on Market Segmentation by Product
Exhibit 06: Executive Summary – Chart on Market Segmentation by Application
Exhibit 07: Executive Summary – Chart on Incremental Growth
Exhibit 08: Executive Summary – Data Table on Incremental Growth
Exhibit 09: Executive Summary – Chart on Vendor Market Positioning
2 Market Landscape
2.1 Market ecosystem
Exhibit 10: Parent market
Exhibit 11: Market Characteristics
3 Market Sizing
3.1 Market definition
Exhibit 12: Offerings of companies included in the market definition
3.2 Market segment analysis
Exhibit 13: Market segments
3.3 Market size 2022
3.4 Market outlook: Forecast for 2022-2027
Exhibit 14: Chart on Global - Market size and forecast 2022-2027 ($ million)
Exhibit 15: Data Table on Global - Market size and forecast 2022-2027 ($ million)
Exhibit 16: Chart on Global Market: Year-over-year growth 2022-2027 (%)
Exhibit 17: Data Table on Global Market: Year-over-year growth 2022-2027 (%)
4 Historic Market Size
4.1 Global human microbiome therapeutics market 2017 - 2021
Exhibit 18: Historic Market Size – Data Table on global human microbiome therapeutics market 2017 - 2021 ($ million)
4.2 Product Segment Analysis 2017 - 2021
Exhibit 19: Historic Market Size – Product Segment 2017 - 2021 ($ million)
4.3 Application Segment Analysis 2017 - 2021
Exhibit 20: Historic Market Size – Application Segment 2017 - 2021 ($ million)
4.4 Geography Segment Analysis 2017 - 2021
Exhibit 21: Historic Market Size – Geography Segment 2017 - 2021 ($ million)
4.5 Country Segment Analysis 2017 - 2021
Exhibit 22: Historic Market Size – Country Segment 2017 - 2021 ($ million)
5 Five Forces Analysis
5.1 Five forces summary
Exhibit 23: Five forces analysis - Comparison between 2022 and 2027
5.2 Bargaining power of buyers
Exhibit 24: Chart on Bargaining power of buyers – Impact of key factors 2022 and 2027
5.3 Bargaining power of suppliers
Exhibit 25: Bargaining power of suppliers – Impact of key factors in 2022 and 2027
5.4 Threat of new entrants
Exhibit 26: Threat of new entrants – Impact of key factors in 2022 and 2027
5.5 Threat of substitutes
Exhibit 27: Threat of substitutes – Impact of key factors in 2022 and 2027
5.6 Threat of rivalry
Exhibit 28: Threat of rivalry – Impact of key factors in 2022 and 2027
5.7 Market condition
Exhibit 29: Chart on Market condition - Five forces 2022 and 2027
6 Market Segmentation by Product
6.1 Market segments
Exhibit 30: Chart on Product - Market share 2022-2027 (%)
Exhibit 31: Data Table on Product - Market share 2022-2027 (%)
6.2 Comparison by Product
Exhibit 32: Chart on Comparison by Product
Exhibit 33: Data Table on Comparison by Product
6.3 Probiotics - Market size and forecast 2022-2027
Exhibit 34: Chart on Probiotics - Market size and forecast 2022-2027 ($ million)
Exhibit 35: Data Table on Probiotics - Market size and forecast 2022-2027 ($ million)
Exhibit 36: Chart on Probiotics - Year-over-year growth 2022-2027 (%)
Exhibit 37: Data Table on Probiotics - Year-over-year growth 2022-2027 (%)
6.4 Prebiotics - Market size and forecast 2022-2027
Exhibit 38: Chart on Prebiotics - Market size and forecast 2022-2027 ($ million)
Exhibit 39: Data Table on Prebiotics - Market size and forecast 2022-2027 ($ million)
Exhibit 40: Chart on Prebiotics - Year-over-year growth 2022-2027 (%)
Exhibit 41: Data Table on Prebiotics - Year-over-year growth 2022-2027 (%)
6.5 Medical foods - Market size and forecast 2022-2027
Exhibit 42: Chart on Medical foods - Market size and forecast 2022-2027 ($ million)
Exhibit 43: Data Table on Medical foods - Market size and forecast 2022-2027 ($ million)
Exhibit 44: Chart on Medical foods - Year-over-year growth 2022-2027 (%)
Exhibit 45: Data Table on Medical foods - Year-over-year growth 2022-2027 (%)
6.6 Prescription drugs - Market size and forecast 2022-2027
Exhibit 46: Chart on Prescription drugs - Market size and forecast 2022-2027 ($ million)
Exhibit 47: Data Table on Prescription drugs - Market size and forecast 2022-2027 ($ million)
Exhibit 48: Chart on Prescription drugs - Year-over-year growth 2022-2027 (%)
Exhibit 49: Data Table on Prescription drugs - Year-over-year growth 2022-2027 (%)
6.7 Market opportunity by Product
Exhibit 50: Market opportunity by Product ($ million)
Exhibit 51: Data Table on Market opportunity by Product ($ million)
7 Market Segmentation by Application
7.1 Market segments
Exhibit 52: Chart on Application - Market share 2022-2027 (%)
Exhibit 53: Data Table on Application - Market share 2022-2027 (%)
7.2 Comparison by Application
Exhibit 54: Chart on Comparison by Application
Exhibit 55: Data Table on Comparison by Application
7.3 Gastrointestinal disorders - Market size and forecast 2022-2027
Exhibit 56: Chart on Gastrointestinal disorders - Market size and forecast 2022-2027 ($ million)
Exhibit 57: Data Table on Gastrointestinal disorders - Market size and forecast 2022-2027 ($ million)
Exhibit 58: Chart on Gastrointestinal disorders - Year-over-year growth 2022-2027 (%)
Exhibit 59: Data Table on Gastrointestinal disorders - Year-over-year growth 2022-2027 (%)
7.4 Infectious diseases - Market size and forecast 2022-2027
Exhibit 60: Chart on Infectious diseases - Market size and forecast 2022-2027 ($ million)
Exhibit 61: Data Table on Infectious diseases - Market size and forecast 2022-2027 ($ million)
Exhibit 62: Chart on Infectious diseases - Year-over-year growth 2022-2027 (%)
Exhibit 63: Data Table on Infectious diseases - Year-over-year growth 2022-2027 (%)
7.5 Others - Market size and forecast 2022-2027
Exhibit 64: Chart on Others - Market size and forecast 2022-2027 ($ million)
Exhibit 65: Data Table on Others - Market size and forecast 2022-2027 ($ million)
Exhibit 66: Chart on Others - Year-over-year growth 2022-2027 (%)
Exhibit 67: Data Table on Others - Year-over-year growth 2022-2027 (%)
7.6 Market opportunity by Application
Exhibit 68: Market opportunity by Application ($ million)
Exhibit 69: Data Table on Market opportunity by Application ($ million)
8 Customer Landscape
8.1 Customer landscape overview
Exhibit 70: Analysis of price sensitivity, lifecycle, customer purchase basket, adoption rates, and purchase criteria
9 Geographic Landscape
9.1 Geographic segmentation
Exhibit 71: Chart on Market share by geography 2022-2027 (%)
Exhibit 72: Data Table on Market share by geography 2022-2027 (%)
9.2 Geographic comparison
Exhibit 73: Chart on Geographic comparison
Exhibit 74: Data Table on Geographic comparison
9.3 North America - Market size and forecast 2022-2027
Exhibit 75: Chart on North America - Market size and forecast 2022-2027 ($ million)
Exhibit 76: Data Table on North America - Market size and forecast 2022-2027 ($ million)
Exhibit 77: Chart on North America - Year-over-year growth 2022-2027 (%)
Exhibit 78: Data Table on North America - Year-over-year growth 2022-2027 (%)
9.4 Europe - Market size and forecast 2022-2027
Exhibit 79: Chart on Europe - Market size and forecast 2022-2027 ($ million)
Exhibit 80: Data Table on Europe - Market size and forecast 2022-2027 ($ million)
Exhibit 81: Chart on Europe - Year-over-year growth 2022-2027 (%)
Exhibit 82: Data Table on Europe - Year-over-year growth 2022-2027 (%)
9.5 Asia - Market size and forecast 2022-2027
Exhibit 83: Chart on Asia - Market size and forecast 2022-2027 ($ million)
Exhibit 84: Data Table on Asia - Market size and forecast 2022-2027 ($ million)
Exhibit 85: Chart on Asia - Year-over-year growth 2022-2027 (%)
Exhibit 86: Data Table on Asia - Year-over-year growth 2022-2027 (%)
9.6 Rest of World (ROW) - Market size and forecast 2022-2027
Exhibit 87: Chart on Rest of World (ROW) - Market size and forecast 2022-2027 ($ million)
Exhibit 88: Data Table on Rest of World (ROW) - Market size and forecast 2022-2027 ($ million)
Exhibit 89: Chart on Rest of World (ROW) - Year-over-year growth 2022-2027 (%)
Exhibit 90: Data Table on Rest of World (ROW) - Year-over-year growth 2022-2027 (%)
9.7 US - Market size and forecast 2022-2027
Exhibit 91: Chart on US - Market size and forecast 2022-2027 ($ million)
Exhibit 92: Data Table on US - Market size and forecast 2022-2027 ($ million)
Exhibit 93: Chart on US - Year-over-year growth 2022-2027 (%)
Exhibit 94: Data Table on US - Year-over-year growth 2022-2027 (%)
9.8 Germany - Market size and forecast 2022-2027
Exhibit 95: Chart on Germany - Market size and forecast 2022-2027 ($ million)
Exhibit 96: Data Table on Germany - Market size and forecast 2022-2027 ($ million)
Exhibit 97: Chart on Germany - Year-over-year growth 2022-2027 (%)
Exhibit 98: Data Table on Germany - Year-over-year growth 2022-2027 (%)
9.9 France - Market size and forecast 2022-2027
Exhibit 99: Chart on France - Market size and forecast 2022-2027 ($ million)
Exhibit 100: Data Table on France - Market size and forecast 2022-2027 ($ million)
Exhibit 101: Chart on France - Year-over-year growth 2022-2027 (%)
Exhibit 102: Data Table on France - Year-over-year growth 2022-2027 (%)
9.10 UK - Market size and forecast 2022-2027
Exhibit 103: Chart on UK - Market size and forecast 2022-2027 ($ million)
Exhibit 104: Data Table on UK - Market size and forecast 2022-2027 ($ million)
Exhibit 105: Chart on UK - Year-over-year growth 2022-2027 (%)
Exhibit 106: Data Table on UK - Year-over-year growth 2022-2027 (%)
9.11 Japan - Market size and forecast 2022-2027
Exhibit 107: Chart on Japan - Market size and forecast 2022-2027 ($ million)
Exhibit 108: Data Table on Japan - Market size and forecast 2022-2027 ($ million)
Exhibit 109: Chart on Japan - Year-over-year growth 2022-2027 (%)
Exhibit 110: Data Table on Japan - Year-over-year growth 2022-2027 (%)
9.12 Market opportunity by geography
Exhibit 111: Market opportunity by geography ($ million)
Exhibit 112: Data Tables on Market opportunity by geography ($ million)
10 Drivers, Challenges, and Trends
10.1 Market drivers
10.2 Market challenges
10.3 Impact of drivers and challenges
Exhibit 113: Impact of drivers and challenges in 2022 and 2027
10.4 Market trends
11 Vendor Landscape
11.1 Overview
11.2 Vendor landscape
Exhibit 114: Overview on Criticality of inputs and Factors of differentiation
11.3 Landscape disruption
Exhibit 115: Overview on factors of disruption
11.4 Industry risks
Exhibit 116: Impact of key risks on business
12 Vendor Analysis
12.1 Companies covered
Exhibit 117: Companiescovered
12.2 Market positioning of companies
Exhibit 118: Matrix on vendor position and classification
12.3 4D pharma Plc
Exhibit 119: 4D pharma Plc - Overview
Exhibit 120: 4D pharma Plc - Product / Service
Exhibit 121: 4D pharma Plc - Key offerings
12.4 BiomX Inc.
Exhibit 122: BiomX Inc. - Overview
Exhibit 123: BiomX Inc. - Product / Service
Exhibit 124: BiomX Inc. - Key offerings
12.5 Eligo Bioscience
Exhibit 125: Eligo Bioscience - Overview
Exhibit 126: Eligo Bioscience - Product / Service
Exhibit 127: Eligo Bioscience - Key offerings
12.6 ENTEROME SA
Exhibit 128: ENTEROME SA - Overview
Exhibit 129: ENTEROME SA - Product / Service
Exhibit 130: ENTEROME SA - Key offerings
Exhibit 131: Evelo Biosciences Inc. - Overview
Exhibit 132: Evelo Biosciences Inc. - Product / Service
Exhibit 133: Evelo Biosciences Inc. - Key offerings
12.8 Evogene Ltd.
Exhibit 134: Evogene Ltd. - Overview
Exhibit 135: Evogene Ltd. - Business segments
Exhibit 136: Evogene Ltd. - Key offerings
Exhibit 137: Evogene Ltd. - Segment focus
12.9 Ferring BV
Exhibit 138: Ferring BV - Overview
Exhibit 139: Ferring BV - Product / Service
Exhibit 140: Ferring BV - Key offerings
Exhibit 141: Finch Therapeutics Group Inc. - Overview
Exhibit 142: Finch Therapeutics Group Inc. - Product / Service
Exhibit 143: Finch Therapeutics Group Inc. - Key offerings
12.11 Johnson and Johnson Services Inc.
Exhibit 144: Johnson and Johnson Services Inc. - Overview
Exhibit 145: Johnson and Johnson Services Inc. - Business segments
Exhibit 146: Johnson and Johnson Services Inc. - Key news
Exhibit 147: Johnson and Johnson Services Inc. - Key offerings
Exhibit 148: Johnson and Johnson Services Inc. - Segment focus
12.12 OptiBiotix Health Plc
Exhibit 149: OptiBiotix Health Plc - Overview
Exhibit 150: OptiBiotix Health Plc - Product / Service
Exhibit 151: OptiBiotix Health Plc - Key offerings
12.13 PureTech Health Plc
Exhibit 152: PureTech Health Plc - Overview
Exhibit 153: PureTech Health Plc - Business segments
Exhibit 154: PureTech Health Plc - Key offerings
Exhibit 155: PureTech Health Plc - Segment focus
Exhibit 156: Second Genome Therapeutics - Overview
Exhibit 157: Second Genome Therapeutics - Product / Service
Exhibit 158: Second Genome Therapeutics - Key offerings
12.15 Seres Therapeutics Inc.
Exhibit 159: Seres Therapeutics Inc. - Overview
Exhibit 160: Seres Therapeutics Inc. - Product / Service
Exhibit 161: Seres Therapeutics Inc. - Key offerings
12.16 Synlogic Inc.
Exhibit 162: Synlogic Inc. - Overview
Exhibit 163: Synlogic Inc. - Product / Service
Exhibit 164: Synlogic Inc. - Key offerings
Exhibit 165: Takeda Pharmaceutical Co. Ltd. - Overview
Exhibit 166: Takeda Pharmaceutical Co. Ltd. - Product / Service
Exhibit 167: Takeda Pharmaceutical Co. Ltd. - Key news
Exhibit 168: Takeda Pharmaceutical Co. Ltd. - Key offerings
13 Appendix
13.1 Scope of the report
13.2 Inclusions and exclusions checklist
Exhibit 169: Inclusions checklist
Exhibit 170: Exclusions checklist
13.3 Currency conversion rates for US$
Exhibit 171: Currency conversion rates for US$
13.4 Research methodology
Exhibit 172: Research methodology
Exhibit 173: Validation techniques employed for market sizing
Exhibit 174: Information sources
13.5 List of abbreviations
Exhibit 175: List of abbreviations
About Us
Technavio is a leading global technology research and advisory company. Their research and analysis focus on emerging market trends and provide actionable insights to help businesses identify market opportunities and develop effective strategies to optimize their market positions. With over 500 specialized analysts, Technavio's report library consists of more than 17,000 reports and counting, covering 800 technologies, spanning 50 countries. Their client base consists of enterprises of all sizes, including more than 100 Fortune 500 companies. This growing client base relies on Technavio's comprehensive coverage, extensive research, and actionable market insights to identify opportunities in existing and potential markets and assess their competitive positions within changing market scenarios.
Contact
Technavio Research
Jesse Maida
Media & Marketing Executive
US: +1 844 364 1100
UK: +44 203 893 3200
Email: [email protected]
Website: www.technavio.com
SOURCE Technavio
更多内容,请访问原始网站
文中所述内容并不反映新药情报库及其所属公司任何意见及观点,如有版权侵扰或错误之处,请及时联系我们,我们会在24小时内配合处理。


靶点
-药物
-生物医药百科问答
全新生物医药AI Agent 覆盖科研全链路,让突破性发现快人一步


立即开始免费试用!
智慧芽新药情报库是智慧芽专为生命科学人士构建的基于AI的创新药情报平台,助您全方位提升您的研发与决策效率。
立即开始数据试用!
智慧芽新药库数据也通过智慧芽数据服务平台,以API或者数据包形式对外开放,助您更加充分利用智慧芽新药情报信息。