预约演示
更新于:2025-05-07

Spine Wave, Inc.
更新于:2025-05-07
概览
关联
2
项与 Spine Wave, Inc. 相关的临床试验NCT02317185
CLINICAL EVALUATION OF GENEX® DS IN INSTRUMENTED POSTEROLATERAL FUSION
The overall goal of this clinical study is to characterize the fusion rate of geneX® ds bone graft substitute in comparison to autograft, which is considered the gold standard for posterolateral fusion. Assessments are made using AP and Lateral x-rays, F/E x-rays, and CT scans geneX® ds has been cleared by the FDA for use in these procedures; however this study will allow more detailed characterization of geneX® ds performance in the long-term (1 year). By using the patient as their own control, direct comparison to autograft can be performed while minimizing other variables.
开始日期2014-12-01 |
申办/合作机构 |
NCT02108249
Annex™ Adjacent Level System for Treatment of Adjacent Level Disease
The purpose of this study is to evaluate the clinical, radiological, and surgical outcomes of the Annex™ Adjacent Level System for the treatment of adjacent level disease of the lumbar spine. The Annex™ Adjacent Level System is a spinal fixation system intended to be used with commercially available pedicle screw fixation systems in order to extend existing pedicle screw constructs. Subjects will be evaluated over a 2 year period and compared to historical control.
开始日期2014-04-01 |
申办/合作机构 |
100 项与 Spine Wave, Inc. 相关的临床结果
登录后查看更多信息
0 项与 Spine Wave, Inc. 相关的专利(医药)
登录后查看更多信息
1
项与 Spine Wave, Inc. 相关的文献(医药)2008-03-01·Journal of Medical Devices
Novel Synthetic Total Disk Model for Mechanical Testing of Nucleus Replacement Devices
作者: Spenciner, David ; Paller, David ; Walkenhorst, Jared W. ; Lee, Dennis Y.
5
项与 Spine Wave, Inc. 相关的新闻(医药)2023-12-30
·动脉网
2023年12月4日,柔性腔内手术机器人先驱EndoQuest Robotics宣布成功完成4200万美元(合人民币3亿元)C-1轮融资。本轮融资由EndoQuest老股东CE Ventures Limited和McNair Interests领投,新投资者Puma Venture Capital跟投。本轮融资将用于推动其柔性腔内手术机器人的研发。ENDOQUEST Robotics前身是ColubrisMX,在2022年6月更名。ColubrisMX时期,已获得A轮融资1070万美元、B轮融资7610万美元。ENDOQUEST Robotics融资过程 动脉网制EndoQuest Robotics致力于解决胃肠道(“GI”)和其他内腔手术领域未满足的需求。通过开发柔性机器人,使其能够经口或肛门进行胃肠道手术,实现微创干预。CEO曾创造超9.1亿美元年销售额通常而言,团队是决定企业研发能力的关键要素。EndoQuest Robotics首席执行官Kurt Azarbarzin在外科、机器人、心血管、介入、骨科和泌尿外科市场有丰富经验,在医疗行业的从业经历长达39年。2005年,Kurt Azarbarzin创立了SurgiQuest并将其出售给CONMED,而今该公司的技术AirSeal已成为高级腹腔镜和机器人手术的护理标准。之后他成为Verb Surgical(谷歌和强生的合资企业)的首席执行官。Kurt Azarbarzin曾在U.S. Surgical、Tyco Healthcare(现为美敦力)、Spine Wave、Respimetrix、SurgiQuest、Verb Surgical和强生等公司领导开发了90多种新产品,年销售额超过9.1亿美元。团队成员中值得一提的还有医学博士Todd Wilson。他是休斯顿德克萨斯大学医学中心的微创外科医生,研究方向侧重于腔内手术系统的研发。目前,Todd Wilson已累计发表70多篇相关文章。团队部分成员 图源:EndoQuest Robotics团队成员的丰富经验和专业知识,不仅使得EndoQuest Robotics在柔性腔内手术机器人领域树立起壁垒,更为公司推动柔性腔内手术机器人的研发进程提供了加速度。提升ESD手术操作精确度与稳定性内镜黏膜切除术(EMR)是目前美国非恶性结直肠息肉的标准治疗方法。使用EMR处理大结直肠息肉时,逐个切除是一种常见的手术方式。然而,随着病变范围的扩大,整块切除手术的难度也逐渐增加。EMR的主要缺点是整块切除率低。切除的零碎性质阻碍了边缘评估,从而导致R0切除率(指在病理切片下,切线上没有发现癌细胞)低,无法确定患者未来的治疗计划。而这将进一步导致患者需频频进行结肠镜检查以评估复发情况,为医疗保健系统带来负担。内镜黏膜下剥离术(ESD)具有不开刀、不改变消化道解剖结构、创伤小、恢复快、医疗费用少、住院时间短等优势,有效改善了这一情况。其可实现整块切除,与EMR相比,R0切除率大大提高,但由于操作难度大、学习曲线长、术中出血及穿孔风险相对较高,限制了其推广。柔性手术机器人恰好能够解决以上问题,是辅助医生在内镜下完成高难度复杂手术,提升内科手术的效率和安全性的利器。也正是因此,柔性腔内手术机器人诞生了。可达7自由度,增强解剖灵活性手术机器人的应用在提高腹腔镜手术精确性方面具有显著效果。然而,其刚性机械臂在一定程度上限制了其实用性。为了解决这一问题,EndoQuest公司研发出了一种柔性腔内手术机器人,即EndoLuminal Surgical System(ELS)。这种手术机器人也代表了微创手术领域的创新。相比之下,该机器人系统可实现无疤痕和侵入性较小的外科手术,最大限度减少外部切口和相关并发症。ELS诞生之初由手推车(Patient Cart)和医生控制台(Surgeon Console)两部分组成。初代ELS 图源:EndoQuest RoboticsELS通过管道(Colubriscope)进入体内,该管道可经口手动插入食管或经肛门插入结肠。手推车的数字界面可以模仿医生的手部运动,提升手术的精确度和控制力;医生控制台则可以利用管道查看两个仪器和内窥镜观察情况,并且有额外的通道可以进行注气、冲洗、抽吸,以对第三方内窥镜设备进行使用。对产品进一步迭代后,如今ELS的组成结构由两部分,增至手推车(Patient Cart)、医生控制台(Physician Console)和机械手(Flexible Instruments)三部分。新版ELS 图源:EndoQuest Robotics与旧版相比,新版ELS增加了机械手。在原有手术机器人系统的基础上,实现了手术部位的完全可视化,并使两个6mm的手术器械和3.7mm第三方柔性内窥镜(Olympus GIF-XP190)可以同时操作。其手术器械形成手术三角和高达7个自由度的关节自动辅助,以增强狭窄腔内解剖的灵活性。目前,ELS 除了适用于消化道外,还可应用于其它各种经自然腔道的微创手术。此外,ELS还支持单切口手术,以最大限度减少术后疤痕的出现。做到减少创伤、提升伤口愈合速度并改善患者的病后护理情况。ELS可应用的微创手术 图源:EndoQuest Robotics目前,ELS已完成了首次临床评估。2020年10月至12月,奥兰多佛罗里达州内外科中心的临床前环境中使用猪结肠作为模型对ELS进行了评估,共有20名患者参与研究。在研究过程中,ELS系统连续进行了 20 次机器人经肛门微创手术 (TAMIS) 手术,成功进行了无碎片操作。在整个试验过程中,没有发生任何不良事件。ELS拟进行IDE临床研究,加速产品全球落地2022年9月,EndoQuest Robotics宣布其ELS将在布莱根妇女医院(Brigham and Women’s Hospital,BWH)完成装机,双方还将携手推进ELS的临床应用和程序开发。此外,公司拟在今年年底确立BWH为IDE临床研究中心,以及公司在美国的首个卓越中心和培训基地。2023年3月,EndoQuest Robotics宣布与全球医疗技术平台公司Proximie达成合作,以加速ELS系统的全球机器人落地。近年来,经自然腔道手术机器人在全球发展十分迅速,海外除EndoQuest Robotics开发的ELS系统外,还有Medrobotics开发的Flex™机器人系统、Endomaster研发的EaseSystem等。不过,经自然腔道手术机器人获批仍是一道难题。到现在,全球仅有直觉外科Ion、强生Monarch、Momentis Surgical的阴道手术机器人Anovo,以及MedRobotics用于肛门、直肠和远程结肠的机器人Flex,4款经自然腔道手术机器人获美国FDA批准或欧洲CE标志认证。手术机器人是多学科融合的创新型医疗器械,是实现手术智能化的关键技术,代表未来手术术式发展方向。目前各类手术陆续进入机器人时代,手术机器人无疑正逐步改变和颠覆传统手术。未来,随着更多的医生熟练掌握并运用手术机器人进行手术,手术机器人的的研发与应用基础将愈为扎实,动脉网也将持续关注该领域发展。文|冉炘微信|qq850860074添加时请注明:姓名-公司-职位网站、公众号等转载请联系授权:Rekkiiie近期推荐声明:动脉网所刊载内容之知识产权为动脉网及相关权利人专属所有或持有。未经许可,禁止进行转载、摘编、复制及建立镜像等任何使用。动脉网,未来医疗服务平台
2023-11-03
·动脉网
在过去的十余年里,免疫疗法彻底改变了癌症治疗的方式。通过免疫检查点阻断(ICB)的癌症免疫治疗,包括阻断细胞毒性T淋巴细胞蛋白4(CTLA-4)和PD-(L)1的抗体,显著改善了癌症患者的预后。但是,即便是被称为“神药”的PD-1,也并不是对患者100%起效——相关数据表明,在单药治疗的情况下,PD-1的应答率为10%~20%,与其他药物联用后才可将有效率提高到60%以上。因此,迫切需要寻找新的开发策略来更有效地参与抗肿瘤免疫反应,以扩大受益患者的群体。为了寻找突破口,一些科学家关注到癌细胞表面的糖分子——唾液聚糖(唾液酸)。唾液聚糖是一种特殊的聚糖,它可以被一系列表面蛋白所识别,这些表面蛋白主要存在于先天免疫细胞上,也存在于肿瘤部位的活化T细胞上。来自瑞士巴塞尔大学生物医学系Heinz Lubli教授团队和2022年诺贝尔奖化学奖得主、斯坦福大学教授Carolyn Bertozzi等的研究发现,癌细胞可以通过表面的唾液聚糖与免疫抑制性受体结合,逃避免疫细胞的攻击。这项研究证明了治疗性去唾液酸化在抗肿瘤方面的有效性和可行性,并突出了其与经典免疫检查点联合使用的潜力。为了进一步推动糖免疫疗法的开发与应用,2015年,Carolyn Bertozzi教授与Jim Broderick、Paul Crocker联合创办Palleon Pharmaceuticals,针对糖免疫检查点轴(Siglec-Sialoglycan)为主要机制进行药物开发,主要用于癌症治疗及其他治疗领域,包括传染病、神经变性、炎症和纤维化。三个公司卖了超20亿,第四次创业联合诺贝尔化学奖得主2015年,SR One(前为GSK风险投资部门)第一位常驻企业家,Jim Broderick,试图寻找机会创办第四家公司。在此之前的14年间,Broderick担任Morgenthaler Venture的合伙人,专注于投资生物技术和医疗设备领域。从2004年开始,Broderick便不满足于在产业中只担任投资人的角色,先后加入OncoMed和Spine Wave的董事会。2006年,Broderick联合创办生物技术公司Promedior,致力于开发特发性肺纤维化治疗药物,后被罗氏以3.9亿美元的前期现金款项收购;2007年,Broderick创办SetPoint Medical,开发可植入的神经刺激设备以治疗炎症性疾病;之后,Broderick联合创办生物制药公司Ra Pharma,于2016年登陆纳斯达克,2019年被UCB以21亿美元高价收购。第四次创业,Broderick将目光放在先天免疫领域——存在于先天免疫细胞和肿瘤部位活化T细胞上的唾液聚糖。由此,Broderick与在唾液聚糖与癌症治疗领域颇有研究的Carolyn Bertozzi教授结缘,而Carolyn的研究正巧是另一位科学家Paul Crocker早期进行细胞培养试验的基础。在深入沟通后,2015年,Broderick、Carolyn及Paul便决定共同创办Palleon。在外媒的采访中,Broderick还透露了这次合作的一个小插曲,彼时糖生物学具有复杂性且前景尚不清晰,Carolyn对此深表担忧,Broderick却告诉她“我坚信糖生物学在癌症领域具有巨大的机会,为此已经放弃了其他项目的推进。”探索癌症治疗的新机制:糖免疫检查点轴2022年底,Carolyn Bertozzi教授与瑞士巴塞尔大学生物医学系Heinz Lubli教授团队关于糖免疫的研究被发表在《Science Translational Medicine》上。这项研究同时也证明了Palleon坚持多年的技术路线的可行性。在肿瘤微环境中,肿瘤的唾液酸化有助于建立免疫抑制环境,并通过参与肿瘤浸润免疫细胞上表达的免疫调节性免疫球蛋白样凝集素(Siglec受体)来抑制抗肿瘤免疫反应。Palleon采取的糖免疫检查点轴——唾液酸聚糖-Siglec轴是一种新的免疫检查点,可以作为靶点来驱动先天性和适应性抗肿瘤免疫。 人类至少表达出14种独特的Siglec,并各自具有不同的首选唾液酸聚糖配体。大量的受体在何不同结构的唾液酸聚糖在免疫系统中具有广泛的表达模式,确切的机制尚不清楚,其在癌症中介导的免疫抑制也就无法用传统的方法来解决。为了解决这个问题,以糖免疫检查点轴(sialoglycan-siglec轴)作为主要机制进行药物开发的Palleon,开发了EAGLE平台和HYDRA平台。■ EAGLE平台EAGLE平台主要构建工程化人唾液酸酶,通过酶促反应去除肿瘤和免疫细胞表面的唾液酸,解除其诱导的免疫抑制作用,增强抗肿瘤免疫能力。 肿瘤去唾液酸化过程 图源:Palleon官网据Palleon,EAGLE技术作用机制设计先天性免疫和适应性免疫两种,体内研究表明EAGLE技术能降低肿瘤细胞表面的唾液酸水平,另外,多种EAGLE制剂在临床前肿瘤模型中实现了单药治疗肿瘤完全消退。■ HYDRA平台HYDRA平台是一种基于免疫组织化学的转化研究技术,可以识别病人特定肿瘤表面的唾液酸聚糖特征,量化癌症患者样本中的免疫抑制性唾液酸聚糖密度以用于临床开发和药效学活性评估,解决了由唾液酸聚糖的异质性和复杂性带来的无法检测细胞表面聚糖模式的问题。目前,HYDRA平台主要用于确定适应症的优先次序、未来临床病人富集策略,并指导候选治疗药物的最佳剂量。多条候选管线,与国内药企牵手2006年,加州大学戴维斯分校生物化学与分子生物学博士李鹏加入Palleon担任CEO。此前,李鹏曾在Medimmune、阿斯利康工作超过15年,领导药物发现计划和多个跨职能项目团队。另外,李鹏共发表了30多篇论文,拥有20项专利。加入Palleon后,李鹏领导了技术平台EAGLE和HYDRA的建设和发明,并领导早期研究开发工作,包括药理学、毒理学和CMC等。有证据表明,唾液酸聚糖的失调还与集中炎症性疾病相关,包括类风湿性关节炎、特发性肺纤维化喝自身免疫性血管炎。目前,Palleon主要布局在癌症和炎症性疾病两个方向。 癌症候选管线图源:Palleon官网 炎症性疾病候选管线 图源:Palleon官网以下介绍几个Palleon的主要管线。■ E-602E-602是Palleon基于EAGLE技术平台开发的一款潜在First-in-class唾液酸酶融合蛋白,将唾液酸酶(Neu2)与人类抗体的Fc片段相融合,可以通过降解肿瘤和免疫细胞表面具有免疫一直作用的唾液聚糖,恢复抗癌免疫力。临床前试验证明,E-602可以去除T细胞和肿瘤细胞上的唾液酸,恢复先天性和适应性抗肿瘤反应,同时作为单药在多种小鼠肿瘤模型中显示出优越的抗肿瘤活性。其I期临床数据显示,E-602的32天重复剂量GLP NHP毒性研究表明,耐受性良好,无观测不良效应水平(NOAEL)确定为100毫克/千克。E-602的1期试验结果验证了糖免疫检查点抑制剂的作用机制,E-602剂量依赖性降低外周免疫细胞的唾液聚糖修饰,并且激活循环免疫细胞活性。目前,E-602的临床1/2期临床试验已于今年6月启动,将对晚期癌症患者进行评估。■ E-434E-434,HER2-唾液酸酶同样来自于Palleon的技术平台EAGLE。HER2-唾液酸酶靶向表达HER2(低表达或高表达)的肿瘤,以增强肿瘤细胞的去唾液酸化。这些分子保留了其HER2街道的抗肿瘤活性。2022年6月,Palleon与复宏汉霖达成战略合作,共同开发HER2-唾液酸酶。Palleon 将主导两款产品的早期研究,双方将共同负责临床前和全球临床开发并分担相应费用。复宏汉霖将拥有两款产品在中国(包括香港、澳门及台湾地区)的独家许可,Palleon将保留其它的全球区域的权利。针对合作开发的第二款产品,复宏汉霖将根据其提供的抗体技术在Palleon 区域授予Palleon 独家许可,并有权根据该许可享有Palleon 区域的销售分成。Palleon 将获得首付款,以及不超过1.965 亿美元的研发及商业化里程碑付款,此外还将享有在复宏汉霖区域的销售分成。■ PD-L1-唾液酸酶PD-L1-唾液酸酶也是Palleon的EAGLE平台的一种新型糖免疫学治疗药物。PD-L1-唾液酸酶旨在靶向表达PD-L1的肿瘤和免疫细胞,以增强肿瘤细胞和免疫细胞的去唾液酸化。这些分子还阻断PD1 / PD-L1相互作用。在CT26-h PD-L1转基因共生小鼠肿瘤模型中,PD-L1-唾液酸酶更高效的去除表达PD-L1的免疫细胞和肿瘤细胞表面的唾液酸,并显示出比其母体唾液酶或抗PD-L1单抗更好的抗肿瘤活性。开创糖免疫疗法的Palleon在CEO李鹏上任后,便开始推进与国内医药企业的合作和联系。除了与复宏汉霖达成战略合作外,自2018年开始,Palleon便与药明生物建立合作关系,共同推进生物创新药管线开发进程,包括核心管线E-602。Siglec及配体是Palleon的核心技术路线,而更多关注Siglec的企业则是将目光聚焦在抑制型受体中——目前,Siglec-9配体的上调已在人类结直肠癌、前列腺癌、乳腺癌和非小细胞肺癌中得到证实。Innate Pharma、Alector等多家公司已经加入免疫肿瘤学的潮流,对多种Siglec受体进行研究。在2018年的美国癌症研究协会(AACR)发起了首次以“糖科学”为主题的会议上,耶鲁大学放射肿瘤学家Joseph Contessa曾说过,“由于肿瘤依赖糖蛋白来生存和发展,那么就像已经广泛使用的化疗和蛋白酶体抑制剂一样,阻止糖粘附在蛋白质上的药物必然可以对抗癌症。”近期推荐声明:动脉网所刊载内容之知识产权为动脉网及相关权利人专属所有或持有。未经许可,禁止进行转载、摘编、复制及建立镜像等任何使用。动脉网,未来医疗服务平台
免疫疗法并购细胞疗法
2023-08-09
NEW YORK, Aug. 9, 2023 /PRNewswire/ -- The
spinal implants and surgical devices market is estimated to grow at a
CAGR of 5.3% between 2022 and 2027. The market size is forecasted to increase by
USD 3,394.36 million, according to Technavio.
- Request a sample report
Spinal Implants and Surgical Devices Market Insights -
Continue Reading
Technavio has announced its latest market research report titled Global Spinal Implants and Surgical Devices Market
Companies: 15+, Including Abbott Laboratories, Alphatec Holdings Inc., B. Braun Melsungen AG, Bioventus LLC, Boston Scientific Corp., Exactech Inc., Globus Medical Inc., Implanet SA, Integra Lifesciences Holdings Corp., Johnson and Johnson Services Inc., Kuros Biosciences AG, Medtronic Plc, Nuvasive Inc., Orthofix Medical Inc., RTI Surgical Inc., Spine Wave Inc., Spineart SA, Stryker Corp., ulrich GmbH and Co. KG, and Xtant Medical Inc., among others
Coverage: Parent market analysis; key drivers, major trends, and challenges; customer and company landscape; company product insights and recent developments; key companies; and market positioning of companies
Segments: type (open surgeries and minimally invasive surgeries), end-user (hospitals, ambulatory surgical centers, and specialty clinics), and geography (North America, Europe, Asia, and the Rest of World (ROW))
To understand more about the spinal implants and surgical devices market, request a sample report
Spinal Implants and Surgical Devices Market - Company Insights
The growing competition in the market is compelling companies to adopt various growth strategies such as promotional activities and spending on advertisements to improve the visibility of their services. Technavio report analyzes the market's competitive landscape and offers information on several market companies including - Abbott Laboratories, Alphatec Holdings Inc., B. Braun Melsungen AG, Bioventus LLC, Boston Scientific Corp., Exactech Inc., Globus Medical Inc., Implanet SA, Integra Lifesciences Holdings Corp., Johnson and Johnson Services Inc., Kuros Biosciences AG, Medtronic Plc, Nuvasive Inc., Orthofix Medical Inc., RTI Surgical Inc., Spine Wave Inc., Spineart SA, Stryker Corp., ulrich GmbH and Co. KG, and Xtant Medical Inc.
Spinal Implants and Surgical Devices Market –
Market Dynamics
Key Drivers
The increasing prevalence of spinal disorders is a key factor driving market growth. Common spinal diseases such as degenerative disc disease, spinal stenosis, and disc herniation are becoming increasingly prevalent due to an aging population, resulting in increased demand for spinal surgery and implants. Degenerative diseases such as arthrosis and degenerative disc disease are particularly common with aging, causing spinal pain and functional limitations.
This increases the need for spinal implants and surgical instruments. Additionally, a sedentary lifestyle negatively impacts spinal health, resulting in poor posture, weak back muscles, increased pressure on the spine, and symptoms such as lower back pain, disc herniation, and spinal stenosis. This can also cause medical societies and device manufacturers to actively raise awareness of these spinal disorders through educational programs and conferences. Hence, weak, or missing MRO processes are expected to restrict market growth during the forecast period.
Major Trends
Technological advancements is a major trend in the market. Minimally invasive surgical techniques, robotic surgery, 3D printing of implants, advanced imaging techniques, and the development of biocompatible materials for implants are some of the recent technological advances in the market. In addition, these innovations aim to improve surgical outcomes, reduce patient recovery time, and improve the overall quality of spine surgery. Titanium alloys and polyetheretherketone (PEEK) are among the advanced materials for implants, offering good mechanical properties and compatibility with the human body. Additionally, the minimally invasive technique requires smaller incisions, reducing tissue damage and shortening patient recovery time. Ongoing research at various universities is exploring the potential of his 3D printing in spine surgery. Hence, technological advancements are expected to drive market growth during the forecast period.
Significant Challenges
The risks associated with interventional spine procedures are one of the significant challenges restricting the market growth. Patients, especially in developing countries, may be reluctant to undergo spinal interventions due to concerns about possible risks. Some patients may choose not to undergo vertebroplasty because of the risk of cement leakage.
In addition, surgery can shrink the vertebrae, increasing the risk of future fractures. Important early consequences of vertebral fractures include laceration and leakage of extra vertebral polymethylmethacrylate (PMMA) cement through the venous system, which can lead to spinal stenosis and pulmonary cement embolism. In addition, systemic allergic reactions, hematomas, or cement toxicity reactions pose significant risks during spinal intervention procedures. Hence, risks associated with interventional spine procedures are expected to restrict market growth during the forecast period.
Drivers, Trends & Challenges have an impact on market dynamics and can impact businesses. Find some insights from a
sample report!
The spinal implants and surgical devices market report provides critical information and factual data, with a qualitative and quantitative study of the market based on market drivers and limitations as well as prospects.
Why Buy?
Add credibility to the strategy
Analyzes competitor's offerings.
Get a holistic view of the market
Grow your profit margin with Technavio
- Buy the Report
What are the key data covered in this Spinal Implants and Surgical Devices Market report?
CAGR of the market during the forecast period
Detailed information on factors that will drive the growth of the spinal implants and surgical devices market between 2023 and 2027
Precise estimation of the size of the spinal implants and surgical devices market and its contribution to the market with a focus on the parent market
Accurate predictions about upcoming trends and changes in consumer behavior
Growth of the spinal implants and surgical devices market across North America, Europe, Asia, and the Rest of the World (ROW)
A thorough analysis of the market's competitive landscape and detailed information about companies
Comprehensive analysis of factors that will challenge the growth of spinal implants and surgical devices market companies
Gain instant access to 17,000+ market research reports.
Technavio's SUBSCRIPTION platform
Related Reports
The
elastomeric infusion pumps market is estimated to grow by USD 800.97 million at a CAGR of 7.07% between 2022 and 2027. Furthermore, this report extensively covers market segmentation by application (pain management, antibiotic or antiviral, chemotherapy, and others), end-user (hospitals, ambulatory service centers, clinics, and others), and geography (APAC, North America, Europe, Middle East and Africa, and South America). The high demand for advanced infusion pumps is a major trend in the market.
The
neuromodulation market is estimated to grow by USD 5,332.29 million at a CAGR of 12.02% between 2022 and 2027. Furthermore, this report extensively covers market segmentation by product (implantable neuromodulation devices and external neuromodulation devices) end-user (hospitals, ASCS, and others), and geography (APAC, North America, Europe, Middle East and Africa, and South America). The expanding applications of neuromodulation therapies is a major trend in the market.
Table of Contents
1 Executive Summary
1.1 Market Overview
Exhibit 01: Executive Summary – Chart on Market Overview
Exhibit 02: Executive Summary – Data Table on Market Overview
Exhibit 03: Executive Summary – Chart on Global Market Characteristics
Exhibit 04: Executive Summary – Chart on Market by Geography
Exhibit 05: Executive Summary – Chart on Market Segmentation by Type
Exhibit 06: Executive Summary – Chart on Market Segmentation by End-user
Exhibit 07: Executive Summary – Chart on Incremental Growth
Exhibit 08: Executive Summary – Data Table on Incremental Growth
Exhibit 09: Executive Summary – Chart on Company Market Positioning
2 Market Landscape
2.1 Market ecosystem
Exhibit 10: Parent market
Exhibit 11: Market Characteristics
3 Market Sizing
3.1 Market definition
Exhibit 12: Offerings of companies included in the market definition
3.2 Market segment analysis
Exhibit 13: Market segments
3.3 Market size 2022
3.4 Market outlook: Forecast for 2022-2027
Exhibit 14: Chart on Global - Market size and forecast 2022-2027 ($ million)
Exhibit 15: Data Table on Global - Market size and forecast 2022-2027 ($ million)
Exhibit 16: Chart on Global Market: Year-over-year growth 2022-2027 (%)
Exhibit 17: Data Table on Global Market: Year-over-year growth 2022-2027 (%)
4 Historic Market Size
4.1 Global spinal implants and surgical devices market 2017 - 2021
Exhibit 18: Historic Market Size – Data Table on global spinal implants and surgical devices market 2017 - 2021 ($ million)
4.2 Type Segment Analysis 2017 - 2021
Exhibit 19: Historic Market Size – Type Segment 2017 - 2021 ($ million)
4.3 End-user Segment Analysis 2017 - 2021
Exhibit 20: Historic Market Size – End-user Segment 2017 - 2021 ($ million)
4.4 Geography Segment Analysis 2017 - 2021
Exhibit 21: Historic Market Size – Geography Segment 2017 - 2021 ($ million)
4.5 Country Segment Analysis 2017 - 2021
Exhibit 22: Historic Market Size – Country Segment 2017 - 2021 ($ million)
5 Five Forces Analysis
5.1 Five forces summary
Exhibit 23: Five forces analysis - Comparison between 2022 and 2027
5.2 Bargaining power of buyers
Exhibit 24: Chart on Bargaining power of buyers – Impact of key factors 2022 and 2027
5.3 Bargaining power of suppliers
Exhibit 25: Bargaining power of suppliers – Impact of key factors in 2022 and 2027
5.4 Threat of new entrants
Exhibit 26: Threat of new entrants – Impact of key factors in 2022 and 2027
5.5 Threat of substitutes
Exhibit 27: Threat of substitutes – Impact of key factors in 2022 and 2027
5.6 Threat of rivalry
Exhibit 28: Threat of rivalry – Impact of key factors in 2022 and 2027
5.7 Market condition
Exhibit 29: Chart on Market condition - Five forces 2022 and 2027
6 Market Segmentation by Type
6.1 Market segments
Exhibit 30: Chart on Type - Market share 2022-2027 (%)
Exhibit 31: Data Table on Type - Market share 2022-2027 (%)
6.2 Comparison by Type
Exhibit 32: Chart on Comparison by Type
Exhibit 33: Data Table on Comparison by Type
6.3 Open surgeries - Market size and forecast 2022-2027
Exhibit 34: Chart on Open surgeries - Market size and forecast 2022-2027 ($ million)
Exhibit 35: Data Table on Open surgeries - Market size and forecast 2022-2027 ($ million)
Exhibit 36: Chart on Open surgeries - Year-over-year growth 2022-2027 (%)
Exhibit 37: Data Table on Open surgeries - Year-over-year growth 2022-2027 (%)
6.4 Minimally invasive surgeries - Market size and forecast 2022-2027
Exhibit 38: Chart on Minimally invasive surgeries - Market size and forecast 2022-2027 ($ million)
Exhibit 39: Data Table on Minimally invasive surgeries - Market size and forecast 2022-2027 ($ million)
Exhibit 40: Chart on Minimally invasive surgeries - Year-over-year growth 2022-2027 (%)
Exhibit 41: Data Table on Minimally invasive surgeries - Year-over-year growth 2022-2027 (%)
6.5 Market opportunity by Type
Exhibit 42: Market opportunity by Type ($ million)
Exhibit 43: Data Table on Market opportunity by Type ($ million)
7 Market Segmentation by End-user
7.1 Market segments
Exhibit 44: Chart on End-user - Market share 2022-2027 (%)
Exhibit 45: Data Table on End-user - Market share 2022-2027 (%)
7.2 Comparison by End-user
Exhibit 46: Chart on Comparison by End-user
Exhibit 47: Data Table on Comparison by End-user
7.3 Hospitals - Market size and forecast 2022-2027
Exhibit 48: Chart on Hospitals - Market size and forecast 2022-2027 ($ million)
Exhibit 49: Data Table on Hospitals - Market size and forecast 2022-2027 ($ million)
Exhibit 50: Chart on Hospitals - Year-over-year growth 2022-2027 (%)
Exhibit 51: Data Table on Hospitals - Year-over-year growth 2022-2027 (%)
7.4 Ambulatory surgical centers - Market size and forecast 2022-2027
Exhibit 52: Chart on Ambulatory surgical centers - Market size and forecast 2022-2027 ($ million)
Exhibit 53: Data Table on Ambulatory surgical centers - Market size and forecast 2022-2027 ($ million)
Exhibit 54: Chart on Ambulatory surgical centers - Year-over-year growth 2022-2027 (%)
Exhibit 55: Data Table on Ambulatory surgical centers - Year-over-year growth 2022-2027 (%)
7.5 Specialty clinics - Market size and forecast 2022-2027
Exhibit 56: Chart on Specialty clinics - Market size and forecast 2022-2027 ($ million)
Exhibit 57: Data Table on Specialty clinics - Market size and forecast 2022-2027 ($ million)
Exhibit 58: Chart on Specialty clinics - Year-over-year growth 2022-2027 (%)
Exhibit 59: Data Table on Specialty clinics - Year-over-year growth 2022-2027 (%)
7.6 Market opportunity by End-user
Exhibit 60: Market opportunity by End-user ($ million)
Exhibit 61: Data Table on Market opportunity by End-user ($ million)
8 Customer Landscape
8.1 Customer landscape overview
Exhibit 62: Analysis of price sensitivity, lifecycle, customer purchase basket, adoption rates, and purchase criteria
9 Geographic Landscape
9.1 Geographic segmentation
Exhibit 63: Chart on Market share by geography 2022-2027 (%)
Exhibit 64: Data Table on Market share by geography 2022-2027 (%)
9.2 Geographic comparison
Exhibit 65: Chart on Geographic comparison
Exhibit 66: Data Table on Geographic comparison
9.3 North America - Market size and forecast 2022-2027
Exhibit 67: Chart on North America - Market size and forecast 2022-2027 ($ million)
Exhibit 68: Data Table on North America - Market size and forecast 2022-2027 ($ million)
Exhibit 69: Chart on North America - Year-over-year growth 2022-2027 (%)
Exhibit 70: Data Table on North America - Year-over-year growth 2022-2027 (%)
9.4 Europe - Market size and forecast 2022-2027
Exhibit 71: Chart on Europe - Market size and forecast 2022-2027 ($ million)
Exhibit 72: Data Table on Europe - Market size and forecast 2022-2027 ($ million)
Exhibit 73: Chart on Europe - Year-over-year growth 2022-2027 (%)
Exhibit 74: Data Table on Europe - Year-over-year growth 2022-2027 (%)
9.5 Asia - Market size and forecast 2022-2027
Exhibit 75: Chart on Asia - Market size and forecast 2022-2027 ($ million)
Exhibit 76: Data Table on Asia - Market size and forecast 2022-2027 ($ million)
Exhibit 77: Chart on Asia - Year-over-year growth 2022-2027 (%)
Exhibit 78: Data Table on Asia - Year-over-year growth 2022-2027 (%)
9.6 Rest of World (ROW) - Market size and forecast 2022-2027
Exhibit 79: Chart on Rest of World (ROW) - Market size and forecast 2022-2027 ($ million)
Exhibit 80: Data Table on Rest of World (ROW) - Market size and forecast 2022-2027 ($ million)
Exhibit 81: Chart on Rest of World (ROW) - Year-over-year growth 2022-2027 (%)
Exhibit 82: Data Table on Rest of World (ROW) - Year-over-year growth 2022-2027 (%)
9.7 US - Market size and forecast 2022-2027
Exhibit 83: Chart on US - Market size and forecast 2022-2027 ($ million)
Exhibit 84: Data Table on US - Market size and forecast 2022-2027 ($ million)
Exhibit 85: Chart on US - Year-over-year growth 2022-2027 (%)
Exhibit 86: Data Table on US - Year-over-year growth 2022-2027 (%)
9.8 Germany - Market size and forecast 2022-2027
Exhibit 87: Chart on Germany - Market size and forecast 2022-2027 ($ million)
Exhibit 88: Data Table on Germany - Market size and forecast 2022-2027 ($ million)
Exhibit 89: Chart on Germany - Year-over-year growth 2022-2027 (%)
Exhibit 90: Data Table on Germany - Year-over-year growth 2022-2027 (%)
9.9 UK - Market size and forecast 2022-2027
Exhibit 91: Chart on UK - Market size and forecast 2022-2027 ($ million)
Exhibit 92: Data Table on UK - Market size and forecast 2022-2027 ($ million)
Exhibit 93: Chart on UK - Year-over-year growth 2022-2027 (%)
Exhibit 94: Data Table on UK - Year-over-year growth 2022-2027 (%)
9.10 Japan - Market size and forecast 2022-2027
Exhibit 95: Chart on Japan - Market size and forecast 2022-2027 ($ million)
Exhibit 96: Data Table on Japan - Market size and forecast 2022-2027 ($ million)
Exhibit 97: Chart on Japan - Year-over-year growth 2022-2027 (%)
Exhibit 98: Data Table on Japan - Year-over-year growth 2022-2027 (%)
9.11 China - Market size and forecast 2022-2027
Exhibit 99: Chart on China - Market size and forecast 2022-2027 ($ million)
Exhibit 100: Data Table on China - Market size and forecast 2022-2027 ($ million)
Exhibit 101: Chart on China - Year-over-year growth 2022-2027 (%)
Exhibit 102: Data Table on China - Year-over-year growth 2022-2027 (%)
9.12 Market opportunity by geography
Exhibit 103: Market opportunity by geography ($ million)
Exhibit 104: Data Tables on Market opportunity by geography ($ million)
10 Drivers, Challenges, and Trends
10.1 Market drivers
10.2 Market challenges
10.3 Impact of drivers and challenges
Exhibit 105: Impact of drivers and challenges in 2022 and 2027
10.4 Market trends
11 Company
Landscape
11.1 Overview
11.2 Vendor landscape
Exhibit 106: Overview on Criticality of inputs and Factors of differentiation
11.3 Landscape disruption
Exhibit 107: Overview on factors of disruption
11.4 Industry risks
Exhibit 108: Impact of key risks on business
12 Vendor Analysis
12.1 Companies covered
Exhibit 109: Companies covered
12.2 Market positioning of Companies
Exhibit 110: Matrix on vendor position and classification
12.3 Abbott Laboratories
Exhibit 111: Abbott Laboratories - Overview
Exhibit 112: Abbott Laboratories - Business segments
Exhibit 113: Abbott Laboratories - Key news
Exhibit 114: Abbott Laboratories - Key offerings
Exhibit 115: Abbott Laboratories - Segment focus
12.4 Alphatec Holdings Inc.
Exhibit 116: Alphatec Holdings Inc. - Overview
Exhibit 117: Alphatec Holdings Inc. - Product / Service
Exhibit 118: Alphatec Holdings Inc. - Key offerings
12.5 B. Braun Melsungen AG
Exhibit 119: B. Braun Melsungen AG - Overview
Exhibit 120: B. Braun Melsungen AG - Business segments
Exhibit 121: B. Braun Melsungen AG - Key news
Exhibit 122: B. Braun Melsungen AG - Key offerings
Exhibit 123: B. Braun Melsungen AG - Segment focus
12.6 Bioventus LLC
Exhibit 124: Bioventus LLC - Overview
Exhibit 125: Bioventus LLC - Business segments
Exhibit 126: Bioventus LLC - Key news
Exhibit 127: Bioventus LLC - Key offerings
Exhibit 128: Bioventus LLC - Segment focus
12.7 Boston Scientific Corp.
Exhibit 129: Boston Scientific Corp. - Overview
Exhibit 130: Boston Scientific Corp. - Business segments
Exhibit 131: Boston Scientific Corp. - Key news
Exhibit 132: Boston Scientific Corp. - Key offerings
Exhibit 133: Boston Scientific Corp. - Segment focus
12.8 Globus Medical Inc.
Exhibit 134: Globus Medical Inc. - Overview
Exhibit 135: Globus Medical Inc. - Product / Service
Exhibit 136: Globus Medical Inc. - Key offerings
12.9 Integra Lifesciences Holdings Corp.
Exhibit 137: Integra Lifesciences Holdings Corp. - Overview
Exhibit 138: Integra Lifesciences Holdings Corp. - Business segments
Exhibit 139: Integra Lifesciences Holdings Corp. - Key news
Exhibit 140: Integra Lifesciences Holdings Corp. - Key offerings
Exhibit 141: Integra Lifesciences Holdings Corp. - Segment focus
12.10 Johnson and Johnson Services Inc.
Exhibit 142: Johnson and Johnson Services Inc. - Overview
Exhibit 143: Johnson and Johnson Services Inc. - Business segments
Exhibit 144: Johnson and Johnson Services Inc. - Key news
Exhibit 145: Johnson and Johnson Services Inc. - Key offerings
Exhibit 146: Johnson and Johnson Services Inc. - Segment focus
12.11 Medtronic Plc
Exhibit 147: Medtronic Plc - Overview
Exhibit 148: Medtronic Plc - Business segments
Exhibit 149: Medtronic Plc - Key news
Exhibit 150: Medtronic Plc - Key offerings
Exhibit 151: Medtronic Plc - Segment focus
12.12 Nuvasive Inc.
Exhibit 152: Nuvasive Inc. - Overview
Exhibit 153: Nuvasive Inc. - Business segments
Exhibit 154: Nuvasive Inc. - Key news
Exhibit 155: Nuvasive Inc. - Key offerings
Exhibit 156: Nuvasive Inc. - Segment focus
12.13 Orthofix Medical Inc.
Exhibit 157: Orthofix Medical Inc. - Overview
Exhibit 158: Orthofix Medical Inc. - Business segments
Exhibit 159: Orthofix Medical Inc. - Key offerings
Exhibit 160: Orthofix Medical Inc. - Segment focus
12.14 RTI Surgical Inc.
Exhibit 161: RTI Surgical Inc. - Overview
Exhibit 162: RTI Surgical Inc. - Product / Service
Exhibit 163: RTI Surgical Inc. - Key offerings
12.15 Spineart SA
Exhibit 164: Spineart SA - Overview
Exhibit 165: Spineart SA - Product / Service
Exhibit 166: Spineart SA - Key offerings
12.16 Stryker Corp.
Exhibit 167: Stryker Corp. - Overview
Exhibit 168: Stryker Corp. - Business segments
Exhibit 169: Stryker Corp. - Key news
Exhibit 170: Stryker Corp. - Key offerings
Exhibit 171: Stryker Corp. - Segment focus
12.17 ulrich GmbH and Co. KG
Exhibit 172: ulrich GmbH and Co. KG - Overview
Exhibit 173: ulrich GmbH and Co. KG - Product / Service
Exhibit 174: ulrich GmbH and Co. KG - Key offerings
13 Appendix
13.1 Scope of the report
13.2 Inclusions and exclusions checklist
Exhibit 175: Inclusions checklist
Exhibit 176: Exclusions checklist
13.3 Currency conversion rates for US$
Exhibit 177: Currency conversion rates for US$
13.4 Research methodology
Exhibit 178: Research methodology
Exhibit 179: Validation techniques employed for market sizing
Exhibit 180: Information sources
13.5 List of abbreviations
Exhibit 181: List of abbreviations
About Us
Technavio is a leading global technology research and advisory company. Their research and analysis focus on emerging market trends and provide actionable insights to help businesses identify market opportunities and develop effective strategies to optimize their market positions. With over 500 specialized analysts, Technavio's report library consists of more than 17,000 reports and counting, covering 800 technologies, spanning 50 countries. Their client base consists of enterprises of all sizes, including more than 100 Fortune 500 companies. This growing client base relies on Technavio's comprehensive coverage, extensive research, and actionable market insights to identify opportunities in existing and potential markets and assess their competitive positions within changing market scenarios.
Contact
Technavio Research
Jesse Maida
Media & Marketing Executive
US: +1 844 364 1100
UK: +44 203 893 3200
Email: [email protected]
Website:
SOURCE Technavio
100 项与 Spine Wave, Inc. 相关的药物交易
登录后查看更多信息
100 项与 Spine Wave, Inc. 相关的转化医学
登录后查看更多信息
组织架构
使用我们的机构树数据加速您的研究。
登录
或
管线布局
2026年03月26日管线快照
无数据报导
登录后保持更新
药物交易
使用我们的药物交易数据加速您的研究。
登录
或
转化医学
使用我们的转化医学数据加速您的研究。
登录
或
营收
使用 Synapse 探索超过 36 万个组织的财务状况。
登录
或
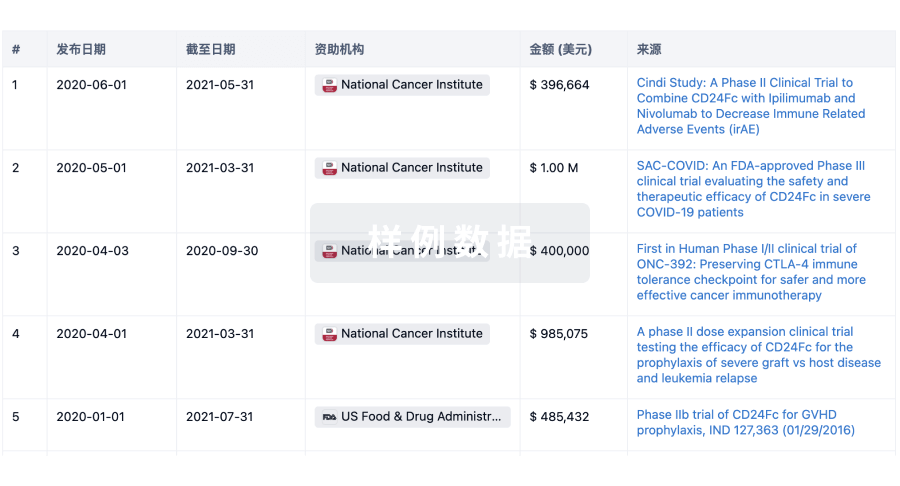
科研基金(NIH)
访问超过 200 万项资助和基金信息,以提升您的研究之旅。
登录
或
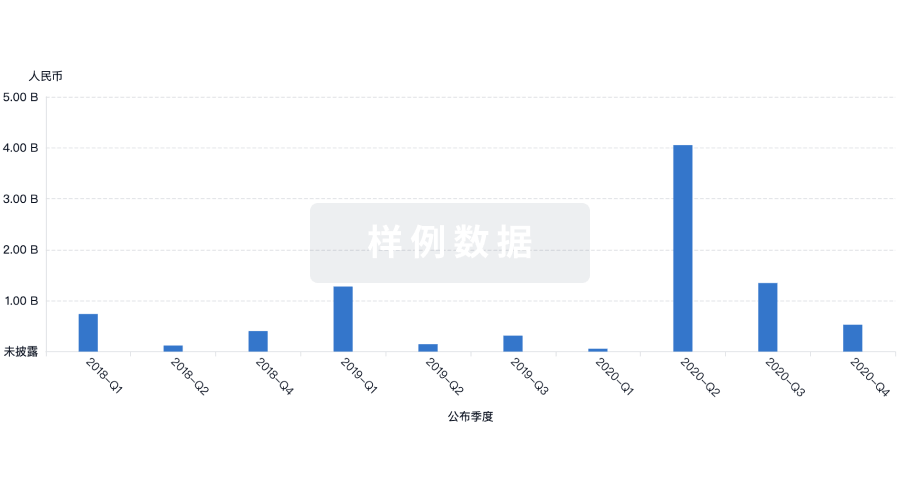
投资
深入了解从初创企业到成熟企业的最新公司投资动态。
登录
或
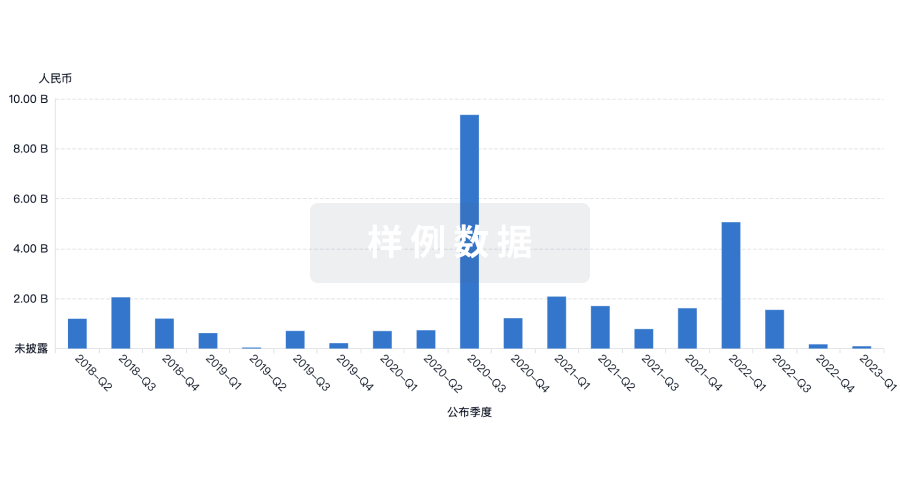
融资
发掘融资趋势以验证和推进您的投资机会。
登录
或
生物医药百科问答
全新生物医药AI Agent 覆盖科研全链路,让突破性发现快人一步
立即开始免费试用!
智慧芽新药情报库是智慧芽专为生命科学人士构建的基于AI的创新药情报平台,助您全方位提升您的研发与决策效率。
立即开始数据试用!
智慧芽新药库数据也通过智慧芽数据服务平台,以API或者数据包形式对外开放,助您更加充分利用智慧芽新药情报信息。
生物序列数据库
生物药研发创新
免费使用
化学结构数据库
小分子化药研发创新
免费使用