预约演示
更新于:2025-12-09

Universiti Tunku Abdul Rahman
更新于:2025-12-09
概览
标签
感染
重组多肽
疾病领域得分
一眼洞穿机构专注的疾病领域
技术平台
公司药物应用最多的技术
靶点
公司最常开发的靶点

暂无数据
关联
靶点 |
作用机制 |
在研机构 |
原研机构 |
在研适应症 |
非在研适应症 |
最高研发阶段 |
首次获批国家/地区 |
首次获批日期 |
NCT07024511
Effectiveness of Auricular Acupuncture for Migraine
NCT07038499
Prevalence and Determinants of Migraine Among Headache Patients
NCT06631846
Efficacy of Music Therapy and Mindfulness Meditation on Hemodynamic Variables and Mental Health Among Coronary Artery Bypass Graft Patients
100 项与 Universiti Tunku Abdul Rahman 相关的临床结果
登录后查看更多信息
登录后查看更多信息
2025-12-08Journal of complementary & integrative medicine
Impact of licorice supplementation on cardiac biomarkers and histomorphological changes in rats
Article
作者: Md Salleh, Muhd Fakh Rur Razi ; Chin, Jin Han ; Keah, Lee Siew ; Yuzhu, Liu ; Arumugam, Sudha ; Othman, Rosfayati
Abstract:
Objectives:
This study aimed to evaluate the impact of oral licorice supplementation on cardiotoxic biomarkers and histological changes in cardiac tissue in rats, given the widespread use of licorice (
Glycyrrhiza glabra
) for its anti-inflammatory, antioxidant, and antimicrobial properties and the concerns about its cardiotoxic effects at higher doses or with short-term repeated use.
Methods:
Twenty-four female Sprague-Dawley rats were divided into four groups (n=6 per group). Groups received either distilled water or licorice extract at 50, 100, and 200 mg/kg/day for 14 days. Cardiac tissue was analyzed via H&E staining, and blood samples were assessed for Troponin-T and Pro-BNP levels.
Results:
No significant changes were observed in Troponin-T and Pro-BNP levels across all groups (p>0.05). Histological analysis revealed mild changes in the cardiac tissues of rats treated with licorice, indicating subtle histomorphological alterations.
Conclusions:
Licorice supplementation at doses of 50, 100, and 200 mg/kg/day did not significantly impact the levels of cardiotoxic biomarkers but mild histomorphological changes were observed in the cardiac tissues of rats. These findings suggest that while licorice is generally safe at these doses, its long-term use at high doses should be approached with caution.
2025-12-01MethodsX
The effects of dynamic neuromuscular stabilization (DNS) approach on gait, lumbopelvic functional stability and abdominal core strength among adolescent idiopathic scoliosis (AIS): A randomized controlled trial study protocol
Article
作者: Vasu, Deepak Thazhakkattu ; Jun, Liow Kai ; Li, Roberta Ong Yi ; Cheng, Chan Siow ; Samsuri, Siti Hazirah Binti ; Mir, Imtiyaz Ali ; Fernandez, Mark Isaac ; Qing, Tan Yin ; Selvakumar, Kiruthika ; Yuet, Ng Jia
Introduction:
Adolescent Idiopathic Scoliosis (AIS) is a three-dimensional spinal deformity affecting young adults aged 10 years and above. Severity of scoliosis usually increase with aged, and hence early detection of scoliosis is crucial for conservative treatment to avoid surgery and preserving health-related quality of life. This study aim to evaluate the effectiveness of Dynamic Neuromuscular Stabilization (DNS) approach in gait, abdominal core stability and lumbopelvic functional stability in individual with AIS.
Methods:
24 targeted AIS participants will be randomly allocated into two group for 12-week interventions, three times per week including 2 non-supervised sessions. Outcome measure will be assessed using measuring tape, stabilizer pressure biofeedback, wearable sensor BTS G-walk® with treadmill. Paired t-test will be used to assess within groups and independent t-test will be used to assess the efficacy of intervention between groups.
Results:
This study protocol hypothesizes that DNS approach will have a more significant impact on improving the gait, core stability and lumbopelvic stability among AIS.
Conclusion:
DNS approach can be effectively implemented in clinical settings to enhance the physical and functional mobility AIS patients.
2025-12-01MethodsX
GeoBM: A Python-based tool for integrated visualization of global bibliometric data
Article
作者: Muñoz, Fernando ; Fu, Chun Chong ; Fleta-Asín, Jorge ; Wei, Loo Keat ; Sáenz-Royo, Carlos
The rapid proliferation of scientometric and bibliometric analyses has emphasized the need for robust, scalable methods to visualize complex, large-scale research data. Conventional geospatial visualization techniques-most notably choropleth maps-often introduce significant distortions due to their inability to adequately account for spatial heterogeneity and overdispersion in bibliometric distributions. To address these methodological shortcomings, we propose GeoBM (Geographic Bibliometric Mapping), a computational framework that enables enhanced geovisualization of global scientific output and collaboration patterns. GeoBM integrates normalized country-level publication volumes with bilateral collaboration frequencies to produce high-resolution, interpretable geographic maps that reflect both research intensity and international connectivity. Implemented in Python, the framework leverages modular, algorithmically optimized routines for real-time data processing and visualization, incorporating statistical controls to mitigate overdispersion and enhance visual fidelity. The system supports extensive customization and is deployed via open-source platforms such as Google Colab and GitHub, facilitating broad accessibility and reproducibility. By providing a dual-focus representation of publication density and collaborative strength, GeoBM offers a powerful tool for the spatial analysis of global research networks, contributing to more nuanced evaluations in science policy, research management, and innovation studies.
100 项与 Universiti Tunku Abdul Rahman 相关的药物交易
登录后查看更多信息
100 项与 Universiti Tunku Abdul Rahman 相关的转化医学
登录后查看更多信息
组织架构
使用我们的机构树数据加速您的研究。
登录
或
管线布局
2026年07月22日管线快照
管线布局中药物为当前组织机构及其子机构作为药物机构进行统计,早期临床1期并入临床1期,临床1/2期并入临床2期,临床2/3期并入临床3期
临床前
1
登录后查看更多信息
当前项目
登录后查看更多信息
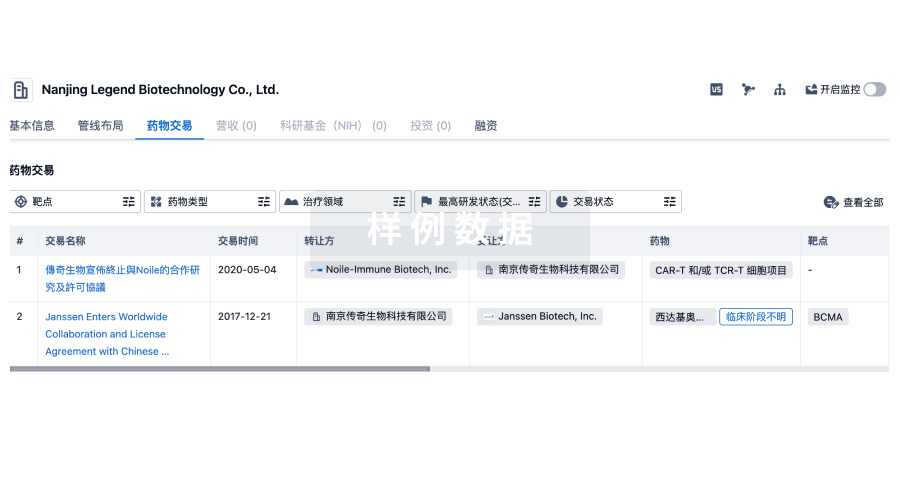
药物交易
使用我们的药物交易数据加速您的研究。
登录
或
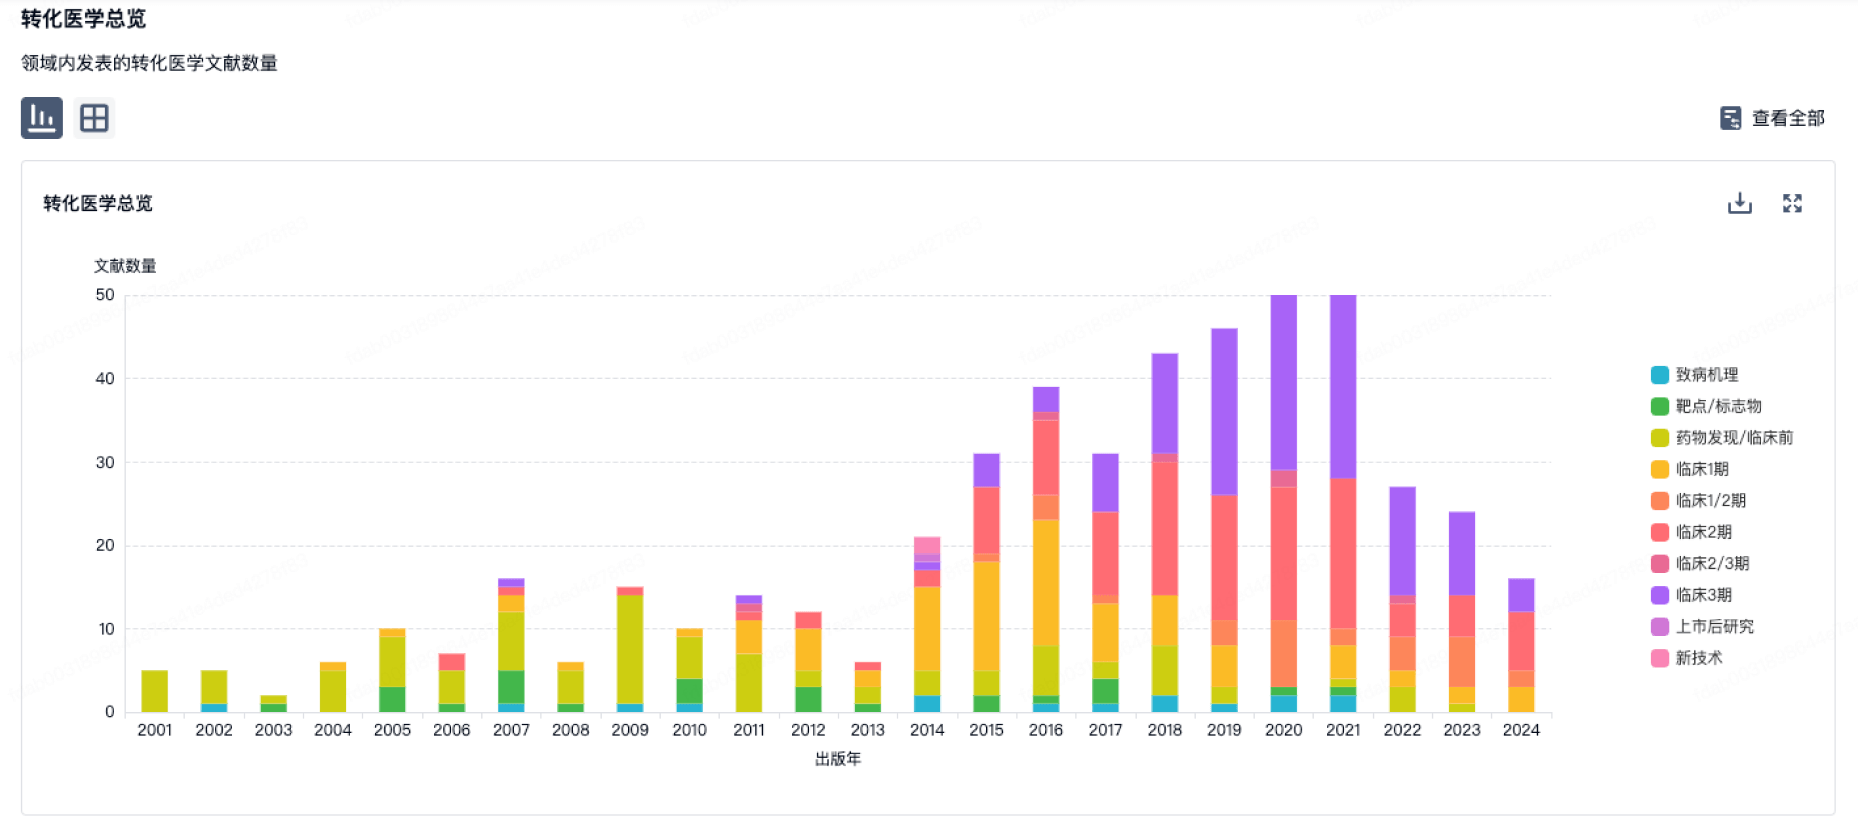
转化医学
使用我们的转化医学数据加速您的研究。
登录
或
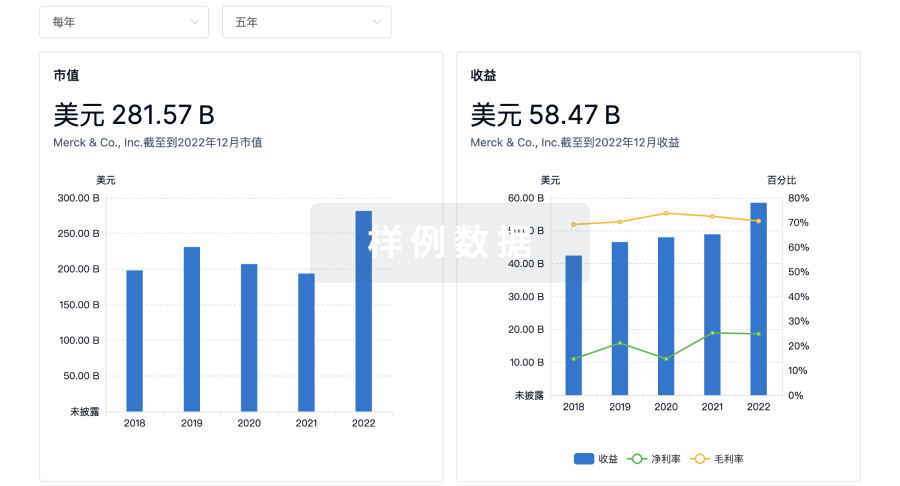
营收
使用 Synapse 探索超过 36 万个组织的财务状况。
登录
或
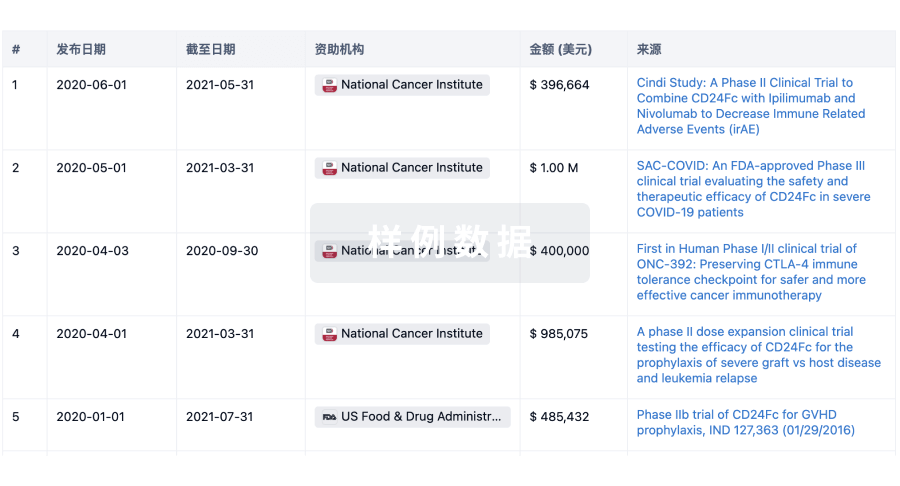
科研基金(NIH)
访问超过 200 万项资助和基金信息,以提升您的研究之旅。
登录
或
投资
深入了解从初创企业到成熟企业的最新公司投资动态。
登录
或
融资
发掘融资趋势以验证和推进您的投资机会。
登录
或
芽仔
全新生物医药AI Agent 覆盖科研全链路,让突破性发现快人一步
立即开始免费试用!
智慧芽新药情报库是智慧芽专为生命科学人士构建的基于AI的创新药情报平台,助您全方位提升您的研发与决策效率。
立即开始数据试用!
智慧芽新药库数据也通过智慧芽数据服务平台,以API或者数据包形式对外开放,助您更加充分利用智慧芽新药情报信息。
生物序列数据库
生物药研发创新
免费使用
化学结构数据库
小分子化药研发创新
免费使用