预约演示
更新于:2025-05-07

Carl Zeiss Vision
更新于:2025-05-07
概览
关联
ACTRN12611000582954
Investigation of the efficacy of the third generation MC PAL lenses in the retardation of juvenile onset myopic progression in 7 to 12 year old children.
ACTRN12608000566336
Investigation of the efficacy of the second generation Myopia Control Progressive Addition Lenses in the retardation of juvenile onset myopic progression in 6 to 12 year old children.
100 项与 Carl Zeiss Vision 相关的临床结果
登录后查看更多信息
登录后查看更多信息
LaborPraxis
Measurement, classification, and evaluation. Particle size analysis in research and quality control
作者: Smolej, Vito
100 项与 Carl Zeiss Vision 相关的药物交易
登录后查看更多信息
100 项与 Carl Zeiss Vision 相关的转化医学
登录后查看更多信息
组织架构
使用我们的机构树数据加速您的研究。
登录
或
管线布局
2026年02月08日管线快照
无数据报导
登录后保持更新
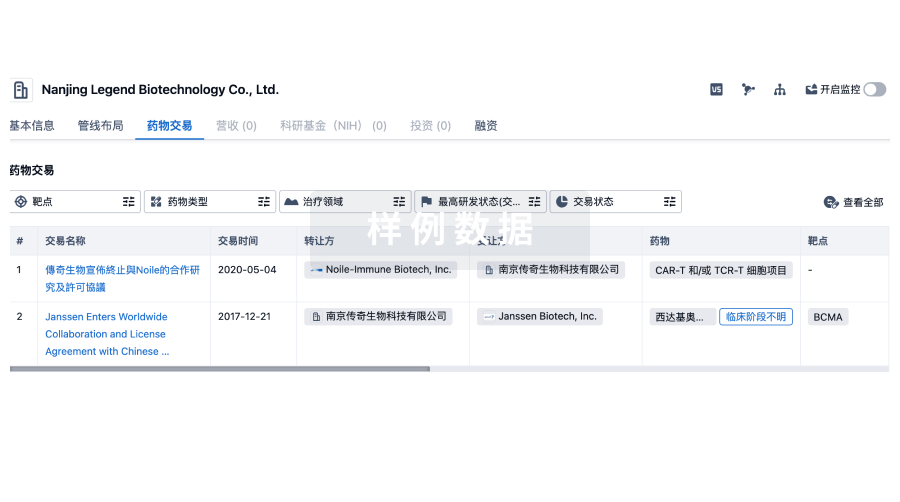
药物交易
使用我们的药物交易数据加速您的研究。
登录
或
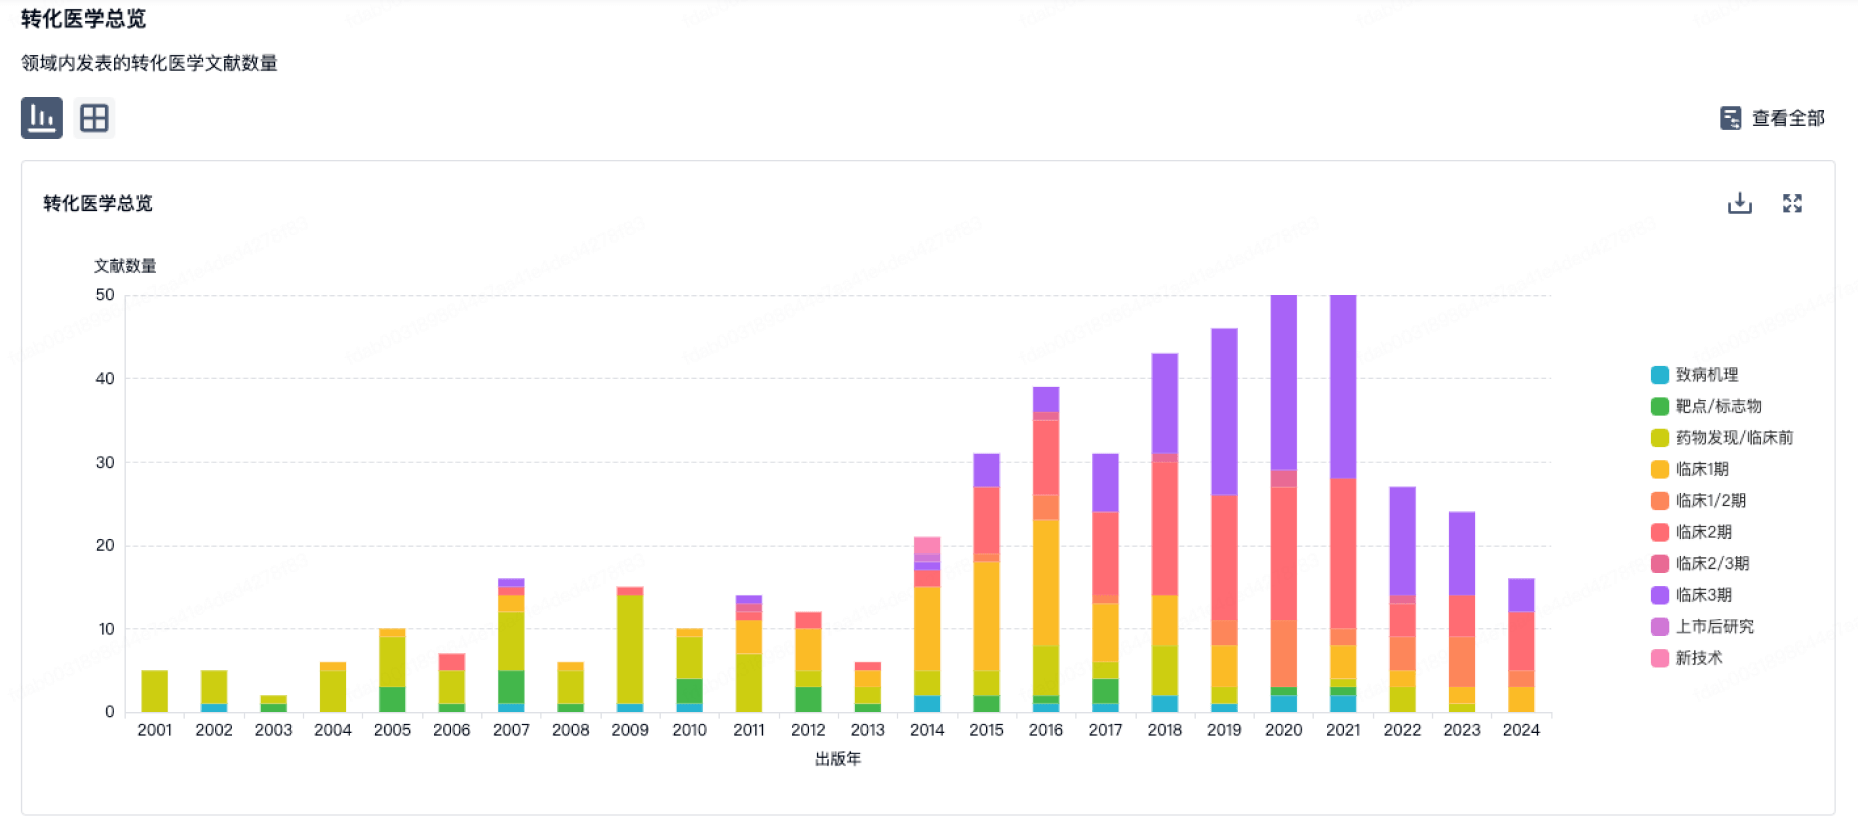
转化医学
使用我们的转化医学数据加速您的研究。
登录
或
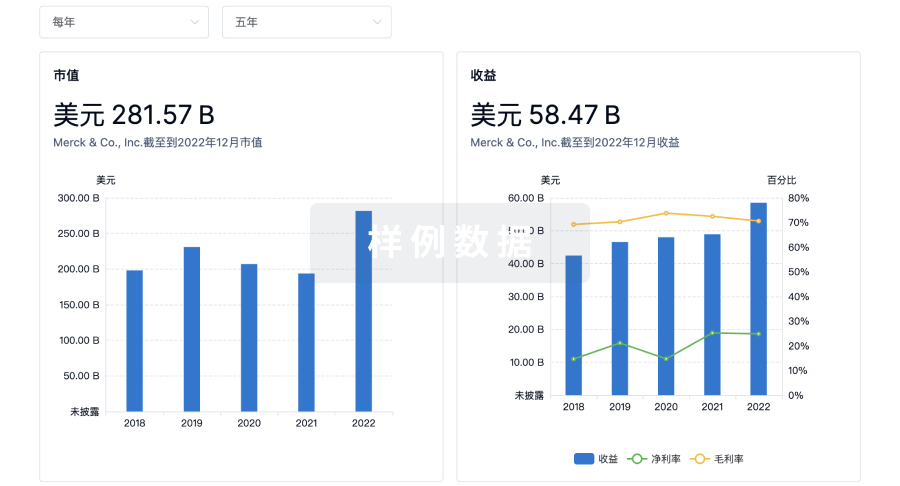
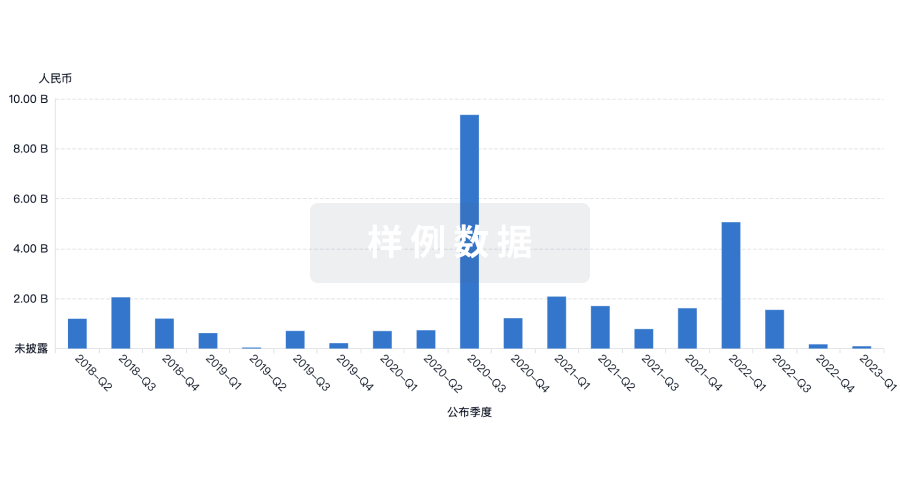
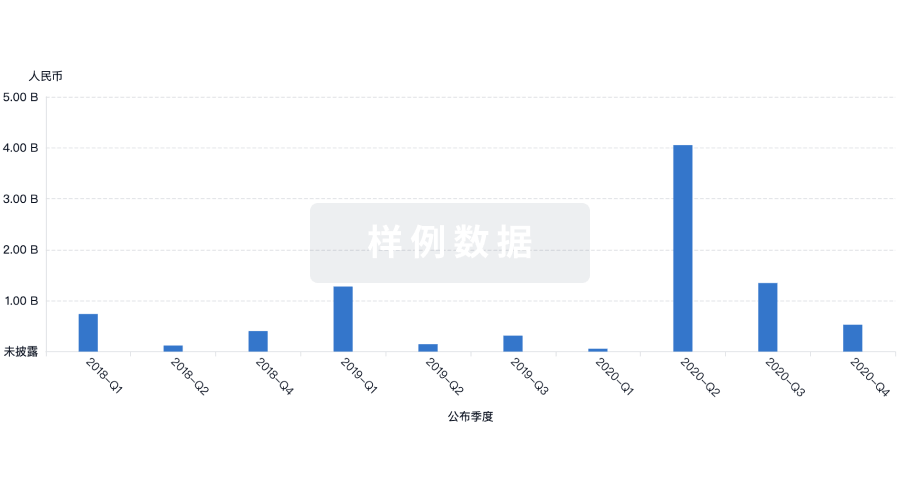
营收
使用 Synapse 探索超过 36 万个组织的财务状况。
登录
或
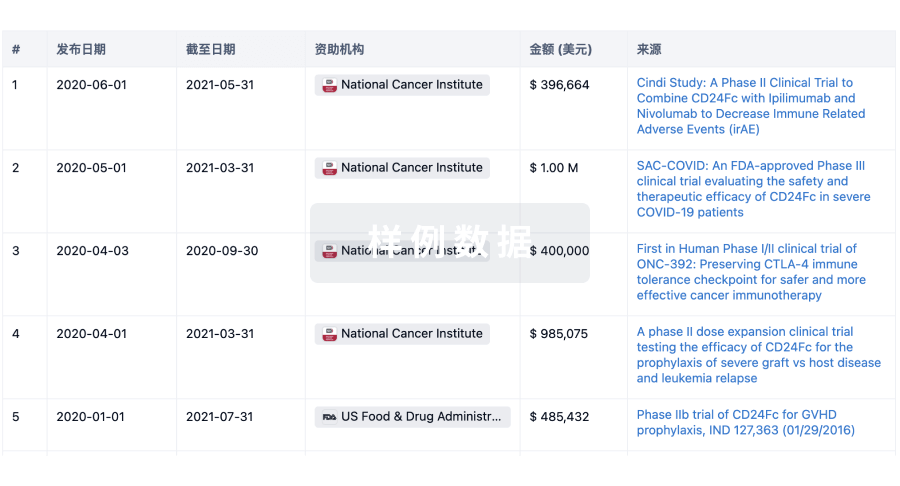
科研基金(NIH)
访问超过 200 万项资助和基金信息,以提升您的研究之旅。
登录
或
投资
深入了解从初创企业到成熟企业的最新公司投资动态。
登录
或
融资
发掘融资趋势以验证和推进您的投资机会。
登录
或
生物医药百科问答
全新生物医药AI Agent 覆盖科研全链路,让突破性发现快人一步
立即开始免费试用!
智慧芽新药情报库是智慧芽专为生命科学人士构建的基于AI的创新药情报平台,助您全方位提升您的研发与决策效率。
立即开始数据试用!
智慧芽新药库数据也通过智慧芽数据服务平台,以API或者数据包形式对外开放,助您更加充分利用智慧芽新药情报信息。
生物序列数据库
生物药研发创新
免费使用
化学结构数据库
小分子化药研发创新
免费使用