预约演示
更新于:2026-03-04

Dante Genomics
更新于:2026-03-04
概览
标签
神经系统疾病
肿瘤
呼吸系统疾病
寡核苷酸
mRNA
预防性疫苗
疾病领域得分
一眼洞穿机构专注的疾病领域

暂无数据
技术平台
公司药物应用最多的技术
暂无数据
靶点
公司最常开发的靶点
暂无数据
| 排名前五的药物类型 | 数量 |
|---|---|
| 寡核苷酸 | 4 |
| mRNA | 1 |
| 预防性疫苗 | 1 |
| mRNA疫苗 | 1 |
| 排名前五的靶点 | 数量 |
|---|---|
| SARS-CoV-2 antigen(新冠病毒抗原) | 1 |
关联
6
项与 Dante Genomics 相关的药物靶点- |
作用机制- |
在研机构 |
原研机构 |
在研适应症 |
非在研适应症- |
最高研发阶段临床前 |
首次获批国家/地区- |
首次获批日期- |
靶点- |
作用机制- |
在研机构 |
原研机构 |
在研适应症 |
非在研适应症- |
最高研发阶段临床前 |
首次获批国家/地区- |
首次获批日期- |
靶点- |
作用机制- |
在研机构 |
原研机构 |
在研适应症 |
非在研适应症- |
最高研发阶段临床前 |
首次获批国家/地区- |
首次获批日期- |
100 项与 Dante Genomics 相关的临床结果
登录后查看更多信息
0 项与 Dante Genomics 相关的专利(医药)
登录后查看更多信息
24
项与 Dante Genomics 相关的新闻(医药)2023-09-20
– Dante to utilize Amazon Bedrock to build state-of-the-art large language model (LLM) with broad genomic and clinical applications –
– Amazon Bedrock will leverage Dante's expertise with clinical interpretation and massive whole genome database –
– Groundbreaking collaboration pioneering the use case for LLMs in personalized medicine, enabling extraction of phenotypes of interest to identify feasible and related genetic conditions –
NEW YORK, Sept. 20, 2023 /PRNewswire/ -- Dante Genomics, a global leader in genomics and precision medicine, today announced a strategic AI collaboration with Amazon Web Services (AWS) to bring generative AI to the clinical care of patients with genomic diseases.
Dante Genomics' early focus on whole genome sequencing provides the company with a natural competitive advantage to build large language models (LLMs) for clinical genomics. Each genome has 10,000 times more data than a traditional genetic panel and more than 20 times more data than whole exome sequencing.
"While companies were debating whether the exome was too much data, we were laser focused on whole genome sequencing," said Mattia Capulli, PhD, Co-founder and Chief Scientific Officer of Dante Genomics. "It was not easy, but the dedicated time and strategic investments are paying off, giving us an amazing source of data to advance LLMs for clinical genomics."
Dante Genomics utilizes the large language model (LLM) Amazon Bedrock on the AWS platform to enable Dante customers to better access and navigate its broad and growing collection of more than 130 genomic reports with genomic applications across clinical areas, including proactive screening, longevity and personalized medicine.
"For more than seven years, Dante Genomics has been steadfast in its mission to deliver whole genome sequencing at scale, and with an ever-growing database, we are unmatched in our expertise in the clinical utility of the genome," said Andrea Riposati, Co-founder and CEO of Dante Genomics. "By partnering with the tech experts at AWS, Amazon Bedrock as a platform will help us make great strides in revolutionizing the everyday application of genomic data in personalized medicine, delivering better health outcomes with genomic data as a foundation."
In this collaboration, Dante Genomics aims to allow a subset of phenotypes such as eye color, ancestry and monogenic disorders, such as cardiomyopathies, respiratory conditions and seizures, to be explored using a chat-style interface.
This is a groundbreaking use case for LLMs in genomic medicine based on extensive research into training honest and responsible AI systems. The system will relay the outcome of genetic inference to the patient, allow the patient to easily distinguish comorbidities and request additional information, and accurately identify when a physician's involvement is necessary.
About Dante Genomics
Dante Genomics is a global genomic information company building and commercializing a new class of transformative health and longevity applications based on whole genome sequencing and software. The Company uses its platform to deliver better patient outcomes, prevention, enhanced diagnostics and personalized medicine. The Company's assets include one of the largest private genome databases with research consent, proprietary software designed to unleash the power of genomic data at scale and proprietary processes which enable an industrial approach to genomic sequencing.
Contact:
Laura D'Angelo
VP of Investor Relations
[email protected]
+39 0862 191 0671
SOURCE Dante Genomics
2023-08-14
Revenue of $20.5 million, an increase of 45% year-over-year
Cash and investments of approximately $474 million, a strong capital position to fund current and future business initiatives
Reiterating full year 2023 revenue guidance and operating expense target
Management to host conference call today at 4:30pm ET
BOULDER, Colo., Aug. 14, 2023 (GLOBE NEWSWIRE) -- SomaLogic, Inc., a leader in proteomics technology, today reported financial results for the quarter ended June 30, 2023.
“Our second quarter results are in line with our expectations despite navigating operational changes and a dynamic macroeconomic backdrop. While our progress this quarter in both core assay services and distributed kits is encouraging, there is still more work to be done,” said Adam Taich, SomaLogic’s Interim Chief Executive Officer. “We have the benefit of a strong cash position, yet remain fully committed to spending discipline and continued operational rationalization to maximize SomaLogic’s long-term position in a growing proteomics market.”
Recent Updates
Expanded distributed kits offering with additional Authorized Sites, including Citogen and Dante Genomics in Europe
Advanced development and manufacturing work to support 10k SomaScan assay launch by year-end 2023
Continued collaboration with Illumina ahead of co-branded next-generation sequencing (NGS)-based proteomics kit early access launch in 2024
Appointed Eliot Lurier, CPA, to Interim Chief Financial Officer
Second Quarter 2023 Financial Results
Revenue for the three months ended June 30, 2023 was $20.5 million, a 45% increase from $14.1 million in the corresponding period of 2022. Excluding Q2 2022 royalty revenue from NEB, revenue grew 55%.
Gross margin for the three months ended June 30, 2023 was 45.4% compared to 50.0% for the corresponding period of 2022. The decrease was driven by lower royalty revenue.
Research and development expenses decreased by $6.8 million, and selling, general and administrative expenses decreased by $7.2 million in the three months ended June 30, 2023, compared to the corresponding period of 2022. The decrease aligns with the Company’s previously announced expense reduction initiatives with an operating expense target of approximately $170 million for full-year 2023.
Net loss was $24.8 million for the three months ended June 30, 2023, or a loss of $0.13 per share, as compared to a loss of $23.0 million, or $0.13 per share, in the corresponding period of 2022.
Adjusted EBITDA was a loss of $28.9 million for the three months ended June 30, 2023, compared with an adjusted EBITDA loss of $46.4 million in the corresponding period of 2022.
Cash, cash equivalents, and short-term investments were $474.2 million as of June 30, 2023.
2023 Financial Guidance
SomaLogic expects revenue for the full year 2023 to range from $80 to $84 million.
Webcast and Conference Call Details
SomaLogic will host a conference call at 4:30 p.m. ET on Monday, August 14, 2023 to discuss its second quarter 2023 financial results. Those interested in listening to the conference call should register online here. Participants are encouraged to register more than 15 minutes before the start of the call. A live and archived version of the webcast will be available at
About SomaLogic
SomaLogic is catalyzing drug research and development and biomarker identification as a global leader in proteomics technology. With a single 55 microliter plasma or serum sample, SomaLogic can run 7,000 protein measurements, covering more than a third of the approximately 20,000 proteins in the human body and twice as many as other proteomic platforms. For more than 20 years we’ve supported pharmaceutical companies, and academic and contract research organizations who rely on our protein detection and analysis technologies to fuel drug, disease, and treatment discoveries in such areas as oncology, diabetes, and cardiovascular, liver and metabolic diseases. Find out more at and follow @somalogic on LinkedIn.
Non-GAAP Financial Measures
We present non-GAAP financial measures in order to assist readers of our condensed consolidated financial statements in understanding the core operating results used by management to evaluate and run the business, as well as, for financial planning purposes. Our non-GAAP financial measure, Adjusted EBITDA, provides an additional tool for investors to use in comparing our financial performance over multiple periods.
Adjusted EBITDA is a key performance measure that our management uses to assess its operating performance. Adjusted EBITDA facilitates internal comparisons of our operating performance on a more consistent basis, and we use this measure for business planning, forecasting, and decision-making. We believe that Adjusted EBITDA enhances an investor’s understanding of our financial performance as it is useful in assessing our operating performance from period-to-period by excluding certain items that we believe are not representative of our core business.
Our Adjusted EBITDA may not be comparable to similarly titled measures of other companies because they may not calculate this measure in the same manner. Adjusted EBITDA is not prepared in accordance with GAAP and should not be considered in isolation of, or as an alternative to, measures prepared in accordance with GAAP. When evaluating our performance, you should consider Adjusted EBITDA alongside other financial performance measures prepared in accordance with GAAP, including net loss.
Forward Looking Statements Disclaimer
This press release contains certain forward-looking statements within the meaning of the “safe harbor” provisions of the Private Securities Litigation Reform Act of 1995 and other federal securities laws. All statements, other than statements of historical fact included in this press release, regarding our strategy, future operations, financial position, estimated revenues, projections, prospects, plans and objectives of management are forward-looking statements. These forward-looking statements generally are identified by the words “believe,” “project,” “forecast,” “guidance,” “expect,” “anticipate,” “estimate,” “intend,” “strategy,” “future,” “opportunity,” “plan,” “may,” “should,” “will,” “would,” “will be,” “continue,” “will likely result,” “possible,” “potential,” “predict,” “pursue,” “target” and similar expressions, although not all forward-looking statements contain such identifying words. Forward-looking statements are predictions, projections and other statements about future events that are based on current expectations and assumptions and, as a result, are subject to risks and uncertainties. Forward-looking statements do not guarantee future performance and involve known and unknown risks, uncertainties and other factors. Many factors could cause actual future events to differ materially from the forward-looking statements in this press release, including factors which are beyond SomaLogic’s control. You should carefully consider these risks and uncertainties, including, but not limited to, those factors described under Part I, Item 1A – “Risk Factors” in our Annual Report on Form 10-K and other filings we make with the Securities and Exchange Commission. These filings identify and address important risks and uncertainties that could cause actual events and results to differ materially from those contained in the forward-looking statements. Forward-looking statements speak only as of the date they are made. Readers are cautioned not to put undue reliance on forward-looking statements, and SomaLogic assumes no obligation and does not intend to update or revise these forward-looking statements, whether as a result of new information, future events, or otherwise. Should one or more of these risks or uncertainties materialize, or should any of the assumptions prove incorrect, actual results may vary in material respects from those projected in these forward-looking statements. The Company will not and does not undertake any obligation to update or revise any forward-looking statements, whether as a result of new information, future events or otherwise, except as may be required under applicable securities laws.
SomaLogic Contact
Emilia Costales
720-798-5054
ecostales@somalogic.com
Investor Contact
Marissa Bych
Gilmartin Group LLC
investors@somalogic.com
SomaLogic, Inc.
Condensed Consolidated Statements of Operations and Comprehensive Loss
Unaudited
(in thousands, except share data)
Three Months Ended June 30,
Six Months Ended June 30,
2023
2022
2023
2022
Revenue
Assay services revenue
$
16,597
$
10,931
$
35,016
$
29,731
Product revenue
2,909
714
4,095
1,167
Collaboration revenue
762
762
1,525
1,525
Other revenue
200
1,737
211
4,701
Total revenue
20,468
14,144
40,847
37,124
Operating expenses
Cost of assay services revenue
9,677
6,571
21,359
17,951
Cost of product revenue
1,498
506
2,132
778
Research and development
10,815
17,636
24,882
31,436
Selling, general and administrative
29,573
36,812
63,762
67,627
Total operating expenses
51,563
61,525
112,135
117,792
Loss from operations
(31,095
)
(47,381
)
(71,288
)
(80,668
)
Other income
Interest income and other, net
5,798
838
10,723
1,047
Change in fair value of warrant liabilities
527
14,536
1,580
27,176
Change in fair value of earn-out liability
—
9,027
15
25,489
Total other income
6,325
24,401
12,318
53,712
Net loss before income tax benefit (provision)
$
(24,770
)
$
(22,980
)
$
(58,970
)
$
(26,956
)
Income tax benefit (provision)
(2
)
(5
)
(4
)
(8
)
Net loss
(24,772
)
(22,985
)
(58,974
)
(26,964
)
Other comprehensive income (loss)
Net unrealized gain (loss) on available-for-sale securities
177
(209
)
528
(861
)
Foreign currency translation loss
4
(11
)
2
(14
)
Total other comprehensive income (loss)
$
181
$
(220
)
$
530
$
(875
)
Comprehensive loss
(24,591
)
(23,205
)
(58,444
)
(27,839
)
Net loss per share, basic and diluted
$
(0.13
)
$
(0.13
)
$
(0.32
)
$
(0.15
)
Weighted-average shares used to compute net loss per share, basic and diluted
186,741,112
183,143,391
186,633,391
182,599,949
SomaLogic, Inc.
Condensed Consolidated Balance Sheets
Unaudited
(in thousands, except share data)
June 30,
2023
December 31,
2022
ASSETS
Current assets
Cash and cash equivalents
$
354,544
$
421,830
Investments
119,646
117,758
Accounts receivable, net
21,750
17,006
Inventory
15,123
13,897
Deferred costs of services
440
1,337
Prepaid expenses and other current assets
4,760
9,873
Total current assets
516,263
581,701
Non-current inventory
10,296
4,643
Accounts receivable, net of current portion
9,041
9,284
Property and equipment, net
18,668
19,564
Other long-term assets
4,379
5,083
Intangible assets
16,700
16,700
Goodwill
10,399
10,399
Total assets
$
585,746
$
647,374
LIABILITIES AND STOCKHOLDERS’ EQUITY
Current liabilities
Accounts payable
$
13,079
$
16,794
Accrued liabilities
10,926
20,678
Deferred revenue
5,083
3,383
Other current liabilities
2,413
2,477
Total current liabilities
31,501
43,332
Warrant liabilities
2,633
4,213
Deferred revenue, net of current portion
31,207
31,732
Other long-term liabilities
5,253
5,539
Total liabilities
70,594
84,816
Commitments and contingencies
Stockholders’ equity:
Preferred stock, $0.0001 par value; 1,000,000 shares authorized; no shares issued and outstanding at June 30, 2023 and December 31, 2022
—
—
Common stock, $0.0001 par value; 600,000,000 shares authorized; 188,071,445 and 187,647,973 shares issued and outstanding at June 30, 2023 and December 31, 2022, respectively
19
19
Additional paid-in capital
1,182,645
1,171,122
Accumulated other comprehensive income (loss)
17
(513
)
Accumulated deficit
(667,529
)
(608,070
)
Total stockholders’ equity
515,152
562,558
Total liabilities and stockholders’ equity
$
585,746
$
647,374
SomaLogic, Inc.
Reconciliation of net loss in accordance with GAAP to non-GAAP adjusted EBITDA
Three Months Ended June 30,
Six Months Ended June 30,
(in thousands)
2023
2022
2023
2022
Net loss
$
(24,772
)
$
(22,985
)
$
(58,974
)
$
(26,964
)
Adjustments to reconcile to EBITDA:
Interest income and other, net
(5,798
)
(838
)
(10,723
)
(1,047
)
Income tax provision
2
5
4
8
Depreciation and amortization
1,890
963
3,644
1,718
EBITDA
(28,678
)
(22,855
)
(66,049
)
(26,285
)
Adjustments to reconcile to Adjusted EBITDA:
Change in fair value of warrant liabilities (1)
(527
)
(14,536
)
(1,580
)
(27,176
)
Change in fair value of earn-out liability (2)
—
(9,027
)
(15
)
(25,489
)
Stock compensation expense related to equity modifications (3)
272
—
1,224
—
Restructuring charges (4)
59
—
1,100
—
Adjusted EBITDA
$
(28,874
)
$
(46,418
)
$
(65,320
)
$
(78,950
)
(1)
Represents change in fair value of warrant liabilities.
(2)
Represents change in fair value of earn-out liability.
(3)
Represents stock-based compensation expense related to equity award modifications that occurred separately from our Strategic Reorganization.
(4)
Represents restructuring charges related to the Strategic Reorganization consisting of severance costs, other termination benefit costs, and non-cash stock-based compensation expense.
财报高管变更
2023-06-05
– New offering will give patients and their families the definitive diagnoses needed and allow them to move forward with a better understanding of their condition –
NEW YORK, June 5, 2023 /PRNewswire/ -- Dante Genomics, a global leader in genomics and precision medicine, today announced the launch of its Rare Disease Health Package to revolutionize rare disease diagnosis with whole genome sequencing testing.
The
Rare Disease Health Package includes pre- and post-telemedicine consultations with specialist doctors, providing access to specialists who may not be available in a patient's area. Dante removes financial barriers to care by identifying potential treatments and management strategies for rare diseases. The package also prioritizes privacy and security, with a commitment to not selling genomic and personal information and to remain in compliance with all GDPR and HIPAA regulations. The 30X coverage, clinical-grade WGS used in the package ensures high accuracy and confidence in the results that are critical in identifying variants that may be causative of rare diseases or other conditions.
To learn more about Dante's Rare Disease Health Package, visit dantelabs.com.
Rare diseases are a diverse group of over 8,000 distinct conditions with the majority having a genetic origin, and it is estimated there are 400 million people living with rare disease globally. With rare diseases in particular, early diagnosis is crucial for optimal treatment, care and genetic counseling regarding prognosis and recurrence risk. Recent advances in genetic testing, such as whole genome sequencing (WGS), have significantly increased the likelihood of receiving genetic diagnosis for patients with rare diseases.
"For those people living with a rare disease, an accurate diagnosis is invaluable and the first step in the treatment and management of their condition, and whole genome sequencing is the only solution to deliver the diagnoses these patients are in desperate need of," said Andrea Riposati, Co-founder and CEO of Dante Genomics." This approach can save time and money, identify potential treatments and management strategies, and provide closure for patients and their families who are struggling with what can be years long diagnostic odysseys."
About Dante Genomics
Dante Genomics is a global genomic information company building and commercializing a new class of transformative health and longevity applications based on whole genome sequencing and software. The Company uses its platform to deliver better patient outcomes, prevention, enhanced diagnostics and personalized medicine. The Company's assets include one of the largest private genome databases with research consent, proprietary software designed to unleash the power of genomic data at scale and proprietary processes which enable an industrial approach to genomic sequencing.
Contact:
Laura D'Angelo
VP of Investor Relations
[email protected]
+39 0862 191 0671
SOURCE Dante Genomics
100 项与 Dante Genomics 相关的药物交易
登录后查看更多信息
100 项与 Dante Genomics 相关的转化医学
登录后查看更多信息
组织架构
使用我们的机构树数据加速您的研究。
登录
或
管线布局
2026年04月09日管线快照
管线布局中药物为当前组织机构及其子机构作为药物机构进行统计,早期临床1期并入临床1期,临床1/2期并入临床2期,临床2/3期并入临床3期
药物发现
1
5
临床前
登录后查看更多信息
当前项目
药物交易
使用我们的药物交易数据加速您的研究。
登录
或
转化医学
使用我们的转化医学数据加速您的研究。
登录
或
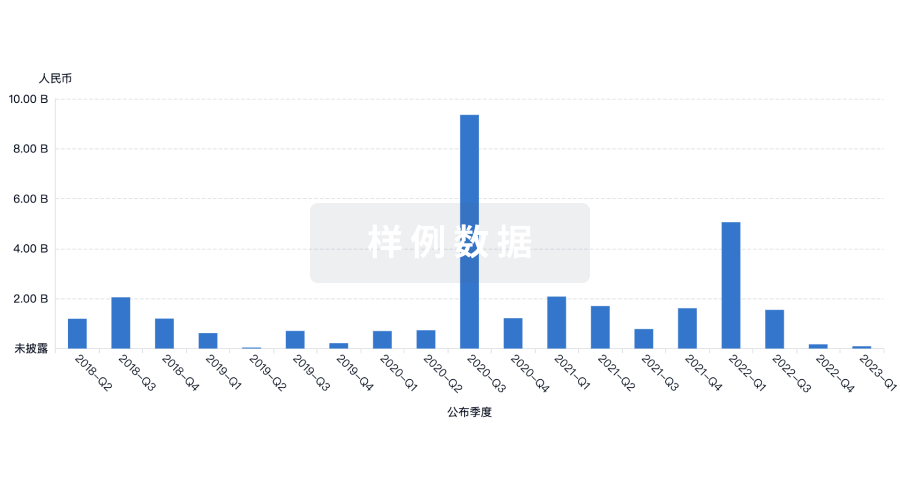
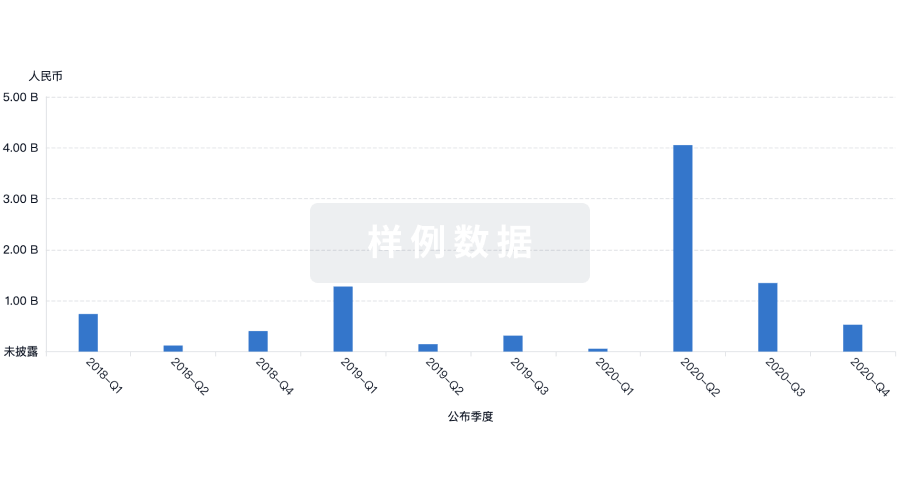
营收
使用 Synapse 探索超过 36 万个组织的财务状况。
登录
或
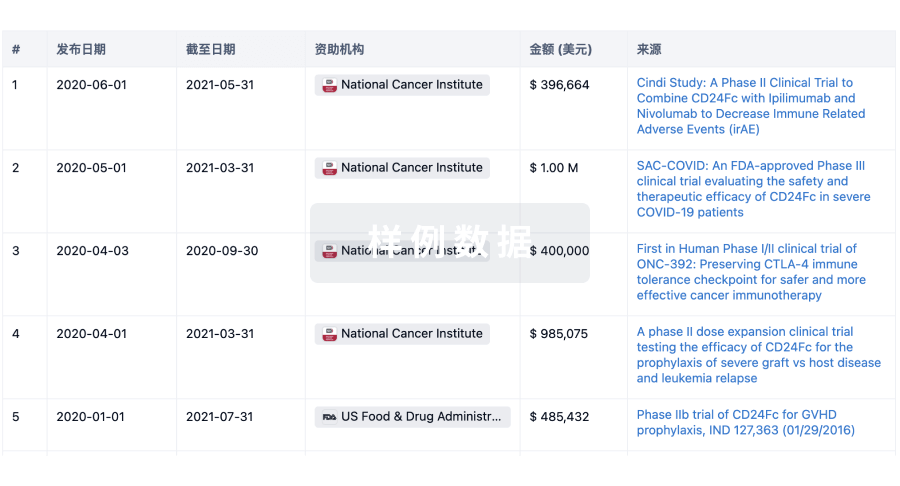
科研基金(NIH)
访问超过 200 万项资助和基金信息,以提升您的研究之旅。
登录
或
投资
深入了解从初创企业到成熟企业的最新公司投资动态。
登录
或
融资
发掘融资趋势以验证和推进您的投资机会。
登录
或
生物医药百科问答
全新生物医药AI Agent 覆盖科研全链路,让突破性发现快人一步
立即开始免费试用!
智慧芽新药情报库是智慧芽专为生命科学人士构建的基于AI的创新药情报平台,助您全方位提升您的研发与决策效率。
立即开始数据试用!
智慧芽新药库数据也通过智慧芽数据服务平台,以API或者数据包形式对外开放,助您更加充分利用智慧芽新药情报信息。
生物序列数据库
生物药研发创新
免费使用
化学结构数据库
小分子化药研发创新
免费使用