预约演示
更新于:2026-03-03
Materialise NV
更新于:2026-03-03
概览
关联
10
项与 Materialise NV 相关的临床试验NCT06910033
CMF SafeTi Fit: Long-term Safety and Performance of CMF Porous Titanium Implants
The goal of this retrospective study is to evaluate the clinical characteristics, efficiency, safety, and long-term performance of craniomaxillofacial (CMF) Porous Titanium Implants within the standard of care across children (0 - <12 years old), adolescent (12 - <22 years old), and adult (≥ 22 years old) populations.
开始日期2025-11-01 |
申办/合作机构 |
NCT06951178
Unlocking TMJs Clinical Study: Safety and Performance of Materialise's Patient-specific TMJ System
This is a long-term (10 years), retrospective-prospective, observational, single-arm, monocenter study of patients to be treated with the Materialise TMJ Total Arthroplasty System for TMJ replacement. The study will evaluate the efficiency, safety, clinical performance, accuracy, benefits, and risks associated with long-term use and the impact on life quality and diet of the TMJ system, its fixation devices, TMJ Implant trial, and guides in the adolescent and adult populations.
开始日期2025-06-01 |
申办/合作机构 |
NCT06406452
A Multi-Center Trial to Assess the Safety and Effectiveness of a Bioresorbable Tracheobronchial Splint in Pediatric Subjects With Clinically Significant Tracheobronchomalacia
The purpose of this study is to learn if a three-dimensional (3D) printed airway splint device made to hold open a collapsing airway is a safe and effective treatment of Tracheobronchomalacia (TBM) in children.
The airway splint is bioresorbable, meaning the child's body will absorb the splint over about five years.
The airway splint is bioresorbable, meaning the child's body will absorb the splint over about five years.
开始日期2025-01-07 |
申办/合作机构 |

100 项与 Materialise NV 相关的临床结果
登录后查看更多信息
0 项与 Materialise NV 相关的专利(医药)
登录后查看更多信息
10
项与 Materialise NV 相关的文献(医药)2018-04-01·POLYMER TESTING
Investigating the influence of X-ray CT parameters on porosity measurement of laser sintered PA12 parts using a design-of-experiment approach
作者: Tom Craeghs ; Wim Dewulf ; Jean-Pierre Kruth ; Michele Pavan
Polymeric parts produced by Laser Sintering (LS) present a consistent amount of pores with a wide pore size distribution.The knowledge about the porosity value and its distribution within the part allows to perform a quality control of the LS process, and gives insights in how to improve it.In this work the influence of the sample size on the porosity measurement is discussed, as well as its representativeness of the LS process itself.The reliability of porosity measurement of those parts using X-ray Computed Tomog. (CT) is assessed taking into account the influence of the CT scanning parameters, the reconstruction and noise reduction algorithms using a design-of-experiment approach.The quality of the CT datasets obtained is assessed by calculating Contrast-to-Noise Ratio (CNR) and Signal-to-Noise Ratio (SNR) on representative reconstructed images.Repeatability of the measurements is also assessed along the entire workflow: CT acquisition, reconstruction and porosity measurement using com. software packages.
2017-08-01·POLYMER TESTING
On the influence of inter-layer time and energy density on selected critical-to-quality properties of PA12 parts produced via laser sintering
作者: B. Van Hooreweder ; D. Strobbe ; M. Faes ; T. Craeghs ; M. Pavan ; W. Dewulf ; D. Moens
Laser Sintering (LS) of polymers is an Additive Manufacturing technique progressively used to produce functional parts.However, LS parts still present a certain quality variability.Efficient consolidation of the polymeric powder, necessary to obtain a dense part, mainly depends on the viscosity of the molten polymer and on the time given for the polymer to coalesce.The polymer viscosity is a function of the temperature and, consequently, of the energy d. (ED) input by the laser.The sintering time strongly depends on the surface area to be laser-scanned in each layer, which in turn is strongly related to the product complexity and the number of parts within one build.The aim of this work is to investigate how this thermo-temporal effect, influenced by the ED and the inter-layer time, influences the resulting LS PA12 part quality at both micro-level (e.g., porosity, crystallinity) and macro-level (e.g., dimensional accuracy, mech. performance).
2017-06-01·Proceedings of the Institution of Mechanical Engineers. Part H, Journal of engineering in medicine4区 · 工程技术
Accuracy assessment of surgical planning and three-dimensional-printed patient-specific guides for orthopaedic osteotomies
4区 · 工程技术
Article
作者: Robbrecht, Cedric ; Eykens, Hannelore ; Lenaerts, Gerlinde ; Sys, Gwen ; Poffyn, Bart ; Shumelinsky, Felix
This study analyses the accuracy of three-dimensional pre-operative planning and patient-specific guides for orthopaedic osteotomies. To this end, patient-specific guides were compared to the classical freehand method in an experimental setup with saw bones in two phases. In the first phase, the effect of guide design and oscillating versus reciprocating saws was analysed. The difference between target and performed cuts was quantified by the average distance deviation and average angular deviations in the sagittal and coronal planes for the different osteotomies. The results indicated that for one model osteotomy, the use of guides resulted in a more accurate cut when compared to the freehand technique. Reciprocating saws and slot guides improved accuracy in all planes, while oscillating saws and open guides lead to larger deviations from the planned cut. In the second phase, the accuracy of transfer of the planning to the surgical field with slot guides and a reciprocating saw was assessed and compared to the classical planning and freehand cutting method. The pre-operative plan was transferred with high accuracy. Three-dimensional-printed patient-specific guides improve the accuracy of osteotomies and bony resections in an experimental setup compared to conventional freehand methods. The improved accuracy is related to (1) a detailed and qualitative pre-operative plan and (2) an accurate transfer of the planning to the operation room with patient-specific guides by an accurate guidance of the surgical tools to perform the desired cuts.
32
项与 Materialise NV 相关的新闻(医药)2026-02-19
LEUVEN, Belgium--(BUSINESS WIRE)--Materialise NV (Euronext & NASDAQ:MTLS), a global leader in 3D-printed medical devices and software, and a pioneer in additive manufacturing software and services, today announced its financial results for the fourth quarter and full year ended December 31, 2025.
Highlights – Fourth Quarter 2025
Total revenue increased by 6.8% to 70,164 kEUR for the fourth quarter of 2025 from 65,680 kEUR for the corresponding 2024 period, boosted by 16.3% growth in our Materialise Medical segment.
Gross profit as a percentage of revenue for the fourth quarter of 2025 increased to 58.1%, compared to 55.4% for the corresponding 2024 period.
Adjusted EBIT amounted to 3,980 kEUR for the fourth quarter of 2025, representing 5.7% of consolidated revenue, compared to (1,195) kEUR for the corresponding period.
Net result for the fourth quarter of 2025 was 6,206 kEUR, or 0.11 EUR per diluted share, compared to a net result of 2,907 kEUR, or 0.05 EUR per diluted share, for the corresponding 2024 period.
Highlights – Full Year 2025
Total revenue remained stable at 267,633 kEUR for 2025 compared to 266,765 kEUR for 2024, fueled by strong 15.4% growth in our Materialise Medical segment which was offset by lower revenues in our Materialise Manufacturing segment and unfavourable foreign exchange effects.
Gross profit as a percentage of revenue for 2025 increased to 57.1%, compared to 56.5% for 2024.
Adjusted EBITDA increased to 32,386 kEUR for 2025 compared to 31,484 kEUR for 2024. Adjusted EBIT increased to 10,601 kEUR for 2025 from 9,741 kEUR for 2024.
Net profit for 2025 was 7,716 kEUR, or 0.13 EUR per diluted share, compared to a net profit of 13,406 kEUR, or 0.23 EUR per diluted share, for 2024.
Total cash reserves amounted to 133,918 kEUR at the end of 2025.
CEO Brigitte de Vet-Veithen commented, “In the final quarter of 2025, we reached a major milestone with our successful Euronext listing and the announcement of a strategic share buyback program. These steps clearly demonstrate our commitment to delivering long-term shareholder value. We achieved nearly 7% revenue growth and delivered a substantial improvement in operational profitability compared to the fourth quarter of 2024. Our Materialise Medical segment continues to lead the way, achieving another quarterly revenue record and sustaining its double-digit growth path. Our Materialise Software segment maintained steady upward momentum, continuing to build on successive quarterly revenue increases throughout 2025. While our Materialise Manufacturing segment continued to be impacted by soft prototyping demand, its strategic transition towards series manufacturing led to key commercial wins in targeted aerospace and defense markets that we expect will contribute to our results in coming periods. Throughout the last quarter of 2025 we further executed focused cost control measures without compromising R&D investments. With 134 million EUR of cash and cash equivalents on our balance sheet, an improved net cash position and consistently positive operating cash flow, we believe we are financially strong and well-positioned to further drive innovation and capture emerging market opportunities.”
1 The enclosed information constitutes regulated information as defined in the Belgian Royal Decree of 14 November 2007 regarding the duties of issuers of financial instruments which have been admitted for trading on a regulated market.
Fourth Quarter 2025 Results
Total revenue for the fourth quarter of 2025 increased 6.8% to 70,164 kEUR from 65,680 kEUR for the fourth quarter of 2024. Adjusted EBITDA increased to 9,524 kEUR for the fourth quarter of 2025 from 4,306 kEUR for the 2024 period. Adjusted EBIT amounted to 3,980 kEUR, compared to (1,195) kEUR for the same period in 2024.
Revenue from our Materialise Medical segment increased 16.3% to 37,016 kEUR for the fourth quarter of 2025, compared to 31,837 kEUR for the same period in 2024. Adjusted EBITDA for the segment was 13,024 kEUR compared to 9,547 kEUR, while the Adjusted EBITDA margin for the segment was 35.2%, compared to 30.0% for the prior-year period.
Revenue from our Materialise Software segment decreased 1.3% to 10,974 kEUR from 11,124 kEUR for the same quarter last year. Adjusted EBITDA for the segment amounted to 1,701 kEUR compared to 1,123 kEUR, while the Adjusted EBITDA margin for the segment was 15.5%, compared to 10.1% for the prior-year period.
Revenue from our Materialise Manufacturing segment decreased 2.4% to 22,174 kEUR from 22,719 kEUR for the fourth quarter of 2024. Adjusted EBITDA for the segment increased to (2,199) kEUR compared to (2,989) kEUR, while the Adjusted EBITDA margin for the segment was (9.9)% compared to (13.2)% for the prior-year period.
Consolidated gross profit increased 12.2% to 40,791 kEUR for the fourth quarter of 2025 from 36,365 kEUR for the same period last year. Gross profit as a percentage of revenue improved to 58.1%, compared to 55.4%.
Research and development (“R&D”), sales and marketing (“S&M”), and general and administrative (“G&A”) expenses remained in aggregate stable at 38,938 kEUR for the fourth quarter of 2025 compared to 38,990 kEUR for the prior year period, while the fourth quarter of 2025 included non-recurring costs related to the Euronext listing of 750 kEUR.
Net other operating income decreased to 1,258 kEUR compared to 1,357 kEUR for the fourth quarter of 2024.
The operating result was 3,111 kEUR, compared to (1,268) kEUR for the fourth quarter of 2024.
Net financial result for the fourth quarter of 2025 was 2,400 kEUR, compared to 3,301 kEUR for the corresponding period of 2024.
The fourth quarter of 2025 contained net tax income of 695 kEUR, compared to 874 kEUR for the fourth quarter of 2024.
As a result of the above, net profit for the fourth quarter of 2025 was 6,206 kEUR, compared to 2,907 kEUR for the same period in 2024.
At December 31, 2025, we reported 133,918 kEUR cash and cash equivalents on our balance sheet compared to 102,304 kEUR at December 31, 2024. Gross debt amounted to 63,113 kEUR compared to 41,284 kEUR at December 31, 2024. As a result, our net cash position (cash and cash equivalents less gross debt) was 70,805 kEUR, an increase of 9,785 KEUR compared to December 31, 2024.
Cash flow from operating activities for the fourth quarter of the year 2025 was 5,274 kEUR, compared to 6,218 kEUR for the same period in 2024. Total capital expenditures for the fourth quarter of the year 2025 amounted to 4,411 kEUR. The generated free cash flow over the fourth quarter of 2025 amounted to 4,511 kEUR.
Net shareholders’ equity at December 31, 2025 was 255,482 kEUR compared to 248,492 kEUR at December 31, 2024, representing an increase of 2.8%.
Full Year 2025 Results
Total revenues for the year ended December 31, 2025 remained stable at 267,633 kEUR compared to 266,765 kEUR for the year ended December 31, 2024. Adjusted EBITDA for 2025 improved to 32,386 kEUR compared to 31,484 kEUR for 2024. The Adjusted EBITDA margin improved to 12.1% in 2025, compared to 11.8% in 2024. Adjusted EBIT for 2025 increased to 10,601 kEUR compared to 9,741 kEUR for 2024. The Adjusted EBIT margin for 2025 increased to 4.0%, compared to 3.7% for 2024.
Revenues from our Materialise Medical segment grew by 15.4% for the year ended December 31, 2025 to 134,239 kEUR from 116,358 kEUR for the year ended December 31, 2024. The segment’s Adjusted EBITDA increased to 42,983 kEUR from 35,562 kEUR. The segment’s Adjusted EBITDA margin improved to 32.0% in 2025, compared to 30.6% in 2024.
Revenues from our Materialise Software segment decreased 6.8% to 40,907 kEUR for the year ended December 31, 2025 compared to 43,899 kEUR for the year ended December 31, 2024. The segment’s Adjusted EBITDA decreased to 5,469 kEUR from 5,562 kEUR in 2024. The segment’s Adjusted EBITDA margin improved to 13.4% in 2025, compared to 12.7% in 2024.
Revenues from our Materialise Manufacturing segment decreased 13.2% to 92,486 kEUR for the year ended December 31, 2025 from 106,508 kEUR for the year ended December 31, 2024. The segment’s Adjusted EBITDA amounted to (4,236) kEUR compared to 1,660 kEUR. The segment’s Adjusted EBITDA margin was (4.6)% in 2025, compared to 1.6% in 2024.
Consolidated gross profit increased 1.4% to 152,949 kEUR from 150,826 kEUR last year. Gross profit as a percentage of revenue increased to 57.1%, compared to 56.5% in 2024.
Research and development (“R&D”) expenses increased by 3.8% to 46,089 kEUR mainly reflecting higher investments in our Materialise Medical segment. Other operational expenses, including sales and marketing (“S&M”) and general and administrative (“G&A”) expenses, increased in aggregate over the full year 2025 by only 0.5% compared to 2024 to 101,714 kEUR.
Net other operating income was 3,789 kEUR compared to 4,223 kEUR for 2024.
Operating result amounted to 8,936 kEUR for the year ended December 31, 2025 compared to 9,432 kEUR in the prior year.
Net financial result amounted to (1,648) kEUR, compared to net financial result of 4,707 kEUR for the year ended December 31, 2024 reflecting the significantly higher impact of unfavorable exchange rate fluctuations in 2025.
Income taxes amounted to 429 kEUR compared to (733) kEUR for the year ended December 31, 2024.
As a result, net profit was 7,716 kEUR for 2025 compared to a net profit of 13,406 kEUR in 2024.
Cash flow from operating activities for the year ended December 31, 2025 was 25,319 kEUR compared to 31,456 kEUR for the year ended December 31, 2024. Total capital expenditures for the year ended December 31, 2025 amounted to 16,261 kEUR. The generated free cash flow over 2025 amounted to 15,615 kEUR.
2026 Guidance
Mrs. de Vet-Veithen concluded, “Also for fiscal year 2026, we expect our three reporting segments to evolve at a different pace. We anticipate continued strong revenue growth from our Materialise Medical segment. Our Materialise Software segment will complete the transition towards a cloud-based subscription business model, and will continue its investments in a broader AM software ecosystem covering end-to-end workflows. Our Materialise Manufacturing segment will intensify its ongoing shift towards series manufacturing and dedicated focus sectors, but we expect macroeconomic headwinds in the industrial market segments to persist throughout 2026.
On a consolidated level, we therefore expect our full year revenues for 2026 to grow to a range of 273,000 to 283,000 kEUR. We will continue investing in our Materialise Medical and Software segments while maintaining disciplined cost control and optimization, in particular in our Materialise Manufacturing segment and in our overhead. As a result, we expect our Adjusted EBIT to reach 10,000 to 12,000 kEUR for fiscal year 2026.”
Non-IFRS Measures
Materialise uses EBIT, EBITDA, Adjusted EBIT and Adjusted EBITDA as supplemental financial measures of its financial performance. EBIT is calculated as net profit plus income taxes, financial expenses (less financial income) and shares of profit or loss in a joint venture. EBITDA is calculated as net profit plus income taxes, financial expenses (less financial income), shares of profit or loss in a joint venture and depreciation and amortization. Adjusted EBIT and Adjusted EBITDA are determined by adding to EBIT and EBITDA, respectively (i) share-based compensation expenses, (ii) acquisition or divestiture-related expenses of business combinations, (iii) impairments and revaluation of fair value due to business combinations and (iv) costs incurred in relation to corporate initiatives, restructurings or reorganizations that are of a non-recurring nature. Management believes these non-IFRS measures to be important measures as they exclude the effects of items which primarily reflect the impact of financing decisions and, in the case of EBITDA and Adjusted EBITDA, long term investment, rather than the performance of the company’s day-to-day operations. The company also uses segment Adjusted EBITDA to evaluate the performance of its three business segments. As compared to net profit, these measures are limited in that they do not reflect the cash requirements necessary to service interest or principal payments on the company’s indebtedness and, in the case of EBITDA and Adjusted EBITDA, these measures are further limited in that they do not reflect the periodic costs of certain capitalized tangible and intangible assets used in generating revenues in the company’s business, or the changes associated with impairments. Management evaluates such items through other financial measures such as financial expenses, capital expenditures and cash flow provided by operating activities. The company believes that these measurements are useful to measure a company’s ability to grow or as a valuation measurement. The company’s calculation of EBIT, EBITDA, Adjusted EBIT and Adjusted EBITDA may not be comparable to similarly titled measures reported by other companies. EBIT, EBITDA, Adjusted EBIT and Adjusted EBITDA should not be considered as alternatives to net profit or any other performance measure derived in accordance with IFRS. The company’s presentation of EBIT, EBITDA, Adjusted EBIT and Adjusted EBITDA should not be construed to imply that its future results will be unaffected by unusual or non-recurring items.
Exchange Rate
This document contains translations of certain euro amounts into U.S. dollars at specified rates solely for the convenience of readers. Unless otherwise noted, all translations from euros to U.S. dollars in this document were made at a rate of EUR 1.00 to USD 1.1750, the reference rate of the European Central Bank on December 31, 2025.
Conference Call and Webcast
Materialise will hold a conference call and simultaneous webcast to discuss its financial results for the fourth quarter of 2025 on Thursday, February 19, 2026, at 8:30 a.m. ET/2:30 p.m. CET. Company participants on the call will include Brigitte de Vet-Veithen, Chief Executive Officer; and Koen Berges, Chief Financial Officer. A question-and-answer session will follow management’s remarks. To access the call by phone, please click the link below at least 15 minutes prior to the scheduled start time and you will be provided with dial-in details. Participants can choose to dial in or receive a call to connect to Materialise’s conference call.
Fourth Quarter 2025 Conference Call .
The conference call will also be broadcast live over the internet with an accompanying slide presentation, which can be accessed on the company’s website at http://investors.materialise.com. A webcast of the conference call will be archived on the company's website for one year.
About Materialise
Materialise NV incorporates more than three decades of 3D printing experience into a range of software solutions and 3D printing services that empower sustainable 3D printing applications. Our open, secure, and innovative end-to-end solutions enable flexible industrial manufacturing and mass personalization in various industries — including healthcare, automotive, aerospace, eyewear, art and design, wearables, and consumer goods. Headquartered in Belgium and with branches worldwide, Materialise NV combines the largest group of software developers in the industry with one of the world's largest and most complete 3D printing facilities. For additional information, please visit: www.materialise.com.
Cautionary Statement on Forward-Looking Statements
This press release contains forward-looking statements within the meaning of Section 27A of the Securities Act of 1933, as amended, and Section 21E of the Securities Exchange Act of 1934, as amended, regarding, among other things, our intentions, beliefs, assumptions, projections, outlook, analyses or current expectations, plans, objectives, strategies and prospects, both financial and business, including statements concerning, among other things, our estimates for the current fiscal year’s revenue and Adjusted EBIT, our results of operations, cash needs, capital expenditures, expenses, financial condition, liquidity, prospects, growth and strategies (including how our business, results of operations and financial condition could be impacted by the current armed geopolitical conflicts around the world and governmental responses thereto, inflation, increased labor, energy and materials costs), policy changes resulting from the U.S. presidential administration, changes in tariffs and trade restrictions, and the trends and competition that may affect the markets, industry or us. Such statements are subject to known and unknown uncertainties and risks. When used in this press release, the words “estimate,” “expect,” “anticipate,” “project,” “plan,” “intend,” “believe,” “forecast,” “will,” “may,” “could,” “might,” “aim,” “should,” and variations of such words or similar expressions are intended to identify forward-looking statements. These forward-looking statements are based upon the expectations of management under current assumptions at the time of this press release. These expectations, beliefs and projections are expressed in good faith and the company believes there is a reasonable basis for them. However, the company cannot offer any assurance that our expectations, beliefs and projections will actually be achieved. By their nature, forward-looking statements involve risks and uncertainties because they relate to events, competitive dynamics and industry change, and depend on economic circumstances that may or may not occur in the future or may occur on longer or shorter timelines than anticipated. We caution you that forward-looking statements are not guarantees of future performance and involve known and unknown risks, uncertainties and other factors that are in some cases beyond our control. All of the forward-looking statements are subject to risks and uncertainties that may cause the company's actual results to differ materially from our expectations, including risk factors described in the company's most recent annual report on Form 20-F filed with the U.S. Securities and Exchange Commission. There are a number of risks and uncertainties that could cause the company's actual results to differ materially from the forward-looking statements contained in this press release.
The company is providing this information as of the date of this press release and does not undertake any obligation to update any forward-looking statements contained in this press release as a result of new information, future events or otherwise, unless it has obligations under the federal securities laws to update and disclose material developments related to previously disclosed information.
Consolidated income statements (Unaudited)
for the three months ended
December 31,
for the twelve months
ended December 31,
2025
2025
2024
2025
2024
U.S.$
€
€
€
€
82,442
70,164
65,680
267,633
266,765
(34,513)
(29,373)
(29,315)
(114,684)
(115,940)
47,929
40,791
36,365
152,949
150,826
58.1%
58.1%
55.4%
57.1%
56.5%
(14,235)
(12,115)
(12,099)
(46,089)
(44,400)
(19,042)
(16,206)
(16,490)
(61,591)
(61,620)
(12,474)
(10,617)
(10,402)
(40,122)
(39,597)
1,478
1,258
1,357
3,789
4,223
3,656
3,111
(1,268)
8,936
9,432
2,088
1,777
1,113
(5,616)
(2,969)
732
623
2,188
3,968
7,677
6,476
5,510
2,033
7,287
14,139
817
695
874
429
(733)
7,293
6,206
2,907
7,716
13,406
7,292
6,206
2,917
7,718
13,436
-
-
(10)
(2)
(30)
0.12
0.11
0.05
0.13
0.23
0.12
0.11
0.05
0.13
0.23
59,067
59,067
59,067
59,067
59,067
59,077
59,077
59,148
59,072
59,105
Consolidated statements of comprehensive income (Unaudited)
for the three months ended
December 31,
for the twelve months
ended December 31,
2025
2025
2024
2025
2024
U.S.$
€
€
€
€
7,293
6,206
2,907
7,716
13,406
(2,848)
(2,424)
(1,478)
(1,257)
(1,795)
304
258
3
258
3
(2,544)
(2,165)
(1,475)
(999)
(1,792)
4,748
4,041
1,432
6,718
11,615
4,749
4,042
1,445
6,712
11,647
(2)
(1)
(13)
5
(34)
Consolidated statement of financial position (Unaudited)
As of
December 31,
As of
December 31,
2025
2024
43,161
43,391
25,639
29,973
112,854
111,331
5,429
7,719
3,971
3,523
-
3,994
5,983
5,893
197,038
205,823
14,904
16,992
54,938
53,052
15,533
18,166
133,918
102,304
4,314
-
223,607
190,513
420,646
396,336
As of
December 31,
As of
December 31,
2025
2024
4,487
4,487
203,895
233,895
47,180
10,196
255,562
248,578
(80)
(86)
255,482
248,492
49,726
23,175
3,063
5,112
2,660
3,202
17,344
13,268
486
910
73,280
45,666
7,759
10,383
2,565
2,614
20,125
23,348
748
1,432
43,523
45,998
16,362
18,403
802
-
91,884
102,178
420,646
396,336
Consolidated statement of cash flows (Unaudited)
for the twelve months
ended December 31,
2025
2024
7,716
13,406
23,179
18,655
15,274
15,372
6,431
6,435
-
(23)
266
285
(85)
(312)
(319)
(57)
(184)
539
723
236
(3,957)
(7,575)
5,612
3,012
(136)
29
(446)
714
(8,843)
(1,418)
(2,671)
(1,037)
(904)
(372)
(265)
1,270
(5,003)
(1,279)
(1,076)
(3,152)
4,343
3,965
25,319
31,456
for the twelve months ended
December 31,
2025
2024
(14,092)
(24,649)
(2,169)
(1,728)
389
458
-
(2,670)
2,500
-
3,669
-
(9,703)
(28,588)
35,000
-
(11,054)
(23,267)
(3,067)
(3,122)
-
-
(1,712)
(1,337)
(2,145)
81
0
-
17,023
(27,644)
32,638
(24,776)
102,304
127,573
(1,024)
(492)
133,918
102,304
Reconciliation of Net Profit (Loss) to EBITDA and Adjusted EBITDA (Unaudited)
for the three months ended
December 31,
for the twelve months
ended December 31,
2025
2024
2025
2024
6,206
2,907
7,716
13,406
(695)
(874)
(429)
733
(1,777)
(1,113)
5,616
2,969
(623)
(2,188)
(3,968)
(7,677)
5,544
5,501
21,785
21,742
8,655
4,234
30,721
31,175
74
72
266
285
795
-
1,400
-
-
-
-
24
9,524
4,306
32,386
31,484
Reconciliation of Net Profit (Loss) to EBIT and Adjusted EBIT (Unaudited)
for the three months ended
December 31,
for the twelve months
ended December 31,
2025
2024
2025
2024
6,206
2,907
7,716
13,406
(695)
(874)
(429)
733
(1,777)
(1,113)
5,616
2,969
(623)
(2,188)
(3,968)
(7,677)
3,111
(1,268)
8,936
9,432
74
72
266
285
795
-
1,400
-
-
-
-
24
3,980
(1,195)
10,601
9,741
Segment P&L (Unaudited)
37,016
10,974
22,174
70,164
(0)
70,164
13,024
1,701
(2,199)
12,526
(3,001)
9,524
35.2%
15.5%
-9.9%
17.9%
13.6%
31,837
11,124
22,719
65,680
0
65,680
9,547
1,123
(2,989)
7,681
(3,375)
4,306
30.0%
10.1%
-13.2%
11.7%
6.6%
134,239
40,907
92,486
267,633
(0)
267,633
42,983
5,469
(4,236)
44,217
(11,830)
32,386
32.0%
13.4%
-4.6%
16.5%
12.1%
116,358
43,899
106,508
266,765
0
266,765
35,562
5,562
1,660
42,784
(11,300)
31,484
30.6%
12.7%
1.6%
16.0%
11.8%
Reconciliation of Net Profit (Loss) to Segment adjusted EBITDA (Unaudited)
for the three months ended
December 31,
for the twelve months
ended December 31,
2025
2024
2025
2024
6,206
2,907
7,716
13,406
(695)
(874)
(429)
733
(1,777)
(1,113)
5,616
2,969
(623)
(2,188)
(3,968)
(7,677)
3,111
(1,268)
8,936
9,432
5,544
5,501
21,785
21,742
1,022
1,006
3,949
3,681
3,562
2,717
12,048
10,254
(713)
(276)
(2,901)
(2,350)
-
-
400
-
-
-
-
24
12,526
7,681
44,217
42,784
财报
2025-10-28
LEUVEN, Belgium--(BUSINESS WIRE)--Materialise NV (NASDAQ:MTLS), a global leader in 3D-printed medical devices and software and a pioneer in additive manufacturing software and services, today announced its financial results for the third quarter ended September 30, 2025.
Highlights – Third Quarter 2025
Total consolidated revenue increased 2.2% to 66,259 kEUR compared to the second quarter of 2025, but decreased 3.5% compared to the third quarter of 2024. Revenue from our Materialise Medical segment grew 10.3% compared to the corresponding 2024 period.
Gross profit as a percentage of revenue for the third quarter of 2025 was 56.8%, in line with the gross margin realized over the first nine months of 2025.
Adjusted EBIT amounted to 2,918 kEUR for the third quarter of 2025, representing 4.4% of consolidated revenue.
Net profit for the third quarter of 2025 was 1,848 kEUR, or 0.03 EUR per diluted share.
Driven by positive free cash flow during the first nine months of 2025, our reported net cash position increased by 6,724 kEUR to 67,744 kEUR compared to December 31, 2024.
CEO Brigitte de Vet-Veithen commented, “I am proud to report that we once more delivered a positive net result and strong cash flow in the third quarter of this year. Our Materialise Medical segment posted a quarterly revenue record, growing by more than 10% compared to the same period in 2024, while macro-economic headwinds continued to impact our consolidated revenue, and, in particular, our Materialise Manufacturing segment. We further implemented targeted cost control measures designed to protect our operational profitability without compromising on our continued R&D investments to drive future growth.”
Third Quarter 2025 Results
Total revenue for the third quarter of 2025 decreased 3.5% to 66,259 kEUR from 68,652 kEUR for the third quarter of 2024. Adjusted EBIT was 2,918 kEUR for the third quarter of 2025 compared to 4,408 kEUR for the 2024 period. The Adjusted EBIT margin (Adjusted EBIT divided by total revenue) for the third quarter of 2025 was 4.4%, compared to 6.4% for the third quarter of 2024. Adjusted EBITDA amounted to 8,428 kEUR for the third quarter of 2025 compared to 9,895 kEUR for the 2024 period.
Revenue from our Materialise Medical segment increased 10.3% to 33,296 kEUR for the third quarter of 2025 compared to 30,197 kEUR for the same period in 2024. Segment Adjusted EBITDA amounted to 10,199 kEUR for the third quarter of 2025 compared to 9,895 kEUR, while the segment Adjusted EBITDA margin was 30.6% compared to 32.8% for the third quarter of 2024.
Revenue from our Materialise Software segment decreased 7.4% to 10,286 kEUR for the third quarter of 2025 compared to 11,111 kEUR for the same quarter last year. Segment Adjusted EBITDA amounted to 1,801 kEUR compared to 1,975 kEUR, while the segment Adjusted EBITDA margin was 17.5% compared to 17.8% for the corresponding prior-year period.
Revenue from our Materialise Manufacturing segment decreased 17.1% to 22,677 kEUR for the third quarter of 2025 compared to 27,344 kEUR for the third quarter of 2024. Segment Adjusted EBITDA amounted to (845) kEUR compared to 701 kEUR for last year’s same period, while the segment Adjusted EBITDA margin was (3.7)% compared to 2.6% for the third quarter of 2024.
Gross profit was 37,651 kEUR for the third quarter of 2025 compared to 39,297 kEUR for the same period last year, while gross profit as a percentage of revenue was 56.8% compared to 57.2% for the third quarter of 2024.
While Research and development (“R&D”) expenses increased by 4.2% mainly reflecting higher investments in our Materialise Medical segment, overall operational expenses, also including sales and marketing (“S&M”) and general and administrative (“G&A”) expenses, increased in aggregate only slightly by 0.5% to 36,019 kEUR for the third quarter of 2025 compared to the third quarter of 2024.
Net other operating income amounted to 890 kEUR compared to 872 kEUR for the third quarter of 2024.
The operating result amounted to 2,522 kEUR compared to 4,313 kEUR for the third quarter of 2024.
Net financial result was (121) kEUR compared to (1,137) kEUR for the third quarter of 2024.
The third quarter of 2025 contained income tax results of (553) kEUR compared to (138) kEUR in the third quarter of 2024.
As a result of the above, net profit for the third quarter of 2025 was 1,848 kEUR compared to 3,038 kEUR for the same period in 2024. Total comprehensive income for the third quarter of 2025, which includes exchange differences on translation of foreign operations, was 1,885 kEUR compared to 3,777 kEUR for the corresponding 2024 period.
At September 30, 2025, we reported 132,022 kEUR cash and cash equivalents on our balance sheet compared to 102,304 kEUR at December 31, 2024. Gross debt amounted to 64,278 kEUR compared to 41,284 kEUR at December 31, 2024. As a result, our net cash position (cash and cash equivalents less gross debt) was 67,744 kEUR, an increase of 6,724 kEUR compared to December 31, 2024.
Cash flow from operating activities for the third quarter of the year 2025 was 10,359 kEUR, compared to 6,870 kEUR for the same period in 2024. Total capital expenditures for the third quarter of 2025 amounted to 5,288 kEUR.
Net shareholders’ equity at September 30, 2025 increased to 251,448 kEUR compared to 248,578 kEUR at December 31, 2024.
2025 Guidance
Mrs. de Vet-Veithen concluded, “As we approach the end of 2025, geo-political volatility and macro-economic uncertainty continue to impact the business environment in which we operate. We remain confident that our business is solid and resilient, and that Materialise is strongly positioned to capture growth opportunities once market conditions improve. For fiscal year 2025, we believe that our full-year revenues will land within the 265,000 to 280,000 kEUR range we communicated in July and we are maintaining our Adjusted EBIT guidance of 6,000 kEUR to 10,000 kEUR.”
Non-IFRS Measures
Materialise uses EBIT, EBITDA, Adjusted EBIT and Adjusted EBITDA as supplemental financial measures of its financial performance. EBIT is calculated as net profit plus income taxes, financial expenses (less financial income) and shares of profit or loss in a joint venture. EBITDA is calculated as net profit plus income taxes, financial expenses (less financial income), shares of profit or loss in a joint venture and depreciation and amortization. Adjusted EBIT and Adjusted EBITDA are determined by adding to EBIT and EBITDA, respectively (i) share-based compensation expenses, (ii) acquisition or divestiture-related expenses of business combinations, (iii) impairments and revaluation of fair value due to business combinations and (iv) costs incurred in relation to corporate initiatives, restructurings or reorganizations that are of a non-recurring nature. Management believes these non-IFRS measures to be important measures as they exclude the effects of items which primarily reflect the impact of financing decisions and, in the case of EBITDA and Adjusted EBITDA, long term investment, rather than the performance of the company’s day-to-day operations. The company also uses segment Adjusted EBITDA to evaluate the performance of its three business segments. As compared to net profit, these measures are limited in that they do not reflect the cash requirements necessary to service interest or principal payments on the company’s indebtedness and, in the case of EBITDA and Adjusted EBITDA, these measures are further limited in that they do not reflect the periodic costs of certain capitalized tangible and intangible assets used in generating revenues in the company’s business, or the changes associated with impairments. Management evaluates such items through other financial measures such as financial expenses, capital expenditures and cash flow provided by operating activities. The company believes that these measurements are useful to measure a company’s ability to grow or as a valuation measurement. The company’s calculation of EBIT, EBITDA, Adjusted EBIT and Adjusted EBITDA may not be comparable to similarly titled measures reported by other companies. EBIT, EBITDA, Adjusted EBIT and Adjusted EBITDA should not be considered as alternatives to net profit or any other performance measure derived in accordance with IFRS. The company’s presentation of EBIT, EBITDA, Adjusted EBIT and Adjusted EBITDA should not be construed to imply that its future results will be unaffected by unusual or non-recurring items.
Exchange Rate
This document contains translations of certain euro amounts into U.S. dollars at specified rates solely for the convenience of readers. Unless otherwise noted, all translations from euros to U.S. dollars in this document were made at a rate of EUR 1.00 to USD 1.1741, the reference rate of the European Central Bank on September 30, 2025.
Conference Call and Webcast
Materialise will hold a conference call and simultaneous webcast to discuss its financial results for the third quarter of 2025 on Tuesday, October 28, 2025, at 8:30 a.m. ET/1:30 p.m. CET. Company participants on the call will include Brigitte de Vet-Veithen, Chief Executive Officer and Koen Berges, Chief Financial Officer. A question-and-answer session will follow management’s remarks.
To access the call by phone, please click the link below at least 15 minutes prior to the scheduled start time and you will be provided with dial-in details. Participants can choose to dial in or receive a call to connect to Materialise’s conference call.
The conference call will also be broadcast live over the Internet with an accompanying slide presentation, which can be accessed on the company’s website at http://investors.materialise.com. The webcast of the conference call will be archived on the company's website for one year.
About Materialise
Materialise NV incorporates more than three decades of 3D printing experience into a range of software solutions and 3D printing services that empower sustainable 3D printing applications. Our open, secure, and innovative end-to-end solutions enable flexible industrial manufacturing and mass personalization in various industries — including healthcare, automotive, aerospace, eyewear, art and design, wearables, and consumer goods. Headquartered in Belgium and with branches worldwide, Materialise NV combines the largest group of software developers in the industry with one of the world's largest and most complete 3D printing facilities. For additional information, please visit: www.materialise.com.
Cautionary Statement on Forward-Looking Statements
This press release contains forward-looking statements within the meaning of Section 27A of the Securities Act of 1933, as amended, and Section 21E of the Securities Exchange Act of 1934, as amended, regarding, among other things, our intentions, beliefs, assumptions, projections, outlook, analyses or current expectations, plans, objectives, strategies and prospects, both financial and business, including statements concerning, among other things, our estimates for the current fiscal year’s revenue and Adjusted EBIT, our results of operations, cash needs, capital expenditures, expenses, financial condition, liquidity, prospects, growth and strategies (including how our business, results of operations and financial condition could be impacted by the current armed geopolitical conflicts around the world and governmental responses thereto, inflation, increased labor, energy and materials costs), policy changes resulting from the U.S. presidential administration, changes in tariffs and trade restrictions, and the trends and competition that may affect the markets, industry or us. Such statements are subject to known and unknown uncertainties and risks. When used in this press release, the words “estimate,” “expect,” “anticipate,” “project,” “plan,” “intend,” “believe,” “forecast,” “will,” “may,” “could,” “might,” “aim,” “should,” and variations of such words or similar expressions are intended to identify forward-looking statements. These forward-looking statements are based upon the expectations of management under current assumptions at the time of this press release. These expectations, beliefs and projections are expressed in good faith and the company believes there is a reasonable basis for them. However, the company cannot offer any assurance that our expectations, beliefs and projections will actually be achieved. By their nature, forward-looking statements involve risks and uncertainties because they relate to events, competitive dynamics and industry change, and depend on economic circumstances that may or may not occur in the future or may occur on longer or shorter timelines than anticipated. We caution you that forward-looking statements are not guarantees of future performance and involve known and unknown risks, uncertainties and other factors that are in some cases beyond our control. All of the forward-looking statements are subject to risks and uncertainties that may cause the company's actual results to differ materially from our expectations, including risk factors described in the company's most recent annual report on Form 20-F filed with the U.S. Securities and Exchange Commission. There are a number of risks and uncertainties that could cause the company's actual results to differ materially from the forward-looking statements contained in this press release.
The company is providing this information as of the date of this press release and does not undertake any obligation to update any forward-looking statements contained in this press release as a result of new information, future events or otherwise, unless it has obligations under the federal securities laws to update and disclose material developments related to previously disclosed information.
for the three months ended
September 30,
for the nine months ended
September 30,
2025
2025
2024
2025
2024
77,795
66,259
68,652
197,469
201,085
(33,589)
(28,608)
(29,355)
(85,298)
(86,625)
44,206
37,651
39,297
112,171
114,461
56.8%
56.8%
57.2%
56.8%
56.9%
(13,431)
(11,439)
(10,979)
(33,973)
(32,301)
(17,432)
(14,847)
(14,896)
(45,386)
(45,130)
(11,427)
(9,733)
(9,981)
(29,506)
(29,195)
1,045
890
872
2,519
2,866
2,961
2,522
4,313
5,825
10,700
(683)
(582)
(1,843)
(7,393)
(4,082)
541
460
706
3,345
5,489
2,819
2,401
3,176
1,777
12,106
(649)
(553)
(138)
(266)
(1,607)
2,170
1,848
3,038
1,510
10,500
2,169
1,848
3,045
1,512
10,520
-
-
(7)
(2)
(20)
0.04
0.03
0.05
0.03
0.18
0.04
0.03
0.05
0.03
0.18
59,067
59,067
59,067
59,067
59,067
59,067
59,067
59,067
59,071
59,067
for the three months ended
September 30,
for the nine months ended
September 30,
2025
2025
2024
2025
2024
U.S.$
€
€
€
€
2,170
1,848
3,038
1,510
10,500
44
38
739
1,167
(317)
44
38
739
1,167
(317)
2,213
1,885
3,777
2,677
10,183
2,214
1,886
3,785
2,670
10,204
(0)
(0)
(7)
7
(22)
As of
September 30,
As of
December 31,
2025
2024
43,148
43,391
26,651
29,973
111,831
111,331
6,073
7,719
3,423
3,523
4,179
3,994
5,663
5,893
200,968
205,823
15,678
16,992
44,894
53,052
17,569
18,166
132,022
102,304
4,383
-
214,545
190,513
415,513
396,336
As of
September 30,
As of
December 31,
2025
2024
4,487
4,487
233,895
233,895
13,066
10,196
251,448
248,578
(79)
(86)
251,369
248,492
50,029
23,175
3,522
5,112
2,826
3,202
16,749
13,268
421
910
73,547
45,666
7,909
10,383
2,818
2,614
18,858
23,348
388
1,432
41,592
45,998
18,195
18,403
838
-
90,598
102,178
415,513
396,336
for the nine months ended
September 30,
2025
2024
1,510
10,500
20,198
16,964
11,317
11,370
4,834
4,838
191
213
(24)
(114)
(209)
-
(273)
311
194
202
(3,339)
(5,492)
7,385
4,066
(137)
(15)
260
1,584
(2,282)
(3,860)
6,197
1,666
(1,604)
(672)
(2,661)
(4,284)
(4,214)
(569)
(1,358)
(1,626)
1,977
3,262
20,045
25,239
for the nine months ended
September 30,
2025
2024
(10,372)
(17,305)
(1,477)
(1,312)
231
232
-
(2,670)
2,678
-
(8,940)
(21,055)
35,000
-
(10,461)
(11,470)
(2,257)
(2,314)
-
-
(1,209)
(1,052)
(1,515)
(240)
19,558
(15,077)
30,663
(10,892)
102,304
127,573
(915)
(517)
132,052
116,163
2025
2024
2025
2024
1,848
3,038
1,510
10,500
553
138
266
1,607
582
1,843
7,393
4,082
(460)
(706)
(3,345)
(5,489)
5,509
5,487
16,240
16,241
8,031
9,800
22,065
26,941
74
71
191
213
322
-
605
-
-
24
-
24
8,428
9,895
22,862
27,178
2025
2024
2025
2024
1,848
3,038
1,510
10,500
553
138
266
1,607
582
1,843
7,393
4,082
(460)
(706)
(3,345)
(5,489)
2,522
4,313
5,825
10,700
74
71
191
213
322
-
605
-
-
24
-
24
2,918
4,408
6,621
10,937
33,296
10,286
22,677
66,259
0
66,259
10,199
1,801
(845)
11,155
(2,728)
8,428
30.6%
17.5%
-3.7%
16.8%
12.7%
30,197
11,111
27,344
68,652
(0)
68,652
9,895
1,975
701
12,572
(2,677)
9,895
32.8%
17.8%
2.6%
18.3%
14.4%
97,224
29,933
70,313
197,469
0
197,469
29,974
3,772
(2,031)
31,716
(8,854)
22,862
30.8%
12.6%
-2.9%
16.1%
11.6%
84,522
32,775
83,789
201,085
0
201,085
26,015
4,439
4,648
35,103
(7,925)
27,178
30.8%
13.5%
5.5%
17.5%
13.5%
Reconciliation of Net Profit (Loss) to Segment adjusted EBITDA (Unaudited)
for the three months ended
September 30,
for the nine months ended
September 30,
2025
2024
2025
2024
1,848
3,038
1,510
10,500
553
138
266
1,607
582
1,843
7,393
4,082
(460)
(706)
(3,345)
(5,489)
2,522
4,313
5,825
10,700
5,509
5,487
16,240
16,241
826
912
2,926
2,675
2,761
2,454
8,512
7,537
(685)
(618)
(2,187)
(2,073)
222
-
400
-
-
24
-
24
11,155
12,572
31,716
35,103
财报
2025-08-20
POTLAND, AK, UNITED STATES, August 20, 2025 /
EINPresswire.com
/ -- According to the report published by Allied Market Research, the global
3D Printing in Healthcare Market
generated $1.03 billion in 2020, and is estimated to reach $5.84 billion by 2030, witnessing a CAGR of 20.1% from 2021 to 2030. The report provides an extensive analysis of changing market dynamics, top segments, top investment pockets, regional landscape, value chain, and competitive scenario.
Get Sample Report at:
https://www.alliedmarketresearch.com/request-sample/834
Technological advancements in 3D printing, customization & personalization, surge in R&D investments, and rise in biomedical applications drive the growth of the global 3D printing in healthcare market. However, high cost, increase in reimbursement challenges, and lack of skilled workforce hinder the market growth. On the other hand, increase in pharmaceutical applications and presence of bioprinting tissues & organs present new opportunities in the coming years.
Key Market Trends and Applications:
Personalized Medicine:
3D printing allows for the creation of patient-specific medical devices, prosthetics, and implants, leading to better patient outcomes and reduced risks associated with traditional methods.
Bioprinting:
The bioprinting segment, which involves creating living tissues and organs using 3D printing technology, is a rapidly growing area with the potential to revolutionize organ transplantation and regenerative medicine.
Surgical Planning and Training:
3D printed anatomical models are increasingly used for surgical planning, allowing surgeons to visualize complex cases and practice procedures before surgery, leading to improved precision and reduced operating time.
3D Printing in Healthcare Market Segmentation:
The report offers detailed segmentation of the global 3D printing in healthcare market based on component, technology, application, end user, and region.
Based on component, the system segment contributed to the highest share in 2020, holding more than half of the total share, and is expected to maintain its lead position during the forecast period. However, the materials segment is estimated to manifest the highest CAGR of 21.2% from 2021 to 2030.
Ask to Our Industry Expert:
https://www.alliedmarketresearch.com/purchase-enquiry/834
Based on end user, the medical & surgical centers segment held the highest share in 2020, accounting for nearly two-thirds of the global 3D printing in healthcare market, and is estimated to continue its lead in terms of revenue throughout the forecast period. However, the academic institutions segment is expected to witness the largest CAGR of 21.7% from 2021 to 2030.
Based on region, North America accounted for the highest share in 2020, contributing to more than two-fifths of the total share, and is projected to continue its dominance by 2030. However, Asia-Pacific is projected to portray the fastest CAGR of 21.7% during the forecast period.
Major Market Players:
Leading players of the global 3D printing in healthcare market analyzed in the research include 3D Systems Corporation, Formlabs Inc., Exone Company, Materialise NV, General Electric, Organovo Holdings, Inc., Oxferd Performance Materials, Inc., SLM Solutions Group AG, Proto Labs, and Stratasys Ltd.
Read More:
Hematology Analyzers market –
https://www.newstrail.com/hematology-analyzer-market/
Micromanipulators Market –
https://www.newstrail.com/micromanipulators-market/
Contact Details:
David Correa
USA/Canada (Toll Free): +1-800-792-5285, +1-503-894-6022
help@alliedmarketresearch.com
About Us
Allied Market Research (AMR) is a full-service market research and business-consulting wing of Allied Analytics LLP based in Portland, Oregon. Allied Market Research provides global enterprises as well as medium and small businesses with unmatched quality of “Market Research Reports” and “Business Intelligence Solutions.” AMR has a targeted view to provide business insights and consulting to assist its clients to make strategic business decisions and achieve sustainable growth in their respective market domain.
David Correa
Allied Market Research
+1 800-792-5285
email us here
Visit us on social media:
LinkedIn
Facebook
YouTube
X
Legal Disclaimer:
EIN Presswire provides this news content "as is" without warranty of any kind. We do not accept any responsibility or liability
for the accuracy, content, images, videos, licenses, completeness, legality, or reliability of the information contained in this
article. If you have any complaints or copyright issues related to this article, kindly contact the author above.
100 项与 Materialise NV 相关的药物交易
登录后查看更多信息
100 项与 Materialise NV 相关的转化医学
登录后查看更多信息
组织架构
使用我们的机构树数据加速您的研究。
登录
或
管线布局
2026年05月22日管线快照
无数据报导
登录后保持更新
药物交易
使用我们的药物交易数据加速您的研究。
登录
或
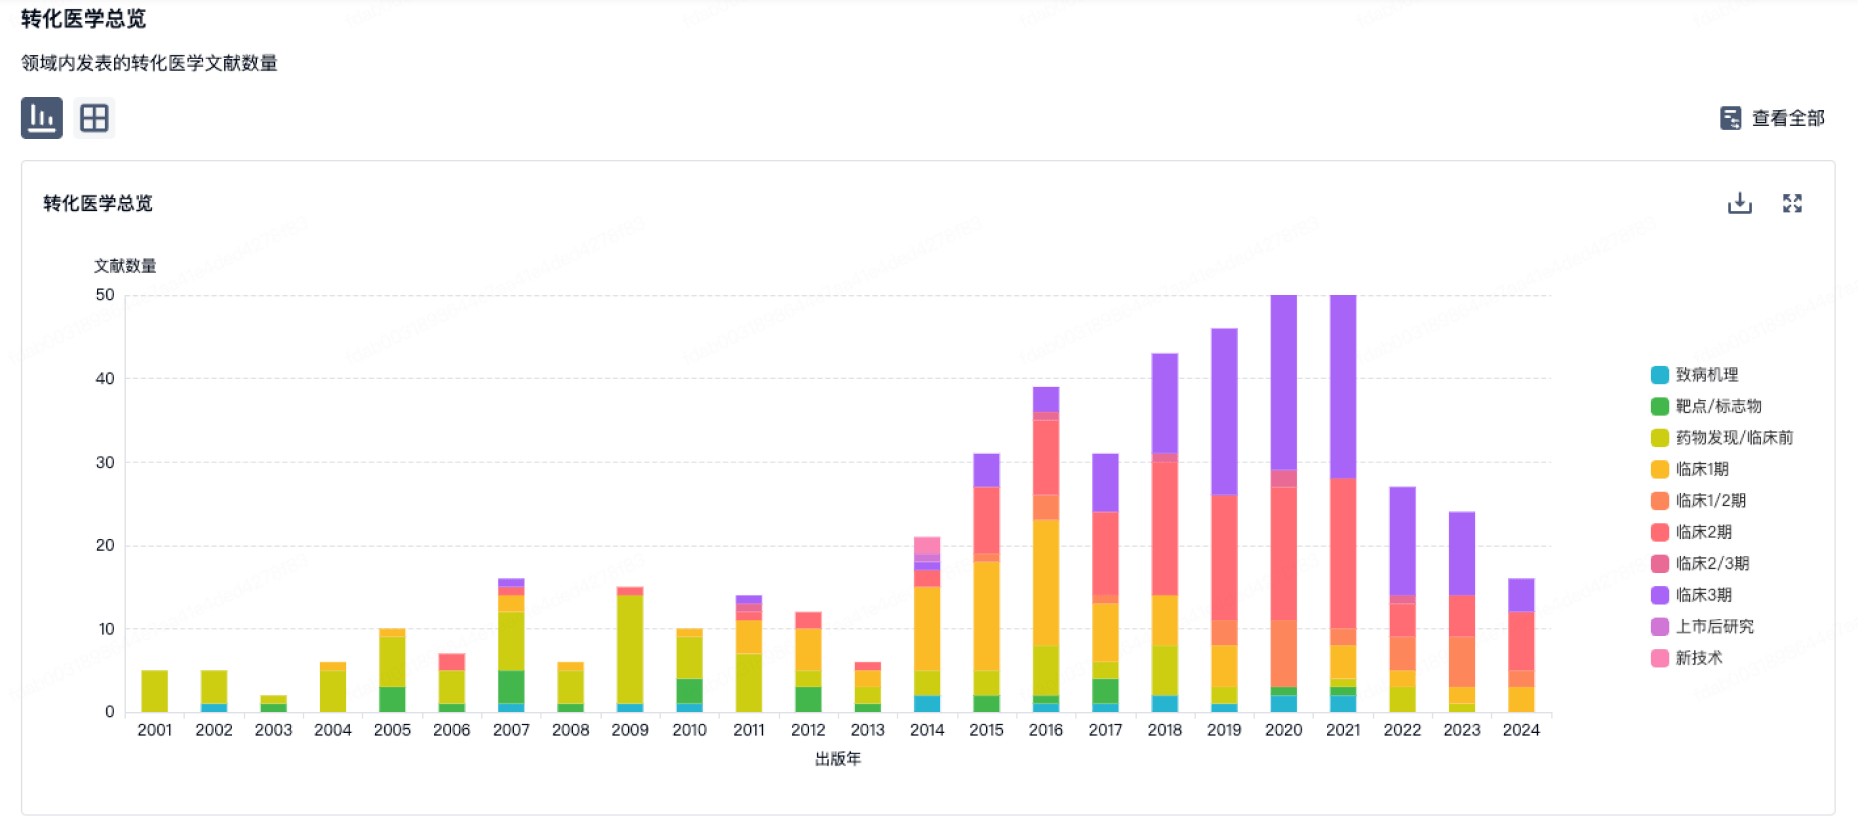
转化医学
使用我们的转化医学数据加速您的研究。
登录
或
营收
使用 Synapse 探索超过 36 万个组织的财务状况。
登录
或
科研基金(NIH)
访问超过 200 万项资助和基金信息,以提升您的研究之旅。
登录
或
投资
深入了解从初创企业到成熟企业的最新公司投资动态。
登录
或
融资
发掘融资趋势以验证和推进您的投资机会。
登录
或
生物医药百科问答
全新生物医药AI Agent 覆盖科研全链路,让突破性发现快人一步
立即开始免费试用!
智慧芽新药情报库是智慧芽专为生命科学人士构建的基于AI的创新药情报平台,助您全方位提升您的研发与决策效率。
立即开始数据试用!
智慧芽新药库数据也通过智慧芽数据服务平台,以API或者数据包形式对外开放,助您更加充分利用智慧芽新药情报信息。
生物序列数据库
生物药研发创新
免费使用
化学结构数据库
小分子化药研发创新
免费使用