预约演示
Gas separation membrane market to grow by 6.07% Y-O-Y from 2022 to 2023: Rising demand for biogas will drive growth - Technavio
2022-12-19
NEW YORK, Dec. 19, 2022 /PRNewswire/ --
Gas separation membrane market insights -
Continue Reading
Preview
来源: PRNewswire
Technavio has announced its latest market research report titled Global Gas Separation Membrane Market 2023-2027
Vendors: 15+, Including Air Liquide SA, Air Products and Chemicals Inc., Airlane Co. Ltd., Asahi Kasei Corp., DIC Corp., Evonik Industries AG, FUJIFILM Corp., GENERON, KNM Group Berhad, Membrane Technology and Research Inc., Novamem AG, Parker Hannifin Corp., PermSelect Inc., Schlumberger Ltd., SRI International, Ube Corp., Xebec Adsorption Inc., Grasys JSC, Imtex Membranes Corp., Honeywell International Inc, among others
Coverage: Parent market analysis; key drivers, major trends, and challenges; customer and vendor landscape; vendor product insights and recent developments; key vendors; and market positioning of vendors
Segments: Product (polyimide and polyamide, polysulfone, cellulose acetate, and others), end-user (water and waste treatment, food and beverage, pharmaceutical, and others), and geography (North America, Europe, APAC, Middle East and Africa, and South America)
To understand more about the gas separation membrane market, request a sample report
The gas separation membrane market report provides critical information and factual data, with a qualitative and quantitative study of the market based on market drivers and limitations as well as future prospects.
Why buy?
Add credibility to strategy
Analyzes competitor's offerings
Get a holistic view of the market
Grow your profit margin with Technavio - Buy the report
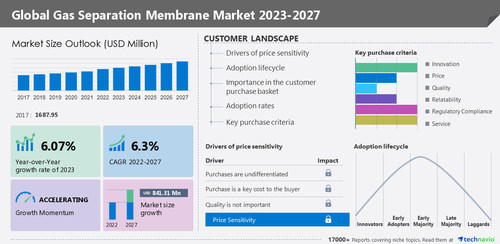
In 2017, the gas separation membrane market was valued at
USD 1,687.95 million. From a regional perspective, North America held the largest market share, valued at
USD 535.08 million. The
gas separation membrane market size is estimated to grow by USD 841.31 million from 2022 to 2027 at a CAGR of 6.3%, according to Technavio.
Gas separation membrane market - Customer Landscape
To help companies evaluate and develop growth strategies, the report outlines –
Key purchase criteria
Adoption rates
Adoption lifecycle
Drivers of price sensitivity
For highlights on customer landscape analysis, download a sample!
Global gas separation membrane market - Vendor insights
The growing competition in the market is compelling vendors to adopt various growth strategies such as focusing on geographical expansion through M&A or joint ventures. Technavio report analyzes the market's competitive landscape and offers information on several market vendors, including -
Air Liquide SA - The company offers wind turbine components such as hollow fiber membranes.
Air Products and Chemicals Inc. - The company offers gas separation membranes such as PRISM membrane separators.
Asahi Kasei Corp. - The company offers gas separation membranes such as Microza UF MF.
Global gas separation membrane market –
Market dynamics
Major drivers
Rising demand for biogas
Increasing need for CO2 removal
Increasing use of gas separation membranes in APAC
Key challenges
High price of equipment
Increasing production costs
Shift of end-user industries from developed countries to emerging countries
Drivers and challenges have an impact on market dynamics, which can impact businesses. Find some insights from a sample report!
What are the key data covered in this gas separation membrane market report?
CAGR of the market during the forecast period
Detailed information on factors that will drive the growth of the gas separation membrane market between 2023 and 2027
Precise estimation of the size of the gas separation membrane market and its contribution to the parent market
Accurate predictions about upcoming trends and changes in consumer behavior
Growth of the gas separation membrane market across North America, Europe, APAC, Middle East and Africa, and South America
A thorough analysis of the market's competitive landscape and detailed information about vendors
Comprehensive analysis of factors that will challenge the growth of gas separation membrane market vendors
Gain instant access to 17,000+ market research reports.
Technavio's SUBSCRIPTION platform
Related Reports
The
medical gas blenders market size is expected to increase by USD 528.37 million from 2021 to 2026, and the market's growth momentum will accelerate at a CAGR of 5.44%. This report extensively covers market segmentation by product (dual flow and tube flow) and geography (North America, Europe, Asia, and Rest of World (ROW)).
The
POC blood gas and electrolyte market size is expected to increase by USD 443.92 million from 2021 to 2026, and the market's growth momentum will accelerate at a CAGR of 8%. The rising geriatric population is notably driving the POC blood gas and electrolyte market growth, although factors such as stringent government regulations may impede the market growth.
Browse for Technavio's health care market reports
Table of contents
1 Executive Summary
1.1 Market overview
Exhibit 01: Executive Summary – Chart on Market Overview
Exhibit 02: Executive Summary – Data Table on Market Overview
Exhibit 03: Executive Summary – Chart on Global Market Characteristics
Exhibit 04: Executive Summary – Chart on Market by Geography
Exhibit 05: Executive Summary – Chart on Market Segmentation by Product
Exhibit 06: Executive Summary – Chart on Market Segmentation by End-user
Exhibit 07: Executive Summary – Chart on Incremental Growth
Exhibit 08: Executive Summary – Data Table on Incremental Growth
Exhibit 09: Executive Summary – Chart on Vendor Market Positioning
2 Market Landscape
2.1 Market ecosystem
Exhibit 10: Parent market
Exhibit 11: Market Characteristics
3 Market Sizing
3.1 Market definition
Exhibit 12: Offerings of vendors included in the market definition
3.2 Market segment analysis
Exhibit 13: Market segments
3.3 Market size 2022
3.4 Market outlook: Forecast for 2022-2027
Exhibit 14: Chart on Global - Market size and forecast 2022-2027 ($ million)
Exhibit 15: Data Table on Global - Market size and forecast 2022-2027 ($ million)
Exhibit 16: Chart on Global Market: Year-over-year growth 2022-2027 (%)
Exhibit 17: Data Table on Global Market: Year-over-year growth 2022-2027 (%)
4 Historic Market Size
4.1 Global gas separation membrane market 2017 - 2021
Exhibit 18: Historic Market Size – Data Table on Global gas separation membrane market 2017 - 2021 ($ million)
4.2 Product Segment Analysis 2017 - 2021
Exhibit 19: Historic Market Size – Product Segment 2017 - 2021 ($ million)
4.3 End-user Segment Analysis 2017 - 2021
Exhibit 20: Historic Market Size – End-user Segment 2017 - 2021 ($ million)
4.4 Geography Segment Analysis 2017 - 2021
Exhibit 21: Historic Market Size – Geography Segment 2017 - 2021 ($ million)
4.5 Country Segment Analysis 2017 - 2021
Exhibit 22: Historic Market Size – Country Segment 2017 - 2021 ($ million)
5 Five Forces Analysis
5.1 Five forces summary
Exhibit 23: Five forces analysis - Comparison between 2022 and 2027
5.2 Bargaining power of buyers
Exhibit 24: Chart on Bargaining power of buyers – Impact of key factors 2022 and 2027
5.3 Bargaining power of suppliers
Exhibit 25: Bargaining power of suppliers – Impact of key factors in 2022 and 2027
5.4 Threat of new entrants
Exhibit 26: Threat of new entrants – Impact of key factors in 2022 and 2027 49
5.5 Threat of substitutes
Exhibit 27: Threat of substitutes – Impact of key factors in 2022 and 2027
5.6 Threat of rivalry
Exhibit 28: Threat of rivalry – Impact of key factors in 2022 and 2027
5.7 Market condition
Exhibit 29: Chart on Market condition - Five forces 2022 and 2027
6 Market Segmentation by Product
6.1 Market segments
Exhibit 30: Chart on Product - Market share 2022-2027 (%)
Exhibit 31: Data Table on Product - Market share 2022-2027 (%)
6.2 Comparison by Product
Exhibit 32: Chart on Comparison by Product
Exhibit 33: Data Table on Comparison by Product
6.3 Polyimide and polyamide - Market size and forecast 2022-2027
Exhibit 34: Chart on Polyimide and polyamide - Market size and forecast 2022-2027 ($ million)
Exhibit 35: Data Table on Polyimide and polyamide - Market size and forecast 2022-2027 ($ million)
Exhibit 36: Chart on Polyimide and polyamide - Year-over-year growth 2022-2027 (%)
Exhibit 37: Data Table on Polyimide and polyamide - Year-over-year growth 2022-2027 (%)
6.4 Polysulfone - Market size and forecast 2022-2027
Exhibit 38: Chart on Polysulfone - Market size and forecast 2022-2027 ($ million)
Exhibit 39: Data Table on Polysulfone - Market size and forecast 2022-2027 ($ million)
Exhibit 40: Chart on Polysulfone - Year-over-year growth 2022-2027 (%)
Exhibit 41: Data Table on Polysulfone - Year-over-year growth 2022-2027 (%)
6.5 Cellulose acetate - Market size and forecast 2022-2027
Exhibit 42: Chart on Cellulose acetate - Market size and forecast 2022-2027 ($ million)
Exhibit 43: Data Table on Cellulose acetate - Market size and forecast 2022-2027 ($ million)
Exhibit 44: Chart on Cellulose acetate - Year-over-year growth 2022-2027 (%)
Exhibit 45: Data Table on Cellulose acetate - Year-over-year growth 2022-2027 (%)
6.6 Others - Market size and forecast 2022-2027
Exhibit 46: Chart on Others - Market size and forecast 2022-2027 ($ million)
Exhibit 47: Data Table on Others - Market size and forecast 2022-2027 ($ million)
Exhibit 48: Chart on Others - Year-over-year growth 2022-2027 (%)
Exhibit 49: Data Table on Others - Year-over-year growth 2022-2027 (%)
6.7 Market opportunity by Product
Exhibit 50: Market opportunity by Product ($ million)
7 Market Segmentation by End-user
7.1 Market segments
Exhibit 51: Chart on End-user - Market share 2022-2027 (%)
Exhibit 52: Data Table on End-user - Market share 2022-2027 (%)
7.2 Comparison by End-user
Exhibit 53: Chart on Comparison by End-user
Exhibit 54: Data Table on Comparison by End-user
7.3 Water and waste treatment - Market size and forecast 2022-2027
Exhibit 55: Chart on Water and waste treatment - Market size and forecast 2022-2027 ($ million)
Exhibit 56: Data Table on Water and waste treatment - Market size and forecast 2022-2027 ($ million)
Exhibit 57: Chart on Water and waste treatment - Year-over-year growth 2022-2027 (%)
Exhibit 58: Data Table on Water and waste treatment - Year-over-year growth 2022-2027 (%)
7.4 Food and beverage - Market size and forecast 2022-2027
Exhibit 59: Chart on Food and beverage - Market size and forecast 2022-2027 ($ million)
Exhibit 60: Data Table on Food and beverage - Market size and forecast 2022-2027 ($ million)
Exhibit 61: Chart on Food and beverage - Year-over-year growth 2022-2027 (%)
Exhibit 62: Data Table on Food and beverage - Year-over-year growth 2022-2027 (%)
7.5 Pharmaceutical - Market size and forecast 2022-2027
Exhibit 63: Chart on Pharmaceutical - Market size and forecast 2022-2027 ($ million)
Exhibit 64: Data Table on Pharmaceutical - Market size and forecast 2022-2027 ($ million)
Exhibit 65: Chart on Pharmaceutical - Year-over-year growth 2022-2027 (%)
Exhibit 66: Data Table on Pharmaceutical - Year-over-year growth 2022-2027 (%)
7.6 Others - Market size and forecast 2022-2027
Exhibit 67: Chart on Others - Market size and forecast 2022-2027 ($ million)
Exhibit 68: Data Table on Others - Market size and forecast 2022-2027 ($ million)
Exhibit 69: Chart on Others - Year-over-year growth 2022-2027 (%)
Exhibit 70: Data Table on Others - Year-over-year growth 2022-2027 (%)
7.7 Market opportunity by End-user
Exhibit 71: Market opportunity by End-user ($ million)
8 Customer Landscape
8.1 Customer landscape overview
Exhibit 72: Analysis of price sensitivity, lifecycle, customer purchase basket, adoption rates, and purchase criteria
9 Geographic Landscape
9.1 Geographic segmentation
Exhibit 73: Chart on Market share by geography 2022-2027 (%)
Exhibit 74: Data Table on Market share by geography 2022-2027 (%)
9.2 Geographic comparison
Exhibit 75: Chart on Geographic comparison
Exhibit 76: Data Table on Geographic comparison
9.3 North America - Market size and forecast 2022-2027
Exhibit 77: Chart on North America - Market size and forecast 2022-2027 ($ million)
Exhibit 78: Data Table on North America - Market size and forecast 2022-2027 ($ million)
Exhibit 79: Chart on North America - Year-over-year growth 2022-2027 (%)
Exhibit 80: Data Table on North America - Year-over-year growth 2022-2027 (%)
9.4 Europe - Market size and forecast 2022-2027
Exhibit 81: Chart on Europe - Market size and forecast 2022-2027 ($ million)
Exhibit 82: Data Table on Europe - Market size and forecast 2022-2027 ($ million)
Exhibit 83: Chart on Europe - Year-over-year growth 2022-2027 (%)
Exhibit 84: Data Table on Europe - Year-over-year growth 2022-2027 (%)
9.5 APAC - Market size and forecast 2022-2027
Exhibit 85: Chart on APAC - Market size and forecast 2022-2027 ($ million)
Exhibit 86: Data Table on APAC - Market size and forecast 2022-2027 ($ million)
Exhibit 87: Chart on APAC - Year-over-year growth 2022-2027 (%)
Exhibit 88: Data Table on APAC - Year-over-year growth 2022-2027 (%)
9.6 Middle East and Africa - Market size and forecast 2022-2027
Exhibit 89: Chart on Middle East and Africa - Market size and forecast 2022-2027 ($ million)
Exhibit 90: Data Table on Middle East and Africa - Market size and forecast 2022-2027 ($ million)
Exhibit 91: Chart on Middle East and Africa - Year-over-year growth 2022-2027 (%)
Exhibit 92: Data Table on Middle East and Africa - Year-over-year growth 2022-2027 (%)
9.7 South America - Market size and forecast 2022-2027
Exhibit 93: Chart on South America - Market size and forecast 2022-2027 ($ million)
Exhibit 94: Data Table on South America - Market size and forecast 2022-2027 ($ million)
Exhibit 95: Chart on South America - Year-over-year growth 2022-2027 (%)
Exhibit 96: Data Table on South America - Year-over-year growth 2022-2027 (%)
9.8 US - Market size and forecast 2022-2027
Exhibit 97: Chart on US - Market size and forecast 2022-2027 ($ million)
Exhibit 98: Data Table on US - Market size and forecast 2022-2027 ($ million)
Exhibit 99: Chart on US - Year-over-year growth 2022-2027 (%)
Exhibit 100: Data Table on US - Year-over-year growth 2022-2027 (%)
9.9 Germany - Market size and forecast 2022-2027
Exhibit 101: Chart on Germany - Market size and forecast 2022-2027 ($ million)
Exhibit 102: Data Table on Germany - Market size and forecast 2022-2027 ($ million)
Exhibit 103: Chart on Germany - Year-over-year growth 2022-2027 (%)
Exhibit 104: Data Table on Germany - Year-over-year growth 2022-2027 (%)
9.10 UK - Market size and forecast 2022-2027
Exhibit 105: Chart on UK - Market size and forecast 2022-2027 ($ million)
Exhibit 106: Data Table on UK - Market size and forecast 2022-2027 ($ million)
Exhibit 107: Chart on UK - Year-over-year growth 2022-2027 (%)
Exhibit 108: Data Table on UK - Year-over-year growth 2022-2027 (%)
9.11 China - Market size and forecast 2022-2027
Exhibit 109: Chart on China - Market size and forecast 2022-2027 ($ million)
Exhibit 110: Data Table on China - Market size and forecast 2022-2027 ($ million)
Exhibit 111: Chart on China - Year-over-year growth 2022-2027 (%)
Exhibit 112: Data Table on China - Year-over-year growth 2022-2027 (%)
9.12 Japan - Market size and forecast 2022-2027
Exhibit 113: Chart on Japan - Market size and forecast 2022-2027 ($ million)
Exhibit 114: Data Table on Japan - Market size and forecast 2022-2027 ($ million)
Exhibit 115: Chart on Japan - Year-over-year growth 2022-2027 (%)
Exhibit 116: Data Table on Japan - Year-over-year growth 2022-2027 (%)
9.13 Market opportunity by geography
Exhibit 117: Market opportunity by geography ($ million)
10 Drivers, Challenges, and Trends
10.1 Market drivers
10.2 Market challenges
10.3 Impact of drivers and challenges
Exhibit 118: Impact of drivers and challenges in 2022 and 2027
10.4 Market trends
11 Vendor Landscape
11.1 Overview
11.2 Vendor landscape
Exhibit 119: Overview on Criticality of inputs and Factors of differentiation
11.3 Landscape disruption
Exhibit 120: Overview on factors of disruption
11.4 Industry risks
Exhibit 121: Impact of key risks on business
12 Vendor Analysis
12.1 Vendors covered
Exhibit 122: Vendors covered
12.2 Market positioning of vendors
Exhibit 123: Matrix on vendor position and classification
12.3 Air Liquide SA
Exhibit 124: Air Liquide SA - Overview
Exhibit 125: Air Liquide SA - Business segments
Exhibit 126: Air Liquide SA - Key news
Exhibit 127: Air Liquide SA - Key offerings
Exhibit 128: Air Liquide SA - Segment focus
Exhibit 129: Air Products and Chemicals Inc. - Overview
Exhibit 130: Air Products and Chemicals Inc. - Business segments
Exhibit 131: Air Products and Chemicals Inc. - Key news
Exhibit 132: Air Products and Chemicals Inc. - Key offerings
Exhibit 133: Air Products and Chemicals Inc. - Segment focus
12.5 Asahi Kasei Corp.
Exhibit 134: Asahi Kasei Corp. - Overview
Exhibit 135: Asahi Kasei Corp. - Business segments
Exhibit 136: Asahi Kasei Corp. - Key news
Exhibit 137: Asahi Kasei Corp. - Key offerings
Exhibit 138: Asahi Kasei Corp. - Segment focus
12.6 DIC Corp.
Exhibit 139: DIC Corp. - Overview
Exhibit 140: DIC Corp. - Business segments
Exhibit 141: DIC Corp. - Key news
Exhibit 142: DIC Corp. - Key offerings
Exhibit 143: DIC Corp. - Segment focus
12.7 Evonik Industries AG
Exhibit 144: Evonik Industries AG - Overview
Exhibit 145: Evonik Industries AG - Business segments
Exhibit 146: Evonik Industries AG - Key news
Exhibit 147: Evonik Industries AG - Key offerings
Exhibit 148: Evonik Industries AG - Segment focus
12.8 FUJIFILM Corp.
Exhibit 149: FUJIFILM Corp. - Overview
Exhibit 150: FUJIFILM Corp. - Business segments
Exhibit 151: FUJIFILM Corp. - Key news
Exhibit 152: FUJIFILM Corp. - Key offerings
Exhibit 153: FUJIFILM Corp. - Segment focus
12.9 GENERON
Exhibit 154: GENERON - Overview
Exhibit 155: GENERON - Product / Service
Exhibit 156: GENERON - Key offerings
12.10 Grasys JSC
Exhibit 157: Grasys JSC - Overview
Exhibit 158: Grasys JSC - Product / Service
Exhibit 159: Grasys JSC - Key offerings
Exhibit 160: Honeywell International Inc - Overview
Exhibit 161: Honeywell International Inc - Business segments
Exhibit 162: Honeywell International Inc - Key news
Exhibit 163: Honeywell International Inc - Key offerings
Exhibit 164: Honeywell International Inc - Segment focus
12.12 KNM Group Berhad
Exhibit 165: KNM Group Berhad - Overview
Exhibit 166: KNM Group Berhad - Business segments
Exhibit 167: KNM Group Berhad - Key offerings
Exhibit 168: KNM Group Berhad - Segment focus
12.13 Membrane Technology and Research Inc.
Exhibit 169: Membrane Technology and Research Inc. - Overview
Exhibit 170: Membrane Technology and Research Inc. - Product / Service
Exhibit 171: Membrane Technology and Research Inc. - Key offerings
12.14 Parker Hannifin Corp.
Exhibit 172: Parker Hannifin Corp. - Overview
Exhibit 173: Parker Hannifin Corp. - Business segments
Exhibit 174: Parker Hannifin Corp. - Key news
Exhibit 175: Parker Hannifin Corp. - Key offerings
Exhibit 176: Parker Hannifin Corp. - Segment focus
12.15 PermSelect Inc.
Exhibit 177: PermSelect Inc. - Overview
Exhibit 178: PermSelect Inc. - Product / Service
Exhibit 179: PermSelect Inc. - Key offerings
12.16 Schlumberger Ltd.
Exhibit 180: Schlumberger Ltd. - Overview
Exhibit 181: Schlumberger Ltd. - Business segments
Exhibit 182: Schlumberger Ltd. - Key news
Exhibit 183: Schlumberger Ltd. - Key offerings
Exhibit 184: Schlumberger Ltd. - Segment focus
12.17 Ube Corp.
Exhibit 185: Ube Corp. - Overview
Exhibit 186: Ube Corp. - Business segments
Exhibit 187: Ube Corp. - Key offerings
Exhibit 188: Ube Corp. - Segment focus
13 Appendix
13.1 Scope of the report
13.2 Inclusions and exclusions checklist
Exhibit 189: Inclusions checklist
Exhibit 190: Exclusions checklist
13.3 Currency conversion rates for US$
Exhibit 191: Currency conversion rates for US$
13.4 Research methodology
Exhibit 192: Research methodology
Exhibit 193: Validation techniques employed for market sizing
Exhibit 194: Information sources
13.5 List of abbreviations
Exhibit 195: List of abbreviations
About Us
Technavio is a leading global technology research and advisory company. Their research and analysis focus on emerging market trends and provide actionable insights to help businesses identify market opportunities and develop effective strategies to optimize their market positions. With over 500 specialized analysts, Technavio's report library consists of more than 17,000 reports and counting, covering 800 technologies, spanning across 50 countries. Their client base consists of enterprises of all sizes, including more than 100 Fortune 500 companies. This growing client base relies on Technavio's comprehensive coverage, extensive research, and actionable market insights to identify opportunities in existing and potential markets and assess their competitive positions within changing market scenarios.
Contact
Technavio Research
Jesse Maida
Media & Marketing Executive
US: +1 844 364 1100
UK: +44 203 893 3200
Email: [email protected]
Website: www.technavio.com/
SOURCE Technavio
更多内容,请访问原始网站
文中所述内容并不反映新药情报库及其所属公司任何意见及观点,如有版权侵扰或错误之处,请及时联系我们,我们会在24小时内配合处理。
适应症
-靶点
-药物
-生物医药百科问答
全新生物医药AI Agent 覆盖科研全链路,让突破性发现快人一步


立即开始免费试用!
智慧芽新药情报库是智慧芽专为生命科学人士构建的基于AI的创新药情报平台,助您全方位提升您的研发与决策效率。
立即开始数据试用!
智慧芽新药库数据也通过智慧芽数据服务平台,以API或者数据包形式对外开放,助您更加充分利用智慧芽新药情报信息。