预约演示
X-ray Crystallography Market Size to Grow by USD 493.74 Million | Anton Paar GmbH and Bruker Corp. Among Key Vendors | Technavio
2022-06-06
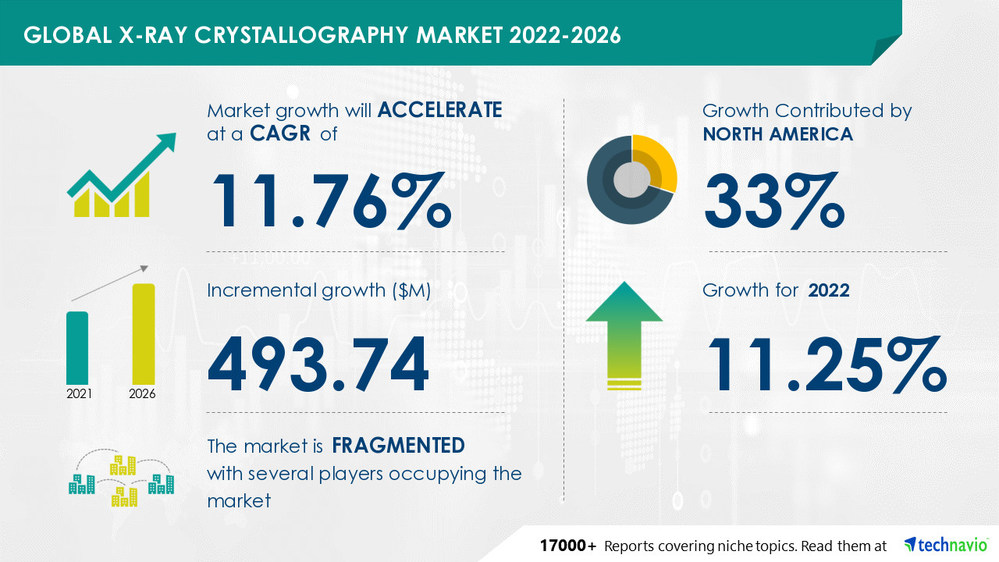
NEW YORK, June 6, 2022 /PRNewswire/ -- The "X-ray Crystallography Market by End-user (Pharmaceutical, Biotechnology, and Others) and Geography (North America, Europe, Asia, and Rest of World (ROW)) - Forecast and Analysis 2022-2026" report has been added to Technavio's offering. The market size is set to grow by USD 493.74 million from 2021 to 2026. Moreover, the growth momentum of the market will progress at a CAGR of 11.76% during the forecast period, according to Technavio.
Find additional highlights related to the market.
Download an Exclusive Sample Report
Preview
来源: PRNewswire
Technavio has announced its latest market research report titled X-ray Crystallography Market by End-user and Geography - Forecast and Analysis 2022-2026
Frequently Asked Questions:
Based on segmentation by end-user, which is the leading segment in the market?
Based on segmentation by end-user, the
pharmaceutical segment is the leading segment in the market.
What are the major trends in the market?
Outsourcing of the drug discovery process is one of the key trends in the x-ray crystallography market.
What is the year-over-year growth rate of the market in 2022?
The year-over-year growth rate of the market in 2022 is
11.25%.
How big is the North American market?
33% of the market's growth will originate from North America during the forecast period.
X-ray Crystallography Market 2022-2026: Scope
The x-ray crystallography market report covers the following areas:
X-ray Crystallography Market Size
X-ray Crystallography Market Trends
X-ray Crystallography Market Industry Analysis
Subscribe to our "Basic Plan" billed annually at USD 5000
. Get lifetime access to our Technavio Insights
X-ray Crystallography Market 2022-2026: Vendor Analysis
The x-ray crystallography market is fragmented, and the vendors are deploying growth strategies such as investment in R&D to compete in the market. Agilent Technologies Inc., Anton Paar GmbH, ARINAX SAS, Bruker Corp., Calibre Scientific Inc., Charles River Laboratories International Inc., Hitachi High Tech Corp., HUBER Diffraktionstechnik GmbH and Co. KG, Intertek Group Plc, MiTeGen LLC, Nippon Kayaku Co. Ltd., Olympus Corp., PerkinElmer Inc., Rigaku Corp., Shimadzu Corp., Spectris Plc, Tecan Group Ltd., Thermo Fisher Scientific Inc., and WuXi AppTec Co. Ltd. are some of the major market participants. The key offerings of some of these vendors are listed below:
Anton Paar GmbH - The company offers x-ray crystallography, namely X-Ray diffraction.
Bruker Corp. - The company offers x-ray crystallography, namely Single Crystal X-ray Diffractometers.
Charles River Laboratories International Inc. - The company offers x-ray crystallography to support both stand-alone and integrated drug discovery projects.
Olympus Corp. - The company offers x-ray crystallography such as XRD and XRF analyzers.
PerkinElmer Inc. - The company offers x-ray crystallography such as XRD Detector Series.
X-ray Crystallography Market 2022-2026: Segmentation
End-user
Others
Geography
North America
Europe
Asia
Rest Of World (ROW)
View a Sample Report Now
to learn about the contribution of each segment
X-ray Crystallography Market 2022-2026: Key Highlights
CAGR of the market during the forecast period 2022-2026
Detailed information on factors that will assist x-ray crystallography market growth during the next five years
Estimation of the x-ray crystallography market size and its contribution to the parent market
Predictions on upcoming trends and changes in consumer behavior
The growth of the x-ray crystallography market across North America, Europe, Asia, and Rest of World (ROW)
Analysis of the market's competitive landscape and detailed information on vendors
Comprehensive details of factors that will challenge the growth of x-ray crystallography market vendors
Related Reports:
Vertebral Augmentation Market by Product and Geography - Forecast and Analysis 2022-2026
Medical Crutches Market by Product and Geography - Forecast and Analysis 2022-2026
Table of Contents
1 Executive Summary
1.1 Market overview
Exhibit 01: Executive Summary – Chart on Market Overview
Exhibit 02: Executive Summary – Data Table on Market Overview
Exhibit 03: Executive Summary – Chart on Global Market Characteristics
Exhibit 04: Executive Summary – Chart on Market by Geography
Exhibit 05: Executive Summary – Chart on Market Segmentation by End-user
Exhibit 06: Executive Summary – Chart on Incremental Growth
Exhibit 07: Executive Summary – Data Table on Incremental Growth
Exhibit 08: Executive Summary – Chart on Vendor Market Positioning
2 Market Landscape
2.1 Market ecosystem
Exhibit 09: Parent market
Exhibit 10: Market Characteristics
3 Market Sizing
3.1 Market definition
Exhibit 11: Offerings of vendors included in the market definition
3.2 Market segment analysis
Exhibit 12: Market segments
3.3 Market size 2021
3.4 Market outlook: Forecast for 2021-2026
Exhibit 13: Chart on Global - Market size and forecast 2021-2026 ($ million)
Exhibit 14: Data Table on Global - Market size and forecast 2021-2026 ($ million)
Exhibit 15: Chart on Global Market: Year-over-year growth 2021-2026 (%)
Exhibit 16: Data Table on Global Market: Year-over-year growth 2021-2026 (%)
4 Five Forces Analysis
4.1 Five forces summary
Exhibit 17: Five forces analysis - Comparison between 2021 and 2026
4.2 Bargaining power of buyers
Exhibit 18: Chart on Bargaining power of buyers – Impact of key factors 2021 and 2026
4.3 Bargaining power of suppliers
Exhibit 19: Bargaining power of suppliers – Impact of key factors in 2021 and 2026
4.4 Threat of new entrants
Exhibit 20: Threat of new entrants – Impact of key factors in 2021 and 2026
4.5 Threat of substitutes
Exhibit 21: Threat of substitutes – Impact of key factors in 2021 and 2026
4.6 Threat of rivalry
Exhibit 22: Threat of rivalry – Impact of key factors in 2021 and 2026
4.7 Market condition
Exhibit 23: Chart on Market condition - Five forces 2021 and 2026
5 Market Segmentation by End-user
5.1 Market segments
Exhibit 24: Chart on End-user - Market share 2021-2026 (%)
Exhibit 25: Data Table on End-user - Market share 2021-2026 (%)
5.2 Comparison by End-user
Exhibit 26: Chart on Comparison by End-user
Exhibit 27: Data Table on Comparison by End-user
5.3 Pharmaceutical - Market size and forecast 2021-2026
Exhibit 28: Chart on Pharmaceutical - Market size and forecast 2021-2026 ($ million)
Exhibit 29: Data Table on Pharmaceutical - Market size and forecast 2021-2026 ($ million)
Exhibit 30: Chart on Pharmaceutical - Year-over-year growth 2021-2026 (%)
Exhibit 31: Data Table on Pharmaceutical - Year-over-year growth 2021-2026 (%)
5.4 Biotechnology - Market size and forecast 2021-2026
Exhibit 32: Chart on Biotechnology - Market size and forecast 2021-2026 ($ million)
Exhibit 33: Data Table on Biotechnology - Market size and forecast 2021-2026 ($ million)
Exhibit 34: Chart on Biotechnology - Year-over-year growth 2021-2026 (%)
Exhibit 35: Data Table on Biotechnology - Year-over-year growth 2021-2026 (%)
5.5 Others - Market size and forecast 2021-2026
Exhibit 36: Chart on Others - Market size and forecast 2021-2026 ($ million)
Exhibit 37: Data Table on Others - Market size and forecast 2021-2026 ($ million)
Exhibit 38: Chart on Others - Year-over-year growth 2021-2026 (%)
Exhibit 39: Data Table on Others - Year-over-year growth 2021-2026 (%)
5.6 Market opportunity by End-user
Exhibit 40: Market opportunity by End-user ($ million)
6 Customer Landscape
6.1 Customer landscape overview
Exhibit 41: Analysis of price sensitivity, lifecycle, customer purchase basket, adoption rates, and purchase criteria
7 Geographic Landscape
7.1 Geographic segmentation
Exhibit 42: Chart on Market share by geography 2021-2026 (%)
Exhibit 43: Data Table on Market share by geography 2021-2026 (%)
7.2 Geographic comparison
Exhibit 44: Chart on Geographic comparison
Exhibit 45: Data Table on Geographic comparison
7.3 North America - Market size and forecast 2021-2026
Exhibit 46: Chart on North America - Market size and forecast 2021-2026 ($ million)
Exhibit 47: Data Table on North America - Market size and forecast 2021-2026 ($ million)
Exhibit 48: Chart on North America - Year-over-year growth 2021-2026 (%)
Exhibit 49: Data Table on North America - Year-over-year growth 2021-2026 (%)
7.4 Europe - Market size and forecast 2021-2026
Exhibit 50: Chart on Europe - Market size and forecast 2021-2026 ($ million)
Exhibit 51: Data Table on Europe - Market size and forecast 2021-2026 ($ million)
Exhibit 52: Chart on Europe - Year-over-year growth 2021-2026 (%)
Exhibit 53: Data Table on Europe - Year-over-year growth 2021-2026 (%)
7.5 Asia - Market size and forecast 2021-2026
Exhibit 54: Chart on Asia - Market size and forecast 2021-2026 ($ million)
Exhibit 55: Data Table on Asia - Market size and forecast 2021-2026 ($ million)
Exhibit 56: Chart on Asia - Year-over-year growth 2021-2026 (%)
Exhibit 57: Data Table on Asia - Year-over-year growth 2021-2026 (%)
7.6 Rest of World (ROW) - Market size and forecast 2021-2026
Exhibit 58: Chart on Rest of World (ROW) - Market size and forecast 2021-2026 ($ million)
Exhibit 59: Data Table on Rest of World (ROW) - Market size and forecast 2021-2026 ($ million)
Exhibit 60: Chart on Rest of World (ROW) - Year-over-year growth 2021-2026 (%)
Exhibit 61: Data Table on Rest of World (ROW) - Year-over-year growth 2021-2026 (%)
7.7 US - Market size and forecast 2021-2026
Exhibit 62: Chart on US - Market size and forecast 2021-2026 ($ million)
Exhibit 63: Data Table on US - Market size and forecast 2021-2026 ($ million)
Exhibit 64: Chart on US - Year-over-year growth 2021-2026 (%)
Exhibit 65: Data Table on US - Year-over-year growth 2021-2026 (%)
7.8 Germany - Market size and forecast 2021-2026
Exhibit 66: Chart on Germany - Market size and forecast 2021-2026 ($ million)
Exhibit 67: Data Table on Germany - Market size and forecast 2021-2026 ($ million)
Exhibit 68: Chart on Germany - Year-over-year growth 2021-2026 (%)
Exhibit 69: Data Table on Germany - Year-over-year growth 2021-2026 (%)
7.9 China - Market size and forecast 2021-2026
Exhibit 70: Chart on China - Market size and forecast 2021-2026 ($ million)
Exhibit 71: Data Table on China - Market size and forecast 2021-2026 ($ million)
Exhibit 72: Chart on China - Year-over-year growth 2021-2026 (%)
Exhibit 73: Data Table on China - Year-over-year growth 2021-2026 (%)
7.10 UK - Market size and forecast 2021-2026
Exhibit 74: Chart on UK - Market size and forecast 2021-2026 ($ million)
Exhibit 75: Data Table on UK - Market size and forecast 2021-2026 ($ million)
Exhibit 76: Chart on UK - Year-over-year growth 2021-2026 (%)
Exhibit 77: Data Table on UK - Year-over-year growth 2021-2026 (%)
7.11 Japan - Market size and forecast 2021-2026
Exhibit 78: Chart on Japan - Market size and forecast 2021-2026 ($ million)
Exhibit 79: Data Table on Japan - Market size and forecast 2021-2026 ($ million)
Exhibit 80: Chart on Japan - Year-over-year growth 2021-2026 (%)
Exhibit 81: Data Table on Japan - Year-over-year growth 2021-2026 (%)
7.12 Market opportunity by geography
Exhibit 82: Market opportunity by geography ($ million)
8 Drivers, Challenges, and Trends
8.1 Market drivers
8.2 Market challenges
8.3 Impact of drivers and challenges
Exhibit 83: Impact of drivers and challenges in 2021 and 2026
8.4 Market trends
9 Vendor Landscape
9.1 Overview
9.2 Vendor landscape
Exhibit 84: Overview on Criticality of inputs and Factors of differentiation
9.3 Landscape disruption
Exhibit 85: Overview on factors of disruption
9.4 Industry risks
Exhibit 86: Impact of key risks on business
10 Vendor Analysis
10.1 Vendors covered
Exhibit 87: Vendors covered
10.2 Market positioning of vendors
Exhibit 88: Matrix on vendor position and classification
10.3 Anton Paar GmbH
Exhibit 89: Anton Paar GmbH - Overview
Exhibit 90: Anton Paar GmbH - Product / Service
Exhibit 91: Anton Paar GmbH - Key offerings
10.4 Bruker Corp.
Exhibit 92: Bruker Corp. - Overview
Exhibit 93: Bruker Corp. - Business segments
Exhibit 94: Bruker Corp. - Key news
Exhibit 95: Bruker Corp. - Key offerings
Exhibit 96: Bruker Corp. - Segment focus
Exhibit 97: Charles River Laboratories International Inc. - Overview
Exhibit 98: Charles River Laboratories International Inc. - Business segments
Exhibit 99: Charles River Laboratories International Inc. - Key news
Exhibit 100: Charles River Laboratories International Inc. - Key offerings
Exhibit 101: Charles River Laboratories International Inc. - Segment focus
10.6 Intertek Group Plc
Exhibit 102: Intertek Group Plc - Overview
Exhibit 103: Intertek Group Plc - Business segments
Exhibit 104: Intertek Group Plc - Key news
Exhibit 105: Intertek Group Plc - Key offerings
Exhibit 106: Intertek Group Plc - Segment focus
10.7 Olympus Corp.
Exhibit 107: Olympus Corp. - Overview
Exhibit 108: Olympus Corp. - Business segments
Exhibit 109: Olympus Corp. - Key news
Exhibit 110: Olympus Corp. - Key offerings
Exhibit 111: Olympus Corp. - Segment focus
10.8 PerkinElmer Inc.
Exhibit 112: PerkinElmer Inc. - Overview
Exhibit 113: PerkinElmer Inc. - Business segments
Exhibit 114: PerkinElmer Inc. - Key news
Exhibit 115: PerkinElmer Inc. - Key offerings
Exhibit 116: PerkinElmer Inc. - Segment focus
10.9 Rigaku Corp.
Exhibit 117: Rigaku Corp. - Overview
Exhibit 118: Rigaku Corp. - Product / Service
Exhibit 119: Rigaku Corp. - Key offerings
10.10 Shimadzu Corp.
Exhibit 120: Shimadzu Corp. - Overview
Exhibit 121: Shimadzu Corp. - Business segments
Exhibit 122: Shimadzu Corp. - Key news
Exhibit 123: Shimadzu Corp. - Key offerings
Exhibit 124: Shimadzu Corp. - Segment focus
10.11 Tecan Group Ltd.
Exhibit 125: Tecan Group Ltd. - Overview
Exhibit 126: Tecan Group Ltd. - Business segments
Exhibit 127: Tecan Group Ltd. - Key offerings
Exhibit 128: Tecan Group Ltd. - Segment focus
Exhibit 129: Thermo Fisher Scientific Inc. - Overview
Exhibit 130: Thermo Fisher Scientific Inc. - Business segments
Exhibit 131: Thermo Fisher Scientific Inc. - Key news
Exhibit 132: Thermo Fisher Scientific Inc. - Key offerings
Exhibit 133: Thermo Fisher Scientific Inc. - Segment focus
11 Appendix
11.1 Scope of the report
11.2 Inclusions and exclusions checklist
Exhibit 134: Inclusions checklist
Exhibit 135: Exclusions checklist
11.3 Currency conversion rates for US$
Exhibit 136: Currency conversion rates for US$
11.4 Research methodology
Exhibit 137: Research methodology
Exhibit 138: Validation techniques employed for market sizing
Exhibit 139: Information sources
11.5 List of abbreviations
Exhibit 140: List of abbreviations
About Us
Technavio is a leading global technology research and advisory company. Their research and analysis focus on emerging market trends and provide actionable insights to help businesses identify market opportunities and develop effective strategies to optimize their market positions. With over 500 specialized analysts, Technavio's report library consists of more than 17,000 reports and counting, covering 800 technologies, spanning across 50 countries. Their client base consists of enterprises of all sizes, including more than 100 Fortune 500 companies. This growing client base relies on Technavio's comprehensive coverage, extensive research, and actionable market insights to identify opportunities in existing and potential markets and assess their competitive positions within changing market scenarios.
Contact
Technavio Research
Jesse Maida
Media & Marketing Executive
US: +1 844 364 1100
UK: +44 203 893 3200
Email: [email protected]
Website: www.technavio.com/
SOURCE Technavio
更多内容,请访问原始网站
文中所述内容并不反映新药情报库及其所属公司任何意见及观点,如有版权侵扰或错误之处,请及时联系我们,我们会在24小时内配合处理。
适应症
-靶点
-药物
-生物医药百科问答
全新生物医药AI Agent 覆盖科研全链路,让突破性发现快人一步


立即开始免费试用!
智慧芽新药情报库是智慧芽专为生命科学人士构建的基于AI的创新药情报平台,助您全方位提升您的研发与决策效率。
立即开始数据试用!
智慧芽新药库数据也通过智慧芽数据服务平台,以API或者数据包形式对外开放,助您更加充分利用智慧芽新药情报信息。