预约演示
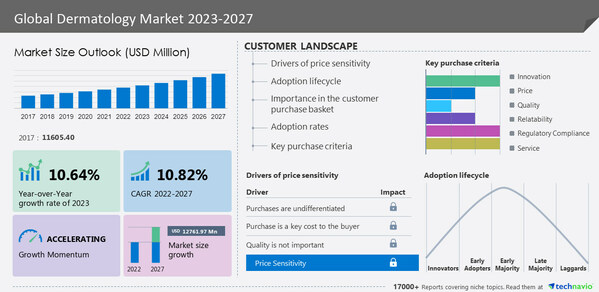
The Dermatology Market to grow by USD 12,761.97 million from 2022 to 2027|Increasing prevalence of tele dermatology is a major trend - Technavio
2023-08-02
NEW YORK, Aug. 2, 2023 /PRNewswire/ -- The
dermatology market is to grow by
USD 12,761.97 million between 2023 and 2027 and register a
CAGR of 10.82%, according to Technavio's latest market research report estimates. With a focus on identifying dominant industry influencers, Technavio's reports present a detailed study by the way of synthesis, and summation of data from multiple sources. This report offers an up-to-date analysis of the current market scenario, the latest trends and drivers, and the overall market environment. The report is segmented by Application, End-user, and Geography.
North America is estimated to contribute
39% to the growth of the global market during the forecast period. This is due to the growing geriatric population and the high prevalence of chronic and infectious skin diseases. As a result, the demand for dermatology products and services is increasing in the region. The US is the key contributor to the market in the region due to increased awareness of diagnostic tests related to skin diseases among older people.
Read our Sample Report
Continue Reading
Preview
来源: PRNewswire
Technavio has announced its latest market research report titled Global Dermatology Market
The report also covers the following areas
:
Dermatology Market size
Dermatology Market trends
Dermatology Market industry analysis
Dermatology Market 2023-2027: Segmentation
Application
Dermatitis
Alopecia And Others
End-user
Skin Clinics
Hospitals
Others
Geography
North America
Europe
Asia
Rest Of World (ROW)
The market share growth by the
Acne segment will be significant during the forecast period. The major application for the dermatological equipment market is the treatment of acne, a typical skin condition characterized by blackheads, and pimples. The incidence of acne in adolescents and adults is increasing, and advances in dermatological treatments are increasing the demand for skin care products. In addition, the introduction of cutting-edge products and technologies that make acne treatment options accessible to patients around the world are the key factors driving the market development.
Dermatology Market 2023-2027: Company Analysis and Scope
Some of the major companies in the dermatology market include Aesthetic Group, Alma Lasers Ltd., Bausch Health Co. Inc., Biofrontera AG, Bioglint Derma Care, Bruker Corp., Candela Corp., Canfield Scientific Inc., Cutera Inc., Cynosure LLC, Dermatology and Co., DermLite LLC, Ernst Pharmacia TM, Fourrts India Laboratories Pvt. Ltd., Genesis Biosystems Inc., HEINE Optotechnik GmbH and Co. KG, Image Derm Inc., LEO Pharma AS, Lumenis Be Ltd, and Novotech Health Holdings. To help businesses improve their market position, Technavio's report provides a detailed analysis of around 15+ companies operating in the market.
Company Offering
Aesthetic Group - The company offers dermatology products such as biopsy punches and dermatological curettes.
Alma Lasers Ltd - The company offers dermatology products such as DermaClear advanced hydra dermabrasion solution.
Bioglint Derma Care - The company offers dermatology products such as Alospa and Clinket.
The competitive scenario categorizes companies based on various performance indicators. Some of the factors considered include the financial performance of companies, growth strategies, product innovations, new product launches, investments, and growth in market share, among others Buy the Report
Dermatology Market 2023-2027: Market Dynamics
Key Drivers
The effective diagnosis of skin disorders is a key factor driving market growth. Skin disorders are becoming more prevalent in the population, which arises the need for effective diagnosis, treatment, and monitoring. These diseases include melanoma, acne, psoriasis, and eczema. Skin products and services must be available to make accurate diagnoses, provide targeted treatments, and track skin disease status. Additionally, laser therapy devices offer precise and targeted treatment options for skin disorders. Hence, increasing diagnosis of skin disorders is expected to drive market growth during the forecast period.
Major Trends
The increasing prevalence of tele dermatology is a major trend in the market. Advances in technology have allowed patients to see dermatologists remotely. Patients can now consult a dermatologist from the comfort of their own homes, saving time and effort. With telemedicine, dermatologists can treat life-threatening diseases such as skin cancer and provide the most appropriate treatment. The growing demand for telemedicine and virtual consultations has made dermatology care accessible to more people. Hence, increasing teledermatology is expected to drive market growth during the forecast period.
Significant Challenges
The side effects of dermatology and safety concerns are a significant challenge restricting market growth. Side effects make patients hesitant to undergo dermatological treatment. Pharmaceutical companies and medical professionals must address and reduce these safety issues through strict clinical trials, thorough safety profiling, and effective patient education. Many companies are building trust among their consumers which is important to give confidence and enable them to make informed decisions about dermatological treatment. Hence, the increasing safety concerns are expected to restrict market growth during the forecast period.
Drivers, Trends, and challenges have an impact on market dynamics, which can impact businesses. Find more insights in a sample report!
Dermatology Market 2023-2027: Key Highlights
CAGR of the market during the forecast period 2023-2027
Detailed information on factors that will assist dermatology market growth during the next five years.
Estimation of the dermatology market size and its contribution to the parent market
Predictions on upcoming trends and changes in consumer behavior
The growth of the dermatology market
Analysis of the market's competitive landscape and detailed information on companies
Comprehensive details of factors that will challenge the growth of dermatology market companies.
Get Instant access to 17000+ market research reports!
Technavio's Subscription Platform
Related Reports
The
vertigo drugs market is estimated to grow by USD 551.42 million at a CAGR of 5.58% between 2022 and 2027. Furthermore, this report extensively covers market segmentation by type (vertigo, and central vertigo), distribution channel (offline and online), and geography (North America, Europe, Asia, and the Rest of the World (ROW)). Integration of digital health solutions in vertigo is a major trend in the market.
The
specialty pharmaceuticals market is estimated to grow by USD 331.12 billion at a CAGR of 12.59% between 2022 and 2027. Furthermore, this report extensively covers market segmentation by application (oncology, multiple sclerosis, inflammatory conditions, infectious diseases, and others), distribution channel (offline and online), and geography (North America, Europe, Asia, and the Rest of the World (ROW)). The increasing demand for R&D due to government healthcare expenditure is a key factor driving market growth during the forecast period.
Table of Contents
1 Executive Summary
1.1 Market Overview
Exhibit 01: Executive Summary – Chart on Market Overview
Exhibit 02: Executive Summary – Data Table on Market Overview
Exhibit 03: Executive Summary – Chart on Global Market Characteristics
Exhibit 04: Executive Summary – Chart on Market by Geography
Exhibit 05: Executive Summary – Chart on Market Segmentation by Application
Exhibit 06: Executive Summary – Chart on Market Segmentation by End-user
Exhibit 07: Executive Summary – Chart on Incremental Growth
Exhibit 08: Executive Summary – Data Table on Incremental Growth
Exhibit 09: Executive Summary – Chart on Company Market Positioning
2 Market Landscape
2.1 Market ecosystem
Exhibit 10: Parent market
Exhibit 11: Market Characteristics
3 Market Sizing
3.1 Market definition
Exhibit 12: Offerings of companies included in the market definition
3.2 Market segment analysis
Exhibit 13: Market segments
3.3 Market size 2022
3.4 Market outlook: Forecast for 2022-2027
Exhibit 14: Chart on Global - Market size and forecast 2022-2027 ($ million)
Exhibit 15: Data Table on Global - Market size and forecast 2022-2027 ($ million)
Exhibit 16: Chart on Global Market: Year-over-year growth 2022-2027 (%)
Exhibit 17: Data Table on Global Market: Year-over-year growth 2022-2027 (%)
4 Historic Market Size
4.1 Global dermatology market 2017 - 2021
Exhibit 18: Historic Market Size – Data Table on global dermatology market 2017 - 2021 ($ million)
4.2 Application Segment Analysis 2017 - 2021
Exhibit 19: Historic Market Size – Application Segment 2017 - 2021 ($ million)
4.3 End-User Segment Analysis 2017 - 2021
Exhibit 20: Historic Market Size – End-User Segment 2017 - 2021 ($ million)
4.4 Geography Segment Analysis 2017 - 2021
Exhibit 21: Historic Market Size – Geography Segment 2017 - 2021 ($ million)
4.5 Country Segment Analysis 2017 - 2021
Exhibit 22: Historic Market Size – Country Segment 2017 - 2021 ($ million)
5 Five Forces Analysis
5.1 Five forces summary
Exhibit 23: Five forces analysis - Comparison between 2022 and 2027
5.2 Bargaining power of buyers
Exhibit 24: Chart on Bargaining power of buyers – Impact of key factors 2022 and 2027
5.3 Bargaining power of suppliers
Exhibit 25: Bargaining power of suppliers – Impact of key factors in 2022 and 2027
5.4 Threat of new entrants
Exhibit 26: Threat of new entrants – Impact of key factors in 2022 and 2027
5.5 Threat of substitutes
Exhibit 27: Threat of substitutes – Impact of key factors in 2022 and 2027
5.6 Threat of rivalry
Exhibit 28: Threat of rivalry – Impact of key factors in 2022 and 2027
5.7 Market condition
Exhibit 29: Chart on Market condition - Five forces 2022 and 2027
6 Market Segmentation by Application
6.1 Market segments
Exhibit 30: Chart on Application - Market share 2022-2027 (%)
Exhibit 31: Data Table on Application - Market share 2022-2027 (%)
6.2 Comparison by Application
Exhibit 32: Chart on Comparison by Application
Exhibit 33: Data Table on Comparison by Application
6.3 Acne - Market size and forecast 2022-2027
Exhibit 34: Chart on Acne - Market size and forecast 2022-2027 ($ million)
Exhibit 35: Data Table on Acne - Market size and forecast 2022-2027 ($ million)
Exhibit 36: Chart on Acne - Year-over-year growth 2022-2027 (%)
Exhibit 37: Data Table on Acne - Year-over-year growth 2022-2027 (%)
6.4 Psoriasis - Market size and forecast 2022-2027
Exhibit 38: Chart on Psoriasis - Market size and forecast 2022-2027 ($ million)
Exhibit 39: Data Table on Psoriasis - Market size and forecast 2022-2027 ($ million)
Exhibit 40: Chart on Psoriasis - Year-over-year growth 2022-2027 (%)
Exhibit 41: Data Table on Psoriasis - Year-over-year growth 2022-2027 (%)
6.5 Dermatitis - Market size and forecast 2022-2027
Exhibit 42: Chart on Dermatitis - Market size and forecast 2022-2027 ($ million)
Exhibit 43: Data Table on Dermatitis - Market size and forecast 2022-2027 ($ million)
Exhibit 44: Chart on Dermatitis - Year-over-year growth 2022-2027 (%)
Exhibit 45: Data Table on Dermatitis - Year-over-year growth 2022-2027 (%)
6.6 Skin cancer - Market size and forecast 2022-2027
Exhibit 46: Chart on Skin cancer - Market size and forecast 2022-2027 ($ million)
Exhibit 47: Data Table on Skin cancer - Market size and forecast 2022-2027 ($ million)
Exhibit 48: Chart on Skin cancer - Year-over-year growth 2022-2027 (%)
Exhibit 49: Data Table on Skin cancer - Year-over-year growth 2022-2027 (%)
6.7 Alopecia and others - Market size and forecast 2022-2027
Exhibit 50: Chart on Alopecia and others - Market size and forecast 2022-2027 ($ million)
Exhibit 51: Data Table on Alopecia and others - Market size and forecast 2022-2027 ($ million)
Exhibit 52: Chart on Alopecia and others - Year-over-year growth 2022-2027 (%)
Exhibit 53: Data Table on Alopecia and others - Year-over-year growth 2022-2027 (%)
6.8 Market opportunity by Application
Exhibit 54: Market opportunity by Application ($ million)
Exhibit 55: Data Table on Market opportunity by Application ($ million)
7 Market Segmentation by End-user
7.1 Market segments
Exhibit 56: Chart on End-user - Market share 2022-2027 (%)
Exhibit 57: Data Table on End-user - Market share 2022-2027 (%)
7.2 Comparison by End-user
Exhibit 58: Chart on Comparison by End-user
Exhibit 59: Data Table on Comparison by End-user
7.3 Skin clinics - Market size and forecast 2022-2027
Exhibit 60: Chart on Skin clinics - Market size and forecast 2022-2027 ($ million)
Exhibit 61: Data Table on Skin clinics - Market size and forecast 2022-2027 ($ million)
Exhibit 62: Chart on Skin clinics - Year-over-year growth 2022-2027 (%)
Exhibit 63: Data Table on Skin clinics - Year-over-year growth 2022-2027 (%)
7.4 Hospitals - Market size and forecast 2022-2027
Exhibit 64: Chart on Hospitals - Market size and forecast 2022-2027 ($ million)
Exhibit 65: Data Table on Hospitals - Market size and forecast 2022-2027 ($ million)
Exhibit 66: Chart on Hospitals - Year-over-year growth 2022-2027 (%)
Exhibit 67: Data Table on Hospitals - Year-over-year growth 2022-2027 (%)
7.5 Others - Market size and forecast 2022-2027
Exhibit 68: Chart on Others - Market size and forecast 2022-2027 ($ million)
Exhibit 69: Data Table on Others - Market size and forecast 2022-2027 ($ million)
Exhibit 70: Chart on Others - Year-over-year growth 2022-2027 (%)
Exhibit 71: Data Table on Others - Year-over-year growth 2022-2027 (%)
7.6 Market opportunity by End-user
Exhibit 72: Market opportunity by End-user ($ million)
Exhibit 73: Data Table on Market opportunity by End-user ($ million)
8 Customer Landscape
8.1 Customer landscape overview
Exhibit 74: Analysis of price sensitivity, lifecycle, customer purchase basket, adoption rates, and purchase criteria
9 Geographic Landscape
9.1 Geographic segmentation
Exhibit 75: Chart on Market share by geography 2022-2027 (%)
Exhibit 76: Data Table on Market share by geography 2022-2027 (%)
9.2 Geographic comparison
Exhibit 77: Chart on Geographic comparison
Exhibit 78: Data Table on Geographic comparison
9.3 North America - Market size and forecast 2022-2027
Exhibit 79: Chart on North America - Market size and forecast 2022-2027 ($ million)
Exhibit 80: Data Table on North America - Market size and forecast 2022-2027 ($ million)
Exhibit 81: Chart on North America - Year-over-year growth 2022-2027 (%)
Exhibit 82: Data Table on North America - Year-over-year growth 2022-2027 (%)
9.4 Europe - Market size and forecast 2022-2027
Exhibit 83: Chart on Europe - Market size and forecast 2022-2027 ($ million)
Exhibit 84: Data Table on Europe - Market size and forecast 2022-2027 ($ million)
Exhibit 85: Chart on Europe - Year-over-year growth 2022-2027 (%)
Exhibit 86: Data Table on Europe - Year-over-year growth 2022-2027 (%)
9.5 Asia - Market size and forecast 2022-2027
Exhibit 87: Chart on Asia - Market size and forecast 2022-2027 ($ million)
Exhibit 88: Data Table on Asia - Market size and forecast 2022-2027 ($ million)
Exhibit 89: Chart on Asia - Year-over-year growth 2022-2027 (%)
Exhibit 90: Data Table on Asia - Year-over-year growth 2022-2027 (%)
9.6 Rest of World (ROW) - Market size and forecast 2022-2027
Exhibit 91: Chart on Rest of World (ROW) - Market size and forecast 2022-2027 ($ million)
Exhibit 92: Data Table on Rest of World (ROW) - Market size and forecast 2022-2027 ($ million)
Exhibit 93: Chart on Rest of World (ROW) - Year-over-year growth 2022-2027 (%)
Exhibit 94: Data Table on Rest of World (ROW) - Year-over-year growth 2022-2027 (%)
9.7 US - Market size and forecast 2022-2027
Exhibit 95: Chart on US - Market size and forecast 2022-2027 ($ million)
Exhibit 96: Data Table on US - Market size and forecast 2022-2027 ($ million)
Exhibit 97: Chart on US - Year-over-year growth 2022-2027 (%)
Exhibit 98: Data Table on US - Year-over-year growth 2022-2027 (%)
9.8 Finland - Market size and forecast 2022-2027
Exhibit 99: Chart on Finland - Market size and forecast 2022-2027 ($ million)
Exhibit 100: Data Table on Finland - Market size and forecast 2022-2027 ($ million)
Exhibit 101: Chart on Finland - Year-over-year growth 2022-2027 (%)
Exhibit 102: Data Table on Finland - Year-over-year growth 2022-2027 (%)
9.9 China - Market size and forecast 2022-2027
Exhibit 103: Chart on China - Market size and forecast 2022-2027 ($ million)
Exhibit 104: Data Table on China - Market size and forecast 2022-2027 ($ million)
Exhibit 105: Chart on China - Year-over-year growth 2022-2027 (%)
Exhibit 106: Data Table on China - Year-over-year growth 2022-2027 (%)
9.10 Canada - Market size and forecast 2022-2027
Exhibit 107: Chart on Canada - Market size and forecast 2022-2027 ($ million)
Exhibit 108: Data Table on Canada - Market size and forecast 2022-2027 ($ million)
Exhibit 109: Chart on Canada - Year-over-year growth 2022-2027 (%)
Exhibit 110: Data Table on Canada - Year-over-year growth 2022-2027 (%)
9.11 India - Market size and forecast 2022-2027
Exhibit 111: Chart on India - Market size and forecast 2022-2027 ($ million)
Exhibit 112: Data Table on India - Market size and forecast 2022-2027 ($ million)
Exhibit 113: Chart on India - Year-over-year growth 2022-2027 (%)
Exhibit 114: Data Table on India - Year-over-year growth 2022-2027 (%)
9.12 Market opportunity by geography
Exhibit 115: Market opportunity by geography ($ million)
Exhibit 116: Data Tables on Market opportunity by geography ($ million)
10 Drivers, Challenges, and Trends
10.1 Market drivers
10.2 Market challenges
10.3 Impact of drivers and challenges
Exhibit 117: Impact of drivers and challenges in 2022 and 2027
10.4 Market trends
11 Vendor Landscape
11.1 Overview
11.2 Vendor landscape
Exhibit 118: Overview on Criticality of inputs and Factors of differentiation
11.3 Landscape disruption
Exhibit 119: Overview on factors of disruption
11.4 Industry risks
Exhibit 120: Impact of key risks on business
12 Vendor Analysis
12.1 Companies covered
Exhibit 121: Companies covered
12.2 Market positioning of companies
Exhibit 122: Matrix on vendor position and classification
12.3 Aesthetic Group
Exhibit 123: Aesthetic Group - Overview
Exhibit 124: Aesthetic Group - Product / Service
Exhibit 125: Aesthetic Group - Key offerings
12.4 Alma Lasers Ltd.
Exhibit 126: Alma Lasers Ltd. - Overview
Exhibit 127: Alma Lasers Ltd. - Product / Service
Exhibit 128: Alma Lasers Ltd. - Key offerings
Exhibit 129: Bausch Health Co. Inc. - Overview
Exhibit 130: Bausch Health Co. Inc. - Business segments
Exhibit 131: Bausch Health Co. Inc. - Key news
Exhibit 132: Bausch Health Co. Inc. - Key offerings
Exhibit 133: Bausch Health Co. Inc. - Segment focus
12.6 Bioglint Derma Care
Exhibit 134: Bioglint Derma Care - Overview
Exhibit 135: Bioglint Derma Care - Product / Service
Exhibit 136: Bioglint Derma Care - Key offerings
12.7 Bruker Corp.
Exhibit 137: Bruker Corp. - Overview
Exhibit 138: Bruker Corp. - Business segments
Exhibit 139: Bruker Corp. - Key news
Exhibit 140: Bruker Corp. - Key offerings
Exhibit 141: Bruker Corp. - Segment focus
12.8 Candela Corp.
Exhibit 142: Candela Corp. - Overview
Exhibit 143: Candela Corp. - Product / Service
Exhibit 144: Candela Corp. - Key offerings
Exhibit 145: Canfield Scientific Inc. - Overview
Exhibit 146: Canfield Scientific Inc. - Product / Service
Exhibit 147: Canfield Scientific Inc. - Key offerings
12.10 Cutera Inc.
Exhibit 148: Cutera Inc. - Overview
Exhibit 149: Cutera Inc. - Product / Service
Exhibit 150: Cutera Inc. - Key offerings
12.11 Cynosure LLC
Exhibit 151: Cynosure LLC - Overview
Exhibit 152: Cynosure LLC - Product / Service
Exhibit 153: Cynosure LLC - Key offerings
12.12 DermLite LLC
Exhibit 154: DermLite LLC - Overview
Exhibit 155: DermLite LLC - Product / Service
Exhibit 156: DermLite LLC - Key offerings
Exhibit 157: Fourrts India Laboratories Pvt. Ltd. - Overview
Exhibit 158: Fourrts India Laboratories Pvt. Ltd. - Product / Service
Exhibit 159: Fourrts India Laboratories Pvt. Ltd. - Key offerings
12.14 Genesis Biosystems Inc.
Exhibit 160: Genesis Biosystems Inc. - Overview
Exhibit 161: Genesis Biosystems Inc. - Product / Service
Exhibit 162: Genesis Biosystems Inc. - Key offerings
Exhibit 163: HEINE Optotechnik GmbH and Co. KG - Overview
Exhibit 164: HEINE Optotechnik GmbH and Co. KG - Product / Service
Exhibit 165: HEINE Optotechnik GmbH and Co. KG - Key offerings
12.16 Image Derm Inc.
Exhibit 166: Image Derm Inc. - Overview
Exhibit 167: Image Derm Inc. - Product / Service
Exhibit 168: Image Derm Inc. - Key offerings
12.17 Lumenis Be Ltd
Exhibit 169: Lumenis Be Ltd - Overview
Exhibit 170: Lumenis Be Ltd - Product / Service
Exhibit 171: Lumenis Be Ltd - Key offerings
13 Appendix
13.1 Scope of the report
13.2 Inclusions and exclusions checklist
Exhibit 172: Inclusions checklist
Exhibit 173: Exclusions checklist
13.3 Currency conversion rates for US$
Exhibit 174: Currency conversion rates for US$
13.4 Research methodology
Exhibit 175: Research methodology
Exhibit 176: Validation techniques employed for market sizing
Exhibit 177: Information sources
13.5 List of abbreviations
Exhibit 178: List of abbreviations
About Us
Technavio is a leading global technology research and advisory company. Their research and analysis focus on emerging market trends and provides actionable insights to help businesses identify market opportunities and develop effective strategies to optimize their market positions. With over 500 specialized analysts, Technavio's report library consists of more than 17,000 reports and counting, covering 800 technologies, spanning across 50 countries. Their client base consists of enterprises of all sizes, including more than 100 Fortune 500 companies. This growing client base relies on Technavio's comprehensive coverage, extensive research, and actionable market insights to identify opportunities in existing and potential markets and assess their competitive positions within changing market scenarios.
Contact
Technavio Research
Jesse Maida
Media & Marketing Executive
US: +1 844 364 1100
UK: +44 203 893 3200
Email: [email protected]
Website: www.technavio.com
SOURCE Technavio
更多内容,请访问原始网站
文中所述内容并不反映新药情报库及其所属公司任何意见及观点,如有版权侵扰或错误之处,请及时联系我们,我们会在24小时内配合处理。

靶点
-药物
-生物医药百科问答
全新生物医药AI Agent 覆盖科研全链路,让突破性发现快人一步


立即开始免费试用!
智慧芽新药情报库是智慧芽专为生命科学人士构建的基于AI的创新药情报平台,助您全方位提升您的研发与决策效率。
立即开始数据试用!
智慧芽新药库数据也通过智慧芽数据服务平台,以API或者数据包形式对外开放,助您更加充分利用智慧芽新药情报信息。