预约演示
Anticoccidial Drugs Market to grow at a CAGR of 4.1% by 2026, Advances in Biotechnology to be a Major Trend - Technavio
2022-09-06
NEW YORK, Sept. 6, 2022 /PRNewswire/ -- The
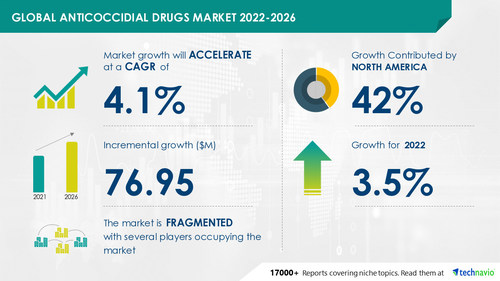
anticoccidial drugs market size is expected to grow by
USD 76.95 million from 2021 to 2026, progressing at a
CAGR of 4.1% during the forecast period.
Advances in biotechnology are the anticoccidial drugs market trends propelling the market growth. Primarily, genomic analysis of all seven Eimeria species that cause coccidiosis in poultry has been accomplished, which may lead to the identification and validation of species-specific protein targets. Moreover, new research on Eimeria species is helping vendors to launch new anticoccidial drugs. For instance, in March 2021, Elanco Animal Health Inc. launched two new veterinary products in Sri Lanka via the local agent Baur and Co. The two products are anticoccidial feed additives. Such new drug discoveries will propel the market growth during the forecast period.
To know about the other market trends - Request a Free Sample Report
Continue Reading
Preview
来源: PRNewswire
Anticoccidial Drugs Market by Type and Geography - Forecast and Analysis 2022-2026
Anticoccidial Drugs Market: Market Dynamics
Drivers: The growing demand for feed additives owing to rising disease outbreaks in livestock, rising awareness about coccidial diseases, and increasing dependency on livestock products are the major factors propelling the market growth.
Challenges: The factors such as stringent government regulations, lack of awareness & limited drug approval will hamper the market growth.
For detailed information on the market dynamics -
Click Now!
Anticoccidial Drugs Market: Segmentation Analysis
The report extensively covers anticoccidial drug market segmentation by
Type (ionophore anticoccidial and chemical derivative anticoccidial) and
Geography (North America, Europe, Asia, and the Rest of the World (ROW)).
Type Landscape
Revenue Generating Segment -The anticoccidial drugs market share growth by the
ionophore anticoccidial segment will be significant during the forecast period. Ionophores have been the most preferred drugs to control coccidiosis as it slowly develops resistance in animals, and they do not completely suppress parasite development, thus allowing the development of immunity in animals after the first exposure. The divalent ionophore lasalocid has been shown to de- crease oocyst production in naturally infected lambs and cattle and in a few cases improve performance and reduce clinical signs of disease when included in the fee Ionophores, also used for lamb and cattle. Such factors are expected to boost market growth during the forecast period.
Geography Landscape
Regional Highlights - 42% of the market's growth will originate from
North America during the forecast period. The US is the key market for the anticoccidial drugs market in North America. Market growth in this region will be slower than the growth of the market in Asia. The increasing livestock in the region, rising demand for quality, and growing concerns about livestock health will facilitate the anticoccidial drugs market growth in North America over the forecast period.
To know about the contribution of each segment - Grab a FREE Sample Now!
Anticoccidial Drugs Market: Vendor Analysis
The anticoccidial drugs market is
fragmented and the vendors are deploying organic and inorganic growth strategies to compete in the market.
Bioproperties Pty Ltd.
Ceva Sante Animale
Huvepharma EOOD
Virbac
To know about the vendor offerings -
Click Now!
What our reports offer:
Market share assessments for the regional and country-level segments
Strategic recommendations for the new entrants
Covers market data for 2020, 2021, and 2025
Market trends (drivers, opportunities, threats, challenges, investment opportunities, and recommendations)
Strategic recommendations in key business segments based on the market estimations
Competitive landscaping mapping the key common trends
Company profiling with detailed strategies, financials, and recent developments
Supply chain trends mapping the latest technological advancements
The competitive scenario provided in the
Anticoccidial Drugs Market Report analyzes, evaluates, and positions companies based on various performance indicators. Some of the factors considered for this analysis include the financial performance of companies over the past few years, growth strategies, product innovations, new product launches, investments, growth in market share, etc. Don't wait, Make a strategic approach & boost your business goals with our Anticoccidial Drugs Market Forecast Report -
Buy Now!
Related Reports:
The
heart attack diagnostics market share is expected to increase by USD 5.34 billion from 2021 to 2026, and the market's growth momentum will accelerate at a CAGR of 7.51%.
The
immunosuppressants market share is expected to increase to USD 6.99 billion from 2021 to 2026, and the market's growth momentum will accelerate at a CAGR of 7.73%.
Browse for Technavio "
Healthcare Market
" Research Reports
Table of Content
1 Executive Summary
1.1 Market Overview
Exhibit 01: Executive Summary – Chart on Market Overview
Exhibit 02: Executive Summary – Data Table on Market Overview
Exhibit 03: Executive Summary – Chart on Global Market Characteristics
Exhibit 04: Executive Summary – Chart on Market by Geography
Exhibit 05: Executive Summary – Chart on Market Segmentation by Type
Exhibit 06: Executive Summary – Chart on Incremental Growth
Exhibit 07: Executive Summary – Data Table on Incremental Growth
Exhibit 08: Executive Summary – Chart on Vendor Market Positioning
2 Market Landscape
2.1 Market ecosystem
Exhibit 09: Parent market
Exhibit 10: Market Characteristics
3 Market Sizing
3.1 Market Definition
Exhibit 11: Offerings of vendors included in the market definition
3.2 Market segment analysis
Exhibit 12: Market segments
3.3 Market size 2021
3.4 Market outlook: Forecast for 2021-2026
Exhibit 13: Chart on Global - Market size and forecast 2021-2026 ($ million)
Exhibit 14: Data Table on Global - Market size and forecast 2021-2026 ($ million)
Exhibit 15: Chart on Global Market: Year-over-year growth 2021-2026 (%)
Exhibit 16: Data Table on Global Market: Year-over-year growth 2021-2026 (%)
4 Five Forces Analysis
4.1 Five forces summary
Exhibit 17: Five forces analysis - Comparison between 2021 and 2026
4.2 Bargaining power of buyers
Exhibit 18: Chart on Bargaining power of buyers – Impact of key factors 2021 and 2026
4.3 Bargaining power of suppliers
Exhibit 19: Bargaining power of suppliers – Impact of key factors in 2021 and 2026
4.4 Threat of new entrants
Exhibit 20: Threat of new entrants – Impact of key factors in 2021 and 2026
4.5 Threat of substitutes
Exhibit 21: Threat of substitutes – Impact of key factors in 2021 and 2026
4.6 Threat of rivalry
Exhibit 22: Threat of rivalry – Impact of key factors in 2021 and 2026
4.7 Market condition
Exhibit 23: Chart on Market condition - Five forces 2021 and 2026
5 Market Segmentation by Type
5.1 Market segments
Exhibit 24: Chart on Type - Market share 2021-2026 (%)
Exhibit 25: Data Table on Type - Market share 2021-2026 (%)
5.2 Comparison by Type
Exhibit 26: Chart on Comparison by Type
Exhibit 27: Data Table on Comparison by Type
5.3 Ionophore anticoccidial - Market size and forecast 2021-2026
Exhibit 28: Chart on Ionophore anticoccidial - Market size and forecast 2021-2026 ($ million)
Exhibit 29: Data Table on Ionophore anticoccidial - Market size and forecast 2021-2026 ($ million)
Exhibit 30: Chart on Ionophore anticoccidial - Year-over-year growth 2021-2026 (%)
Exhibit 31: Data Table on Ionophore anticoccidial - Year-over-year growth 2021-2026 (%)
5.4 Chemical derivative anticoccidial - Market size and forecast 2021-2026
Exhibit 32: Chart on Chemical derivative anticoccidial - Market size and forecast 2021-2026 ($ million)
Exhibit 33: Data Table on Chemical derivative anticoccidial - Market size and forecast 2021-2026 ($ million)
Exhibit 34: Chart on Chemical derivative anticoccidial - Year-over-year growth 2021-2026 (%)
Exhibit 35: Data Table on Chemical derivative anticoccidial - Year-over-year growth 2021-2026 (%)
5.5 Market opportunity by Type
Exhibit 36: Market opportunity by Type ($ million)
6 Customer Landscape
6.1 Customer landscape overview
Exhibit 37: Analysis of price sensitivity, lifecycle, customer purchase basket, adoption rates, and purchase criteria
7 Geographic Landscape
7.1 Geographic segmentation
Exhibit 38: Chart on Market share by geography 2021-2026 (%)
Exhibit 39: Data Table on Market share by geography 2021-2026 (%)
7.2 Geographic comparison
Exhibit 40: Chart on Geographic comparison
Exhibit 41: Data Table on Geographic comparison
7.3 North America - Market size and forecast 2021-2026
Exhibit 42: Chart on North America - Market size and forecast 2021-2026 ($ million)
Exhibit 43: Data Table on North America - Market size and forecast 2021-2026 ($ million)
Exhibit 44: Chart on North America - Year-over-year growth 2021-2026 (%)
Exhibit 45: Data Table on North America - Year-over-year growth 2021-2026 (%)
7.4 Europe - Market size and forecast 2021-2026
Exhibit 46: Chart on Europe - Market size and forecast 2021-2026 ($ million)
Exhibit 47: Data Table on Europe - Market size and forecast 2021-2026 ($ million)
Exhibit 48: Chart on Europe - Year-over-year growth 2021-2026 (%)
Exhibit 49: Data Table on Europe - Year-over-year growth 2021-2026 (%)
7.5 Asia - Market size and forecast 2021-2026
Exhibit 50: Chart on Asia - Market size and forecast 2021-2026 ($ million)
Exhibit 51: Data Table on Asia - Market size and forecast 2021-2026 ($ million)
Exhibit 52: Chart on Asia - Year-over-year growth 2021-2026 (%)
Exhibit 53: Data Table on Asia - Year-over-year growth 2021-2026 (%)
7.6 Rest of World (ROW) - Market size and forecast 2021-2026
Exhibit 54: Chart on Rest of World (ROW) - Market size and forecast 2021-2026 ($ million)
Exhibit 55: Data Table on Rest of World (ROW) - Market size and forecast 2021-2026 ($ million)
Exhibit 56: Chart on Rest of World (ROW) - Year-over-year growth 2021-2026 (%)
Exhibit 57: Data Table on Rest of World (ROW) - Year-over-year growth 2021-2026 (%)
7.7 US - Market size and forecast 2021-2026
Exhibit 58: Chart on US - Market size and forecast 2021-2026 ($ million)
Exhibit 59: Data Table on US - Market size and forecast 2021-2026 ($ million)
Exhibit 60: Chart on US - Year-over-year growth 2021-2026 (%)
Exhibit 61: Data Table on US - Year-over-year growth 2021-2026 (%)
7.8 Germany - Market size and forecast 2021-2026
Exhibit 62: Chart on Germany - Market size and forecast 2021-2026 ($ million)
Exhibit 63: Data Table on Germany - Market size and forecast 2021-2026 ($ million)
Exhibit 64: Chart on Germany - Year-over-year growth 2021-2026 (%)
Exhibit 65: Data Table on Germany - Year-over-year growth 2021-2026 (%)
7.9 UK - Market size and forecast 2021-2026
Exhibit 66: Chart on UK - Market size and forecast 2021-2026 ($ million)
Exhibit 67: Data Table on UK - Market size and forecast 2021-2026 ($ million)
Exhibit 68: Chart on UK - Year-over-year growth 2021-2026 (%)
Exhibit 69: Data Table on UK - Year-over-year growth 2021-2026 (%)
7.10 China - Market size and forecast 2021-2026
Exhibit 70: Chart on China - Market size and forecast 2021-2026 ($ million)
Exhibit 71: Data Table on China - Market size and forecast 2021-2026 ($ million)
Exhibit 72: Chart on China - Year-over-year growth 2021-2026 (%)
Exhibit 73: Data Table on China - Year-over-year growth 2021-2026 (%)
7.11 Japan - Market size and forecast 2021-2026
Exhibit 74: Chart on Japan - Market size and forecast 2021-2026 ($ million)
Exhibit 75: Data Table on Japan - Market size and forecast 2021-2026 ($ million)
Exhibit 76: Chart on Japan - Year-over-year growth 2021-2026 (%)
Exhibit 77: Data Table on Japan - Year-over-year growth 2021-2026 (%)
7.12 Market opportunity by geography
Exhibit 78: Market opportunity by geography ($ million)
8 Drivers, Challenges, and Trends
8.1 Market drivers
8.2 Market challenges
8.3 Impact of drivers and challenges
Exhibit 79: Impact of drivers and challenges in 2021 and 2026
8.4 Market trends
9 Vendor Landscape
9.1 Overview
9.2 Vendor landscape
Exhibit 80: Overview on Criticality of inputs and Factors of differentiation
9.3 Landscape disruption
Exhibit 81: Overview on factors of disruption
9.4 Industry risks
Exhibit 82: Impact of key risks on business
10 Vendor Analysis
10.1 Vendors covered
Exhibit 83: Vendors covered
10.2 Market positioning of vendors
Exhibit 84: Matrix on vendor position and classification
10.3 Bayer AG
Exhibit 85: Bayer AG - Overview
Exhibit 86: Bayer AG - Business segments
Exhibit 87: Bayer AG - Key offerings
Exhibit 88: Bayer AG - Segment focus
Exhibit 89: Boehringer Ingelheim International GmbH - Overview
Exhibit 90: Boehringer Ingelheim International GmbH - Business segments
Exhibit 91: Boehringer Ingelheim International GmbH - Key news
Exhibit 92: Boehringer Ingelheim International GmbH - Key offerings
Exhibit 93: Boehringer Ingelheim International GmbH - Segment focus
10.5 Ceva Sante Animale
Exhibit 94: Ceva Sante Animale - Overview
Exhibit 95: Ceva Sante Animale - Product / Service
Exhibit 96: Ceva Sante Animale - Key offerings
Exhibit 97: Elanco Animal Health Inc. - Overview
Exhibit 98: Elanco Animal Health Inc. - Product / Service
Exhibit 99: Elanco Animal Health Inc. - Key offerings
10.7 Impextraco NV
Exhibit 100: Impextraco NV - Overview
Exhibit 101: Impextraco NV - Product / Service
Exhibit 102: Impextraco NV - Key offerings
10.8 LABORATORIOS HIPRA SA
Exhibit 103: LABORATORIOS HIPRA SA - Overview
Exhibit 104: LABORATORIOS HIPRA SA - Product / Service
Exhibit 105: LABORATORIOS HIPRA SA - Key offerings
10.9 Merck and Co. Inc.
Exhibit 106: Merck and Co. Inc. - Overview
Exhibit 107: Merck and Co. Inc. - Business segments
Exhibit 108: Merck and Co. Inc. - Key news
Exhibit 109: Merck and Co. Inc. - Key offerings
Exhibit 110: Merck and Co. Inc. - Segment focus
10.10 Novartis AG
Exhibit 111: Novartis AG - Overview
Exhibit 112: Novartis AG - Business segments
Exhibit 113: Novartis AG - Key offerings
Exhibit 114: Novartis AG - Segment focus
10.11 Virbac
Exhibit 115: Virbac - Overview
Exhibit 116: Virbac - Business segments
Exhibit 117: Virbac - Key offerings
Exhibit 118: Virbac - Segment focus
10.12 Zoetis Inc.
Exhibit 119: Zoetis Inc. - Overview
Exhibit 120: Zoetis Inc. - Business segments
Exhibit 121: Zoetis Inc. - Key news
Exhibit 122: Zoetis Inc. - Key offerings
Exhibit 123: Zoetis Inc. - Segment focus
11 Appendix
11.1 Scope of the report
11.2 Inclusions and exclusions checklist
Exhibit 124: Inclusions checklist
Exhibit 125: Exclusions checklist
11.3 Currency conversion rates for US$
Exhibit 126: Currency conversion rates for US$
11.4 Research methodology
Exhibit 127: Research methodology
Exhibit 128: Validation techniques employed for market sizing
Exhibit 129: Information sources
11.5 List of abbreviations
Exhibit 130: List of abbreviations
About Us
Technavio is a leading global technology research and advisory company. Their research and analysis focus on emerging market trends and provide actionable insights to help businesses identify market opportunities and develop effective strategies to optimize their market positions. With over 500 specialized analysts, Technavio's report library consists of more than 17,000 reports and counting, covering 800 technologies, spanning 50 countries. Their client base consists of enterprises of all sizes, including more than 100 Fortune 500 companies. This growing client base relies on Technavio's comprehensive coverage, extensive research, and actionable market insights to identify opportunities in existing and potential markets and assess their competitive positions within changing market scenarios.
Contact
Technavio Research
Jesse Maida
Media & Marketing Executive
US: +1 844 364 1100
UK: +44 203 893 3200
Email: [email protected]
Website: www.technavio.com/
SOURCE Technavio
更多内容,请访问原始网站
文中所述内容并不反映新药情报库及其所属公司任何意见及观点,如有版权侵扰或错误之处,请及时联系我们,我们会在24小时内配合处理。
靶点
-药物
-生物医药百科问答
全新生物医药AI Agent 覆盖科研全链路,让突破性发现快人一步


立即开始免费试用!
智慧芽新药情报库是智慧芽专为生命科学人士构建的基于AI的创新药情报平台,助您全方位提升您的研发与决策效率。
立即开始数据试用!
智慧芽新药库数据也通过智慧芽数据服务平台,以API或者数据包形式对外开放,助您更加充分利用智慧芽新药情报信息。