预约演示
更新于:2026-10-18

National Institutes For Quantum Science &Technology
更新于:2026-10-18
概览
标签
肿瘤
神经系统疾病
消化系统疾病
诊断用放射药物
小分子化药
抗体偶联核素
疾病领域得分
一眼洞穿机构专注的疾病领域

技术平台
公司药物应用最多的技术
靶点
公司最常开发的靶点
关联
靶点 |
作用机制 |
在研机构 |
原研机构 |
在研适应症 |
非在研适应症 |
最高研发阶段 |
首次获批国家/地区 |
首次获批日期 |
靶点 |
作用机制 |
在研机构 |
原研机构 |
在研适应症 |
非在研适应症 |
最高研发阶段 |
首次获批国家/地区 |
首次获批日期 |
靶点 |
作用机制 |
在研机构 |
原研机构 |
在研适应症 |
非在研适应症 |
最高研发阶段 |
首次获批国家/地区 |
首次获批日期 |
JPRN-UMIN000062921
Study of Associations Between Dementia-Related Blood Biomarkers Measured Using General-Purpose Immunoassay Platforms and Existing Clinical Data
JPRN-UMIN000062971
MRI-Based Evaluation of the Descending Pain Modulation System Using Proton Magnetic Resonance Spectroscopy and Resting-State Functional MRI in Healthy Adults
JPRN-UMIN000061819
Evaluation of Radiation Exposure among Healthcare Workers Following the Introduction of an AI-Based Radiation Entry and Exit Management System
100 项与 National Institutes For Quantum Science &Technology 相关的临床结果
登录后查看更多信息
登录后查看更多信息
2026-10-03INTERNATIONAL JOURNAL OF RADIATION BIOLOGY
Cellular effects induced by insoluble radioactive cesium-bearing microparticles derived from the Fukushima Daiichi nuclear power plant accident
Article
作者: Endo, Satoru ; Inaba, Yohei ; Manabe, Kentaro ; Yamada, Yutaka ; Fukumoto, Manabu ; Chida, Koichi ; Ninomiya, Kazuhiko ; Suzuki, Masatoshi
PURPOSE:
Radioactive cesium-bearing microparticles (CsMPs) were generated by the Fukushima Daiichi nuclear power plant (FNPP) accident. Despite their low radioactivity, CsMPs are insoluble and their dose distribution to the surrounding tissues is non-uniform, raising concerns about their biological effects. In this study, we investigated the cellular effects of CsMPs collected from soil contaminated by the FNPP accident.
MATERIALS AND METHODS:
Each three CsMP was placed on immortalized normal human epithelial cells (hTERT-RPE1) and co-incubated for up to 72 h. Induction of DNA double-strand breaks (DSBs) and cell proliferation were analyzed in relation to the distance from a CsMP. In addition, gene expression analysis was performed after cells were co-incubated with a CsMP for 24 h.
RESULTS:
CsMP-1, which contains 1911 Bq of radioactive Cs (134Cs + 137Cs), induced DSBs and growth arrest in adjacent cells at high radiation doses. DSBs were also induced in cells 1 cm distant from CsMP-1; however, these cells maintained their ability to proliferate. CsMP-1 also induced the expression of interferon-stimulated genes (ISGs) involved in inflammatory responses and stress tolerance in cells proximal to CsMP-1. Neither a non-radioactive mock particle nor CsMP-3, containing 7.6 Bq of radioactive Cs, influenced DSB induction, even in the adjacent cells.
CONCLUSIONS:
Our study suggests that factors secreted by cells that undergo premature senescence following high-dose exposure to CsMP-1 may confer a growth advantage to cells experiencing DSBs at a distance from the CsMP.
2026-08-01ANNALS OF NUCLEAR MEDICINE
Error analysis of cerebral blood flow and oxygen metabolism in three-dimensional 15O-gas positron emission tomography acquisition
Article
作者: Senda, Michio ; Ikari, Yasuhiko ; Ibaraki, Takeharu ; Akamatsu, Go ; Matsumoto, Keiichi ; Yamane, Tomohiko ; Shimizu, Keiji ; Sasaki, Masahiro ; Omasa, Wataru
OBJECTIVE: 15O-gas positron emission tomography (PET), which enables quantitative assessment of cerebral blood flow and oxygen metabolism, is widely performed to diagnose cerebrovascular disorders and evaluate therapeutic effects. While the autoradiography method offers high quantitative accuracy, short restraint time, and reduced radiation exposure as advantages over the steady-state method, it requires several radiation detectors in addition to a PET scanner. In contrast, PET/CT systems optimized for whole-body tumor imaging with 18F-2-deoxy-2-fluoro-D-glucose have high sensitivity, and recent regulatory developments have facilitated active efforts to reduce radiation dose through low-dose administration. Dose reduction is desirable for 15O-gas PET, which involves the inhalation of relatively high radioactivity concentrations; nonetheless, obtaining an arterial input function with sufficient statistical precision is challenging under low-dose conditions. In this study, we aimed to investigate how variations in the crosscalibration factor between the dose calibrator and the continuous blood-sampling system (CCFcbs), as well as the magnitude of statistical noise in the arterial input function measured using the continuous blood-sampling system (aTACnoise), affect the quantitative parameters of cerebral blood flow and oxygen metabolism images. METHODS: Ten patients with cerebrovascular disease (six men and four women) with a median age of 61.5 years were enrolled. The effects of CCFcbs and aTACnoise on quantitative cerebral hemodynamic and metabolic parameters were evaluated. RESULTS: Cerebral blood flow (CBF) and cerebral metabolic rate of oxygen (CMRO2) showed an inverse correlation with CCFcbs; however, the oxygen extraction fraction (OEF) was minimally affected. aTACnoise had a greater impact on OEF and CMRO2 than on CBF, and the variability increased as statistical precision decreased. CONCLUSIONS: A highly sensitive continuous blood-sampling system or technical improvements that enable higher-sensitivity measurements are crucial for obtaining an arterial input function with sufficient statistical precision. Furthermore, standardization of the calibration procedure is essential.
2026-08-01ACTA PSYCHOLOGICA
Independent and interactive associations of general expectation and optimistic prediction with hopelessness
Article
作者: Yamada, Makiko ; Isato, Ayako
While optimistic and pessimistic predictions are distinct dimensions, their combined patterns and longitudinal associations with mental health remain underexplored. This study examined two indices of future thinking: optimistic prediction (OP), defined as the difference in likelihoods between positive and negative events, and general expectation (GE), the average of these likelihoods. Because various combinations of OP and GE are theoretically possible, we adopted cluster analysis to determine the actual prediction patterns found in our data. An online survey was conducted involving 888 participants at Time 1, of whom 449 completed an 8-month follow-up at Time 2. The participants provided likelihood predictions for 12 positive and 12 negative events across three temporal horizons: 1 month, 1 year, and 10 years. Cluster analysis identified four patterns: positive-dominant, high-certainty, low-certainty, and negative-dominant. Dependent variables, including hopelessness, depression, life satisfaction, and trait anxiety, were examined across these patterns. Chi-square tests showed that these patterns remained significantly stable over 8 months. In addition, moderated regression analyses and structural equation modeling demonstrated that GE accounts for unique variance in hopelessness independently of OP. Furthermore, GE × OP interaction revealed that low GE strengthens the association between low OP and hopelessness. Cross-lagged models revealed a stable relationship between future expectations and hopelessness over time, suggesting that these constructs are interrelated. Specifically, the low-certainty pattern (low GE) was associated with greater hopelessness, comparable to the negative-dominant pattern. These findings suggest that clinical interventions may benefit from being tailored to individuals' prediction profiles.
100 项与 National Institutes For Quantum Science &Technology 相关的药物交易
登录后查看更多信息
100 项与 National Institutes For Quantum Science &Technology 相关的转化医学
登录后查看更多信息
组织架构
使用我们的机构树数据加速您的研究。
登录
或
管线布局
2026年10月23日管线快照
管线布局中药物为当前组织机构及其子机构作为药物机构进行统计,早期临床1期并入临床1期,临床1/2期并入临床2期,临床2/3期并入临床3期
临床前
13
1
其他
登录后查看更多信息
当前项目
登录后查看更多信息
药物交易
使用我们的药物交易数据加速您的研究。
登录
或
转化医学
使用我们的转化医学数据加速您的研究。
登录
或
营收
使用 Synapse 探索超过 36 万个组织的财务状况。
登录
或
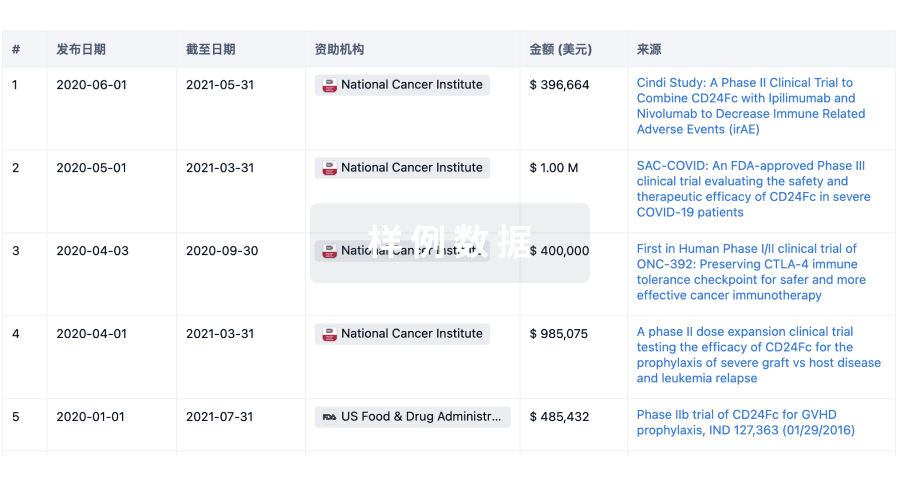
科研基金(NIH)
访问超过 200 万项资助和基金信息,以提升您的研究之旅。
登录
或
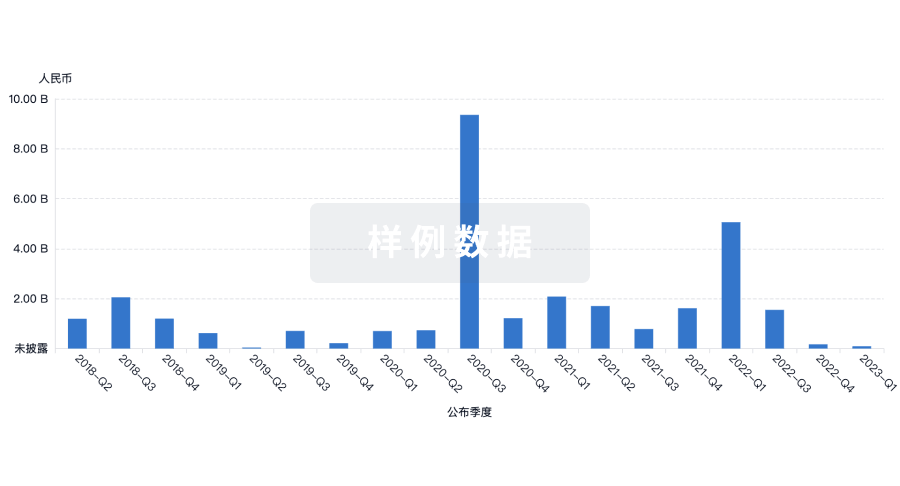
投资
深入了解从初创企业到成熟企业的最新公司投资动态。
登录
或
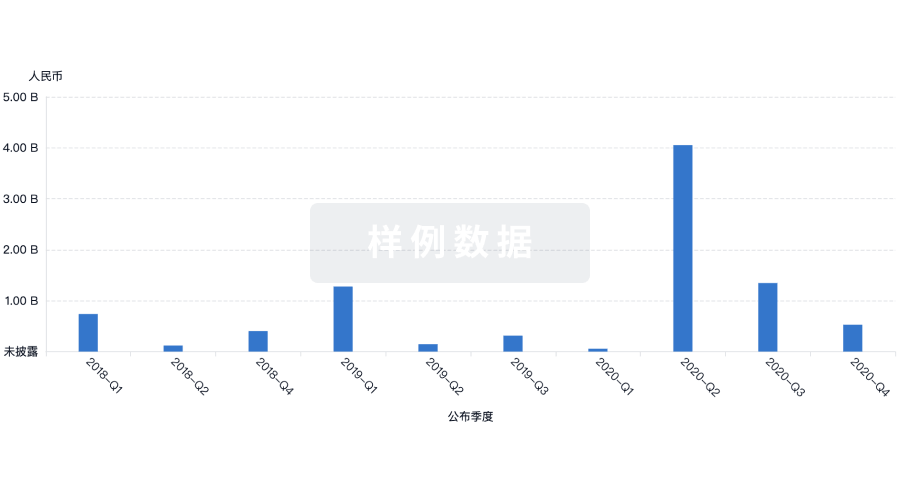
融资
发掘融资趋势以验证和推进您的投资机会。
登录
或
提出任何生物医药研究问题
让每一步生物医药决策都精准制胜
基于十亿级生物数据与全球情报的精准 AI,赋能早期药物发现
立即开始免费试用!
智慧芽新药情报库是智慧芽专为生命科学人士构建的基于AI的创新药情报平台,助您全方位提升您的研发与决策效率。
立即接入生物医药数据包
智慧芽新药库数据也通过智慧芽开放平台,以MCP或API服务形式对外开放。立即使用我们的MCP服务定制您的LLM智能体。
生物序列数据库
生物药研发创新
免费使用
化学结构数据库
小分子化药研发创新
免费使用