预约演示
更新于:2026-05-25
Easywell Biomedicals, Inc.
更新于:2026-05-25
概览
标签
神经系统疾病
呼吸系统疾病
感染
化学药

关联
4
项与 易威生医科技股份有限公司 相关的药物靶点- |
作用机制- |
在研机构 |
原研机构 |
在研适应症 |
非在研适应症- |
最高研发阶段临床前 |
首次获批国家/地区- |
首次获批日期- |
靶点- |
作用机制- |
在研机构 |
原研机构 |
在研适应症 |
非在研适应症- |
最高研发阶段临床前 |
首次获批国家/地区- |
首次获批日期- |
靶点- |
作用机制- |
在研机构 |
原研机构 |
在研适应症- |
非在研适应症- |
最高研发阶段临床前 |
首次获批国家/地区- |
首次获批日期- |
100 项与 易威生医科技股份有限公司 相关的临床结果
登录后查看更多信息
0 项与 易威生医科技股份有限公司 相关的专利(医药)
登录后查看更多信息
3
项与 易威生医科技股份有限公司 相关的新闻(医药)2024-08-06
Easywell Biomedicals, Inc. (TPEX:1799) signed a letter of intent to acquire 40% stake in Jiangsu Huahan Pharmaceutical Technology Co.,Ltd. from Nanjing Huaxun Intellectual Property Consulting Co., Ltd. for CNY 37.5 million on August 7, 2024. A cash consideration of CNY 37.5 million will be paid by Easywell Biomedicals, Inc. For the period ending December 31, 2023, Jiangsu Huahan Pharmaceutical Technology Co.,Ltd. reported net loss of CNY 3.18 million. As of December 31, 2023, Jiangsu Huahan Pharmaceutical Technology Co.,Ltd. reported net liabilities of CNY 2.25 million.
并购财报
2023-11-06
·药智网
2023年10月27日,国家药监局网站显示,江苏华瀚医药科技有限公司(以下简称“华瀚医药”)申报的沙库巴曲缬沙坦钠片(商标名:悦欣妥®)已获批上市。图1. 悦欣妥®沙库巴曲缬沙坦钠片获批图片来源:国家药监局官网截图据了解,华瀚医药的悦欣妥®已获得诺华原研专利的完整授权,可以在原研专利保护期内提前合法上市。悦欣妥®与原研药物具有相同的晶型结构,其获批上市将为中国心衰和高血压患者提供高品质且更具性价比的药物选择,有助于减轻患者经济负担、缓解国家医保压力,并提高一线创新药的可及性。心衰和高血压一线用药市场前景广阔沙库巴曲缬沙坦钠片在治疗心衰和高血压上展现出明确的疗效和良好的安全性,得到了美国心脏病学院(ACC)、美国心脏协会(AHA)、美国心衰学会(HFSA)和欧洲心脏病学会(ESC)等权威学会的推荐。在中国,沙库巴曲缬沙坦钠片被《心衰指南》推荐为能显著降低心衰患者死亡率的首选药物,并被《2023年临床指南》列为高血压的一线治疗药物。根据诺华公布的财报,自2015年上市以来,沙库巴曲缬沙坦钠片的全球销售额持续增长。2022年,其全球销售额达到46.44亿美元,同比增长37%。2023年上半年,销售额为29.15亿美元,同比增长35%。图2. Entresto 2023上半年销售数据图片来源:诺华2023H1财报悦欣妥®的获批上市将为中国广大心衰和高血压患者带来高品质且更具性价比的药物选择,有助于减轻患者经济负担、缓解国家医保压力,提高一线用药的可及性。悦欣妥®获得原研专利许可可合法提前上市沙库巴曲缬沙坦钠片是诺华研发的治疗心衰和高血压的创新药物。该药物链接的中国专利(专利号:ZL200680001733.0及ZL201210191052.2)的保护期将持续到2026年11月。华瀚医药已获得诺华在中国的两项专利的完整授权,因此华瀚医药开发的4类仿制药沙库巴曲缬沙坦钠片(商标名:悦欣妥®)可以在专利保护期内在中国合法上市销售。图3. 悦欣妥®沙库巴曲缬沙坦钠片产品包装,仅供参考,以上市包装为准图片来源:华瀚医药与原研药物晶型完全一致药效得到临床验证沙库巴曲缬沙坦钠片的创新性之一是其具有特定的化学和晶体结构。从分子结构上看,其活性成分LCZ696是由沙库巴曲与缬沙坦按1:1摩尔比例结合而成的盐复合物晶体,每个药物分子含有2.5个结晶水。作为一种具有特定化学组成和稳定晶型的超分子复合物,这种共晶结构不仅确保了片剂的储存稳定性,还增强了缬沙坦在人体内的生物利用度。 图4. 沙库巴曲与缬沙坦钠片分子式图片来源:FDA官网悦欣妥®晶型结构和诺华的参比制剂一致。其独特的共晶设计已被多个跨国临床试验验证疗效,并被医学界广泛推崇用于心血管事件的预防及治疗。在国际医药法规逐步重视原料药一致性(API sameness)当前,与参比制剂晶型一致的悦欣妥®,将成为医患双方放心的新选择。悦欣妥®的成功关键:国际化和知识产权保护沙库巴曲缬沙坦钠片具有巨大的药物价值,成为国内众多药企竞争的焦点。截止到目前,华瀚医药是获得原研完整许可、可以在原研专利保护期内合法提前上市的药企。华瀚医药之所以能取得这样的成功,与其国际化的背景、全球化的视野及资源有关。公开资料显示,华瀚医药成立于2019年10月24日,其主要股东为中国台湾上市公司易威生医科技股份有限公司(简称“易威生医”)。易威生医是一家在全球布局的生物科技公司。易威生医的美国子公司完成了悦欣妥®的研发。随后,华瀚医药在中国完成了技术转移、生产和商业化。此外,悦欣妥®能够合法提前上市,可追溯至2018年8月,南京华讯知识产权顾问有限公司与诺华在专利无效诉讼中达成和解协议,获得“沙库巴曲缬沙坦钠片”在国内提前上市的许可,并独家转许可给予华瀚医药,使其成为国内合法取得原研许可上市销售的仿制药。2021年7月,《药品专利纠纷早期解决机制实施办法》颁布,标志着我国“专利链接制度”正式落地。2023年9月,国家知识产权局发布通知:“严格落实相关执行措施,对医药集中采购、电子商务等领域行政裁决认定侵权行为成立的,会同相关部门依法依规采取不予挂网或撤网、删除链接等措施,及时制止侵权行为。”随着中国医药市场在知识产权保护方面的法律制度日益完善,悦欣妥®的上市无疑开创了中国患者更早获得创新药物的新模式。据不完全统计,2022年国内生物制药企业披露的许可引进(License-in)交易、对外许可(License-out)交易、本土许可交易分别为90笔、52笔以及49笔,交易总额高达361.5亿美元。展望未来,具有国际化平台和前瞻性产品的药企或将主导全球市场竞争。继悦欣妥®的获批上市,华瀚医药凭借集团的资源,继续加大研发投入,引进更多高质量、高技术含量的医药品种进入中国市场,为患者提供更多优质的治疗选择。来源 | 华瀚医药(药智网获取授权转载)责任编辑 | 八角声明:本文系药智网转载内容,图片、文字版权归原作者所有,转载目的在于传递更多信息,并不代表本平台观点。如涉及作品内容、版权和其它问题,请在本平台留言,我们将在第一时间删除。商务合作 | 王存星 19922864877(同微信) 阅读原文,是受欢迎的文章哦
专利到期AHA会议财报
2021-07-12
New York, July 12, 2021 (GLOBE NEWSWIRE) -- Reportlinker.com announces the release of the report "Global Medical Thermometers Industry" - 9 Billion in the year 2020, is projected to reach a revised size of US$3.2 Billion by 2027, growing at a CAGR of 8.2% over the analysis period 2020-2027. Digital, one of the segments analyzed in the report, is projected to record a 7.2% CAGR and reach US$1.7 Billion by the end of the analysis period. After an early analysis of the business implications of the pandemic and its induced economic crisis, growth in the Infrared segment is readjusted to a revised 9.6% CAGR for the next 7-year period. The U.S. Market is Estimated at $635.7 Million, While China is Forecast to Grow at 8.3% CAGR The Medical Thermometers market in the U.S. is estimated at US$635.7 Million in the year 2020. China, the world`s second largest economy, is forecast to reach a projected market size of US$331.8 Million by the year 2027 trailing a CAGR of 8.3% over the analysis period 2020 to 2027. Among the other noteworthy geographic markets are Japan and Canada, each forecast to grow at 6.4% and 7.5% respectively over the 2020-2027 period. Within Europe, Germany is forecast to grow at approximately 8% CAGR. Other Product Types Segment to Record 5.3% CAGR In the global Other Product Types segment, USA, Canada, Japan, China and Europe will drive the 5.2% CAGR estimated for this segment. These regional markets accounting for a combined market size of US$57.4 Million in the year 2020 will reach a projected size of US$81.7 Million by the close of the analysis period. China will remain among the fastest growing in this cluster of regional markets. Led by countries such as Australia, India, and South Korea, the market in Asia-Pacific is forecast to reach US$170.2 Million by the year 2027, while Latin America will expand at a 5.8% CAGR through the analysis period. Select Competitors (Total 185 Featured)
Read the full report: I. METHODOLOGY II. EXECUTIVE SUMMARY 1. MARKET OVERVIEW Influencer Market Insights World Market Trajectories Increasing Need to Accurately Measure Body Temperature in Covid-19 Buoys Medical Thermometers Market EXHIBIT 1: Total Number of COVID-19 Cases and Deaths Worldwide EXHIBIT 2: Total Global COVID-19 Cases Distribution (in Percentage) by Country EXHIBIT 3: COVID-19 Cases Worldwide: Total Cases, Deaths, Cases Per Million Population and Deaths Per Million Population for Top Nations (As of 23rd April 2020) Body Temperature Checking Takes Precedence in Covid-19 and Other Infections Digital Thermometers Dominate the Medical Thermometers Market Infrared Thermometers Witness Rapid Growth EXHIBIT 4: No. of Cases and Deaths Due to Ebola Virus Disease (EVD) Worldwide: 2014 to June 2017 The US and Europe Lead the Global Medical Thermometers Market Asia-Pacific Witnesses Rapid Growth Competitive Scenario Recent Market Activity 2. FOCUS ON SELECT PLAYERS A&D Medical (USA) American Diagnostic Corporation (USA) Briggs Healthcare (USA) Cardinal Health, Inc. (USA) Easywell Biomedicals, Inc. (Taiwan) Exergen Corporation (USA) Geratherm Medical AG (Germany) Hicks Thermometers (India) Limited (India) Kaz USA, Inc. (USA) Microlife Corporation (Taiwan) Omron Healthcare, Inc. (Japan) RG Medical Diagnostics (USA) Terumo Corporation (Japan) Welch Allyn, Inc. (USA) 3. MARKET TRENDS & DRIVERS Non-Contact Thermometers Score over Contact Thermometers Employers Focus on Temperature Screening at Workplaces to Boost Thermometer Demand Regulatory Guidance on Temperature Screening at Workplaces United States Canada Europe Asia-Pacific Parks & Attractions Brace Temperature Screening for Guests amidst COVID-19 Pandemic Amazon to Start Temperature Screening of Warehouse Workers amidst Growing Unrest about COVID-19 Exposure Governments and Businesses Use Thermometer Guns to Screen People for COVID-19 Thermal Camera Makers Grapple with Surging Demand amidst Increasing Focus on Temperature Checks China Installs Facial Recognition Thermometers in Buses to Detect Symptoms of COVID-19 Infection in Passengers Thermometer Makers Introduce Innovative Solutions to Support Fight against COVID-19 Vendors Offer Advanced Products for Temperature Screening Select Launches and Innovations of Medical Thermometers in Recent Years Healthcare Agencies Betting on Digital Smart Thermometers to Identify COVID-19 Hotspots Smart Thermometers - A Fast Evolving Market Wireless Thermometers - Viable Solution for Undisturbed Temperature Monitoring Nanoscale Thermometer - The Next Frontier in Technology Advancement Smart Thermometers to Aid in Flu Forecasting Wearable Thermometers - An Ideal Solution for Infants and Neonates No-Fuss Infant Thermometers - An Expanding Market Companies Explore the Body Temperature Monitoring Pills Market Digital Thermometers Continue Steady Growth EXHIBIT 5: Maximum Error Shown by Mercury Thermometers and Digital Thermometers over a Temperature Range Challenges Associated with Digital Thermometers Thermometers in Various Hues Attract Customer Attention Issues and Concerns Mercury Thermometers Near an End Ban on the Use of Mercury Thermometers Accuracy Concerns of Infrared Thermometers MACRO DRIVERS Rise in Number of Infectious Diseases to Drive the Market for Medical Thermometers EXHIBIT 6: Global Number of Deaths Caused Due to Communicable Diseases (In 000s) Aging Population: A Strong Growth Driver EXHIBIT 7: Global Aging Population in Select Regions/Countries: Population of 60+ Individuals in ?000s and as a Percentage of Total Population for 2015 & 2050 Increasing Pediatric Population Offers Growth Opportunities for Manufacturers EXHIBIT 8: Global New Births (in Millions) per Annum by Geographic Region EXHIBIT 9: Global Population of Children Between 0-4 years: (2015 & 2020P) Exponential Increase in Urban Population to Drive Market Expansion EXHIBIT 10: Total Population Worldwide by Urban and Rural Population in Thousands: 1950-2050P Increasing Healthcare Expenditure to Foster Market Growth EXHIBIT 11: World Healthcare Expenditure (In US$ Billion) for the Years 2017-2023 4. GLOBAL MARKET PERSPECTIVE Table 1: World Current & Future Analysis for Medical Thermometers by Geographic Region - USA, Canada, Japan, China, Europe, Asia-Pacific, Latin America, Middle East and Africa Markets - Independent Analysis of Annual Sales in US$ Thousand for Years 2020 through 2027 and % CAGR Table 2: World Historic Review for Medical Thermometers by Geographic Region - USA, Canada, Japan, China, Europe, Asia-Pacific, Latin America, Middle East and Africa Markets - Independent Analysis of Annual Sales in US$ Thousand for Years 2012 through 2019 and % CAGR Table 3: World 15-Year Perspective for Medical Thermometers by Geographic Region - Percentage Breakdown of Value Sales for USA, Canada, Japan, China, Europe, Asia-Pacific, Latin America, Middle East and Africa Markets for Years 2012, 2020 & 2027 Table 4: World Current & Future Analysis for Digital by Geographic Region - USA, Canada, Japan, China, Europe, Asia-Pacific, Latin America, Middle East and Africa Markets - Independent Analysis of Annual Sales in US$ Thousand for Years 2020 through 2027 and % CAGR Table 5: World Historic Review for Digital by Geographic Region - USA, Canada, Japan, China, Europe, Asia-Pacific, Latin America, Middle East and Africa Markets - Independent Analysis of Annual Sales in US$ Thousand for Years 2012 through 2019 and % CAGR Table 6: World 15-Year Perspective for Digital by Geographic Region - Percentage Breakdown of Value Sales for USA, Canada, Japan, China, Europe, Asia-Pacific, Latin America, Middle East and Africa for Years 2012, 2020 & 2027 Table 7: World Current & Future Analysis for Infrared by Geographic Region - USA, Canada, Japan, China, Europe, Asia-Pacific, Latin America, Middle East and Africa Markets - Independent Analysis of Annual Sales in US$ Thousand for Years 2020 through 2027 and % CAGR Table 8: World Historic Review for Infrared by Geographic Region - USA, Canada, Japan, China, Europe, Asia-Pacific, Latin America, Middle East and Africa Markets - Independent Analysis of Annual Sales in US$ Thousand for Years 2012 through 2019 and % CAGR Table 9: World 15-Year Perspective for Infrared by Geographic Region - Percentage Breakdown of Value Sales for USA, Canada, Japan, China, Europe, Asia-Pacific, Latin America, Middle East and Africa for Years 2012, 2020 & 2027 Table 10: World Current & Future Analysis for Other Product Types by Geographic Region - USA, Canada, Japan, China, Europe, Asia-Pacific, Latin America, Middle East and Africa Markets - Independent Analysis of Annual Sales in US$ Thousand for Years 2020 through 2027 and % CAGR Table 11: World Historic Review for Other Product Types by Geographic Region - USA, Canada, Japan, China, Europe, Asia-Pacific, Latin America, Middle East and Africa Markets - Independent Analysis of Annual Sales in US$ Thousand for Years 2012 through 2019 and % CAGR Table 12: World 15-Year Perspective for Other Product Types by Geographic Region - Percentage Breakdown of Value Sales for USA, Canada, Japan, China, Europe, Asia-Pacific, Latin America, Middle East and Africa for Years 2012, 2020 & 2027 Table 13: World Current & Future Analysis for Hospitals & Clinics by Geographic Region - USA, Canada, Japan, China, Europe, Asia-Pacific, Latin America, Middle East and Africa Markets - Independent Analysis of Annual Sales in US$ Thousand for Years 2020 through 2027 and % CAGR Table 14: World Historic Review for Hospitals & Clinics by Geographic Region - USA, Canada, Japan, China, Europe, Asia-Pacific, Latin America, Middle East and Africa Markets - Independent Analysis of Annual Sales in US$ Thousand for Years 2012 through 2019 and % CAGR Table 15: World 15-Year Perspective for Hospitals & Clinics by Geographic Region - Percentage Breakdown of Value Sales for USA, Canada, Japan, China, Europe, Asia-Pacific, Latin America, Middle East and Africa for Years 2012, 2020 & 2027 Table 16: World Current & Future Analysis for Home Care by Geographic Region - USA, Canada, Japan, China, Europe, Asia-Pacific, Latin America, Middle East and Africa Markets - Independent Analysis of Annual Sales in US$ Thousand for Years 2020 through 2027 and % CAGR Table 17: World Historic Review for Home Care by Geographic Region - USA, Canada, Japan, China, Europe, Asia-Pacific, Latin America, Middle East and Africa Markets - Independent Analysis of Annual Sales in US$ Thousand for Years 2012 through 2019 and % CAGR Table 18: World 15-Year Perspective for Home Care by Geographic Region - Percentage Breakdown of Value Sales for USA, Canada, Japan, China, Europe, Asia-Pacific, Latin America, Middle East and Africa for Years 2012, 2020 & 2027 Table 19: World Current & Future Analysis for Other Applications by Geographic Region - USA, Canada, Japan, China, Europe, Asia-Pacific, Latin America, Middle East and Africa Markets - Independent Analysis of Annual Sales in US$ Thousand for Years 2020 through 2027 and % CAGR Table 20: World Historic Review for Other Applications by Geographic Region - USA, Canada, Japan, China, Europe, Asia-Pacific, Latin America, Middle East and Africa Markets - Independent Analysis of Annual Sales in US$ Thousand for Years 2012 through 2019 and % CAGR Table 21: World 15-Year Perspective for Other Applications by Geographic Region - Percentage Breakdown of Value Sales for USA, Canada, Japan, China, Europe, Asia-Pacific, Latin America, Middle East and Africa for Years 2012, 2020 & 2027 III. MARKET ANALYSIS UNITED STATES Table 22: USA Current & Future Analysis for Medical Thermometers by Product Type - Digital, Infrared and Other Product Types - Independent Analysis of Annual Sales in US$ Thousand for the Years 2020 through 2027 and % CAGR Table 23: USA Historic Review for Medical Thermometers by Product Type - Digital, Infrared and Other Product Types Markets - Independent Analysis of Annual Sales in US$ Thousand for Years 2012 through 2019 and % CAGR Table 24: USA 15-Year Perspective for Medical Thermometers by Product Type - Percentage Breakdown of Value Sales for Digital, Infrared and Other Product Types for the Years 2012, 2020 & 2027 Table 25: USA Current & Future Analysis for Medical Thermometers by Application - Hospitals & Clinics, Home Care and Other Applications - Independent Analysis of Annual Sales in US$ Thousand for the Years 2020 through 2027 and % CAGR Table 26: USA Historic Review for Medical Thermometers by Application - Hospitals & Clinics, Home Care and Other Applications Markets - Independent Analysis of Annual Sales in US$ Thousand for Years 2012 through 2019 and % CAGR Table 27: USA 15-Year Perspective for Medical Thermometers by Application - Percentage Breakdown of Value Sales for Hospitals & Clinics, Home Care and Other Applications for the Years 2012, 2020 & 2027 COVID-19 Outbreak Makes Medical Thermometers Disappear from US Retail Shelves Leading US Employers Deploying Infrared Thermometers for COVID -19 Detection CDC?s Recommendations for Critical Workers Who May Have Been Exposed to COVID-19 Digital Thermometers Replace Mercury Thermometers Infrared Thermometers Register Healthy Growth Market Trends & Issues Epidemics Drive Thermometer Sales Home Healthcare - Major Revenue Generating Segment Aging Baby Boomer Push Growth EXHIBIT 12: US Resident Population by Age Group (2016-2060) (in Million) EXHIBIT 13: Percentage Breakdown of US Resident Population by Age Group (2016-2060) CANADA Table 28: Canada Current & Future Analysis for Medical Thermometers by Product Type - Digital, Infrared and Other Product Types - Independent Analysis of Annual Sales in US$ Thousand for the Years 2020 through 2027 and % CAGR Table 29: Canada Historic Review for Medical Thermometers by Product Type - Digital, Infrared and Other Product Types Markets - Independent Analysis of Annual Sales in US$ Thousand for Years 2012 through 2019 and % CAGR Table 30: Canada 15-Year Perspective for Medical Thermometers by Product Type - Percentage Breakdown of Value Sales for Digital, Infrared and Other Product Types for the Years 2012, 2020 & 2027 Table 31: Canada Current & Future Analysis for Medical Thermometers by Application - Hospitals & Clinics, Home Care and Other Applications - Independent Analysis of Annual Sales in US$ Thousand for the Years 2020 through 2027 and % CAGR Table 32: Canada Historic Review for Medical Thermometers by Application - Hospitals & Clinics, Home Care and Other Applications Markets - Independent Analysis of Annual Sales in US$ Thousand for Years 2012 through 2019 and % CAGR Table 33: Canada 15-Year Perspective for Medical Thermometers by Application - Percentage Breakdown of Value Sales for Hospitals & Clinics, Home Care and Other Applications for the Years 2012, 2020 & 2027 JAPAN Table 34: Japan Current & Future Analysis for Medical Thermometers by Product Type - Digital, Infrared and Other Product Types - Independent Analysis of Annual Sales in US$ Thousand for the Years 2020 through 2027 and % CAGR Table 35: Japan Historic Review for Medical Thermometers by Product Type - Digital, Infrared and Other Product Types Markets - Independent Analysis of Annual Sales in US$ Thousand for Years 2012 through 2019 and % CAGR Table 36: Japan 15-Year Perspective for Medical Thermometers by Product Type - Percentage Breakdown of Value Sales for Digital, Infrared and Other Product Types for the Years 2012, 2020 & 2027 Table 37: Japan Current & Future Analysis for Medical Thermometers by Application - Hospitals & Clinics, Home Care and Other Applications - Independent Analysis of Annual Sales in US$ Thousand for the Years 2020 through 2027 and % CAGR Table 38: Japan Historic Review for Medical Thermometers by Application - Hospitals & Clinics, Home Care and Other Applications Markets - Independent Analysis of Annual Sales in US$ Thousand for Years 2012 through 2019 and % CAGR Table 39: Japan 15-Year Perspective for Medical Thermometers by Application - Percentage Breakdown of Value Sales for Hospitals & Clinics, Home Care and Other Applications for the Years 2012, 2020 & 2027 CHINA Table 40: China Current & Future Analysis for Medical Thermometers by Product Type - Digital, Infrared and Other Product Types - Independent Analysis of Annual Sales in US$ Thousand for the Years 2020 through 2027 and % CAGR Table 41: China Historic Review for Medical Thermometers by Product Type - Digital, Infrared and Other Product Types Markets - Independent Analysis of Annual Sales in US$ Thousand for Years 2012 through 2019 and % CAGR Table 42: China 15-Year Perspective for Medical Thermometers by Product Type - Percentage Breakdown of Value Sales for Digital, Infrared and Other Product Types for the Years 2012, 2020 & 2027 Table 43: China Current & Future Analysis for Medical Thermometers by Application - Hospitals & Clinics, Home Care and Other Applications - Independent Analysis of Annual Sales in US$ Thousand for the Years 2020 through 2027 and % CAGR Table 44: China Historic Review for Medical Thermometers by Application - Hospitals & Clinics, Home Care and Other Applications Markets - Independent Analysis of Annual Sales in US$ Thousand for Years 2012 through 2019 and % CAGR Table 45: China 15-Year Perspective for Medical Thermometers by Application - Percentage Breakdown of Value Sales for Hospitals & Clinics, Home Care and Other Applications for the Years 2012, 2020 & 2027 China to Curb Production of Mercury Containing Medical Devices EUROPE Table 46: Europe Current & Future Analysis for Medical Thermometers by Geographic Region - France, Germany, Italy, UK, Spain, Russia and Rest of Europe Markets - Independent Analysis of Annual Sales in US$ Thousand for Years 2020 through 2027 and % CAGR Table 47: Europe Historic Review for Medical Thermometers by Geographic Region - France, Germany, Italy, UK, Spain, Russia and Rest of Europe Markets - Independent Analysis of Annual Sales in US$ Thousand for Years 2012 through 2019 and % CAGR Table 48: Europe 15-Year Perspective for Medical Thermometers by Geographic Region - Percentage Breakdown of Value Sales for France, Germany, Italy, UK, Spain, Russia and Rest of Europe Markets for Years 2012, 2020 & 2027 Table 49: Europe Current & Future Analysis for Medical Thermometers by Product Type - Digital, Infrared and Other Product Types - Independent Analysis of Annual Sales in US$ Thousand for the Years 2020 through 2027 and % CAGR Table 50: Europe Historic Review for Medical Thermometers by Product Type - Digital, Infrared and Other Product Types Markets - Independent Analysis of Annual Sales in US$ Thousand for Years 2012 through 2019 and % CAGR Table 51: Europe 15-Year Perspective for Medical Thermometers by Product Type - Percentage Breakdown of Value Sales for Digital, Infrared and Other Product Types for the Years 2012, 2020 & 2027 Table 52: Europe Current & Future Analysis for Medical Thermometers by Application - Hospitals & Clinics, Home Care and Other Applications - Independent Analysis of Annual Sales in US$ Thousand for the Years 2020 through 2027 and % CAGR Table 53: Europe Historic Review for Medical Thermometers by Application - Hospitals & Clinics, Home Care and Other Applications Markets - Independent Analysis of Annual Sales in US$ Thousand for Years 2012 through 2019 and % CAGR Table 54: Europe 15-Year Perspective for Medical Thermometers by Application - Percentage Breakdown of Value Sales for Hospitals & Clinics, Home Care and Other Applications for the Years 2012, 2020 & 2027 EU Bans Mercury-Based Thermometers Infection Control Awareness Drives Demand for Non-Contact Thermometers FRANCE Table 55: France Current & Future Analysis for Medical Thermometers by Product Type - Digital, Infrared and Other Product Types - Independent Analysis of Annual Sales in US$ Thousand for the Years 2020 through 2027 and % CAGR Table 56: France Historic Review for Medical Thermometers by Product Type - Digital, Infrared and Other Product Types Markets - Independent Analysis of Annual Sales in US$ Thousand for Years 2012 through 2019 and % CAGR Table 57: France 15-Year Perspective for Medical Thermometers by Product Type - Percentage Breakdown of Value Sales for Digital, Infrared and Other Product Types for the Years 2012, 2020 & 2027 Table 58: France Current & Future Analysis for Medical Thermometers by Application - Hospitals & Clinics, Home Care and Other Applications - Independent Analysis of Annual Sales in US$ Thousand for the Years 2020 through 2027 and % CAGR Table 59: France Historic Review for Medical Thermometers by Application - Hospitals & Clinics, Home Care and Other Applications Markets - Independent Analysis of Annual Sales in US$ Thousand for Years 2012 through 2019 and % CAGR Table 60: France 15-Year Perspective for Medical Thermometers by Application - Percentage Breakdown of Value Sales for Hospitals & Clinics, Home Care and Other Applications for the Years 2012, 2020 & 2027 Ban on Mercury Thermometers - A Review GERMANY Table 61: Germany Current & Future Analysis for Medical Thermometers by Product Type - Digital, Infrared and Other Product Types - Independent Analysis of Annual Sales in US$ Thousand for the Years 2020 through 2027 and % CAGR Table 62: Germany Historic Review for Medical Thermometers by Product Type - Digital, Infrared and Other Product Types Markets - Independent Analysis of Annual Sales in US$ Thousand for Years 2012 through 2019 and % CAGR Table 63: Germany 15-Year Perspective for Medical Thermometers by Product Type - Percentage Breakdown of Value Sales for Digital, Infrared and Other Product Types for the Years 2012, 2020 & 2027 Table 64: Germany Current & Future Analysis for Medical Thermometers by Application - Hospitals & Clinics, Home Care and Other Applications - Independent Analysis of Annual Sales in US$ Thousand for the Years 2020 through 2027 and % CAGR Table 65: Germany Historic Review for Medical Thermometers by Application - Hospitals & Clinics, Home Care and Other Applications Markets - Independent Analysis of Annual Sales in US$ Thousand for Years 2012 through 2019 and % CAGR Table 66: Germany 15-Year Perspective for Medical Thermometers by Application - Percentage Breakdown of Value Sales for Hospitals & Clinics, Home Care and Other Applications for the Years 2012, 2020 & 2027 ITALY Table 67: Italy Current & Future Analysis for Medical Thermometers by Product Type - Digital, Infrared and Other Product Types - Independent Analysis of Annual Sales in US$ Thousand for the Years 2020 through 2027 and % CAGR Table 68: Italy Historic Review for Medical Thermometers by Product Type - Digital, Infrared and Other Product Types Markets - Independent Analysis of Annual Sales in US$ Thousand for Years 2012 through 2019 and % CAGR Table 69: Italy 15-Year Perspective for Medical Thermometers by Product Type - Percentage Breakdown of Value Sales for Digital, Infrared and Other Product Types for the Years 2012, 2020 & 2027 Table 70: Italy Current & Future Analysis for Medical Thermometers by Application - Hospitals & Clinics, Home Care and Other Applications - Independent Analysis of Annual Sales in US$ Thousand for the Years 2020 through 2027 and % CAGR Table 71: Italy Historic Review for Medical Thermometers by Application - Hospitals & Clinics, Home Care and Other Applications Markets - Independent Analysis of Annual Sales in US$ Thousand for Years 2012 through 2019 and % CAGR Table 72: Italy 15-Year Perspective for Medical Thermometers by Application - Percentage Breakdown of Value Sales for Hospitals & Clinics, Home Care and Other Applications for the Years 2012, 2020 & 2027 UNITED KINGDOM Table 73: UK Current & Future Analysis for Medical Thermometers by Product Type - Digital, Infrared and Other Product Types - Independent Analysis of Annual Sales in US$ Thousand for the Years 2020 through 2027 and % CAGR Table 74: UK Historic Review for Medical Thermometers by Product Type - Digital, Infrared and Other Product Types Markets - Independent Analysis of Annual Sales in US$ Thousand for Years 2012 through 2019 and % CAGR Table 75: UK 15-Year Perspective for Medical Thermometers by Product Type - Percentage Breakdown of Value Sales for Digital, Infrared and Other Product Types for the Years 2012, 2020 & 2027 Table 76: UK Current & Future Analysis for Medical Thermometers by Application - Hospitals & Clinics, Home Care and Other Applications - Independent Analysis of Annual Sales in US$ Thousand for the Years 2020 through 2027 and % CAGR Table 77: UK Historic Review for Medical Thermometers by Application - Hospitals & Clinics, Home Care and Other Applications Markets - Independent Analysis of Annual Sales in US$ Thousand for Years 2012 through 2019 and % CAGR Table 78: UK 15-Year Perspective for Medical Thermometers by Application - Percentage Breakdown of Value Sales for Hospitals & Clinics, Home Care and Other Applications for the Years 2012, 2020 & 2027 SPAIN Table 79: Spain Current & Future Analysis for Medical Thermometers by Product Type - Digital, Infrared and Other Product Types - Independent Analysis of Annual Sales in US$ Thousand for the Years 2020 through 2027 and % CAGR Table 80: Spain Historic Review for Medical Thermometers by Product Type - Digital, Infrared and Other Product Types Markets - Independent Analysis of Annual Sales in US$ Thousand for Years 2012 through 2019 and % CAGR Table 81: Spain 15-Year Perspective for Medical Thermometers by Product Type - Percentage Breakdown of Value Sales for Digital, Infrared and Other Product Types for the Years 2012, 2020 & 2027 Table 82: Spain Current & Future Analysis for Medical Thermometers by Application - Hospitals & Clinics, Home Care and Other Applications - Independent Analysis of Annual Sales in US$ Thousand for the Years 2020 through 2027 and % CAGR Table 83: Spain Historic Review for Medical Thermometers by Application - Hospitals & Clinics, Home Care and Other Applications Markets - Independent Analysis of Annual Sales in US$ Thousand for Years 2012 through 2019 and % CAGR Table 84: Spain 15-Year Perspective for Medical Thermometers by Application - Percentage Breakdown of Value Sales for Hospitals & Clinics, Home Care and Other Applications for the Years 2012, 2020 & 2027 RUSSIA Table 85: Russia Current & Future Analysis for Medical Thermometers by Product Type - Digital, Infrared and Other Product Types - Independent Analysis of Annual Sales in US$ Thousand for the Years 2020 through 2027 and % CAGR Table 86: Russia Historic Review for Medical Thermometers by Product Type - Digital, Infrared and Other Product Types Markets - Independent Analysis of Annual Sales in US$ Thousand for Years 2012 through 2019 and % CAGR Table 87: Russia 15-Year Perspective for Medical Thermometers by Product Type - Percentage Breakdown of Value Sales for Digital, Infrared and Other Product Types for the Years 2012, 2020 & 2027 Table 88: Russia Current & Future Analysis for Medical Thermometers by Application - Hospitals & Clinics, Home Care and Other Applications - Independent Analysis of Annual Sales in US$ Thousand for the Years 2020 through 2027 and % CAGR Table 89: Russia Historic Review for Medical Thermometers by Application - Hospitals & Clinics, Home Care and Other Applications Markets - Independent Analysis of Annual Sales in US$ Thousand for Years 2012 through 2019 and % CAGR Table 90: Russia 15-Year Perspective for Medical Thermometers by Application - Percentage Breakdown of Value Sales for Hospitals & Clinics, Home Care and Other Applications for the Years 2012, 2020 & 2027 REST OF EUROPE Table 91: Rest of Europe Current & Future Analysis for Medical Thermometers by Product Type - Digital, Infrared and Other Product Types - Independent Analysis of Annual Sales in US$ Thousand for the Years 2020 through 2027 and % CAGR Table 92: Rest of Europe Historic Review for Medical Thermometers by Product Type - Digital, Infrared and Other Product Types Markets - Independent Analysis of Annual Sales in US$ Thousand for Years 2012 through 2019 and % CAGR Table 93: Rest of Europe 15-Year Perspective for Medical Thermometers by Product Type - Percentage Breakdown of Value Sales for Digital, Infrared and Other Product Types for the Years 2012, 2020 & 2027 Table 94: Rest of Europe Current & Future Analysis for Medical Thermometers by Application - Hospitals & Clinics, Home Care and Other Applications - Independent Analysis of Annual Sales in US$ Thousand for the Years 2020 through 2027 and % CAGR Table 95: Rest of Europe Historic Review for Medical Thermometers by Application - Hospitals & Clinics, Home Care and Other Applications Markets - Independent Analysis of Annual Sales in US$ Thousand for Years 2012 through 2019 and % CAGR Table 96: Rest of Europe 15-Year Perspective for Medical Thermometers by Application - Percentage Breakdown of Value Sales for Hospitals & Clinics, Home Care and Other Applications for the Years 2012, 2020 & 2027 ASIA-PACIFIC Table 97: Asia-Pacific Current & Future Analysis for Medical Thermometers by Geographic Region - Australia, India, South Korea and Rest of Asia-Pacific Markets - Independent Analysis of Annual Sales in US$ Thousand for Years 2020 through 2027 and % CAGR Table 98: Asia-Pacific Historic Review for Medical Thermometers by Geographic Region - Australia, India, South Korea and Rest of Asia-Pacific Markets - Independent Analysis of Annual Sales in US$ Thousand for Years 2012 through 2019 and % CAGR Table 99: Asia-Pacific 15-Year Perspective for Medical Thermometers by Geographic Region - Percentage Breakdown of Value Sales for Australia, India, South Korea and Rest of Asia-Pacific Markets for Years 2012, 2020 & 2027 Table 100: Asia-Pacific Current & Future Analysis for Medical Thermometers by Product Type - Digital, Infrared and Other Product Types - Independent Analysis of Annual Sales in US$ Thousand for the Years 2020 through 2027 and % CAGR Table 101: Asia-Pacific Historic Review for Medical Thermometers by Product Type - Digital, Infrared and Other Product Types Markets - Independent Analysis of Annual Sales in US$ Thousand for Years 2012 through 2019 and % CAGR Table 102: Asia-Pacific 15-Year Perspective for Medical Thermometers by Product Type - Percentage Breakdown of Value Sales for Digital, Infrared and Other Product Types for the Years 2012, 2020 & 2027 Table 103: Asia-Pacific Current & Future Analysis for Medical Thermometers by Application - Hospitals & Clinics, Home Care and Other Applications - Independent Analysis of Annual Sales in US$ Thousand for the Years 2020 through 2027 and % CAGR Table 104: Asia-Pacific Historic Review for Medical Thermometers by Application - Hospitals & Clinics, Home Care and Other Applications Markets - Independent Analysis of Annual Sales in US$ Thousand for Years 2012 through 2019 and % CAGR Table 105: Asia-Pacific 15-Year Perspective for Medical Thermometers by Application - Percentage Breakdown of Value Sales for Hospitals & Clinics, Home Care and Other Applications for the Years 2012, 2020 & 2027 AUSTRALIA Table 106: Australia Current & Future Analysis for Medical Thermometers by Product Type - Digital, Infrared and Other Product Types - Independent Analysis of Annual Sales in US$ Thousand for the Years 2020 through 2027 and % CAGR Table 107: Australia Historic Review for Medical Thermometers by Product Type - Digital, Infrared and Other Product Types Markets - Independent Analysis of Annual Sales in US$ Thousand for Years 2012 through 2019 and % CAGR Table 108: Australia 15-Year Perspective for Medical Thermometers by Product Type - Percentage Breakdown of Value Sales for Digital, Infrared and Other Product Types for the Years 2012, 2020 & 2027 Table 109: Australia Current & Future Analysis for Medical Thermometers by Application - Hospitals & Clinics, Home Care and Other Applications - Independent Analysis of Annual Sales in US$ Thousand for the Years 2020 through 2027 and % CAGR Table 110: Australia Historic Review for Medical Thermometers by Application - Hospitals & Clinics, Home Care and Other Applications Markets - Independent Analysis of Annual Sales in US$ Thousand for Years 2012 through 2019 and % CAGR Table 111: Australia 15-Year Perspective for Medical Thermometers by Application - Percentage Breakdown of Value Sales for Hospitals & Clinics, Home Care and Other Applications for the Years 2012, 2020 & 2027 INDIA Table 112: India Current & Future Analysis for Medical Thermometers by Product Type - Digital, Infrared and Other Product Types - Independent Analysis of Annual Sales in US$ Thousand for the Years 2020 through 2027 and % CAGR Table 113: India Historic Review for Medical Thermometers by Product Type - Digital, Infrared and Other Product Types Markets - Independent Analysis of Annual Sales in US$ Thousand for Years 2012 through 2019 and % CAGR Table 114: India 15-Year Perspective for Medical Thermometers by Product Type - Percentage Breakdown of Value Sales for Digital, Infrared and Other Product Types for the Years 2012, 2020 & 2027 Table 115: India Current & Future Analysis for Medical Thermometers by Application - Hospitals & Clinics, Home Care and Other Applications - Independent Analysis of Annual Sales in US$ Thousand for the Years 2020 through 2027 and % CAGR Table 116: India Historic Review for Medical Thermometers by Application - Hospitals & Clinics, Home Care and Other Applications Markets - Independent Analysis of Annual Sales in Please contact our Customer Support Center to get the complete Table of ContentsRead the full report: ReportlinkerReportLinker is an award-winning market research solution. Reportlinker finds and organizes the latest industry data so you get all the market research you need - instantly, in one place.__________________________
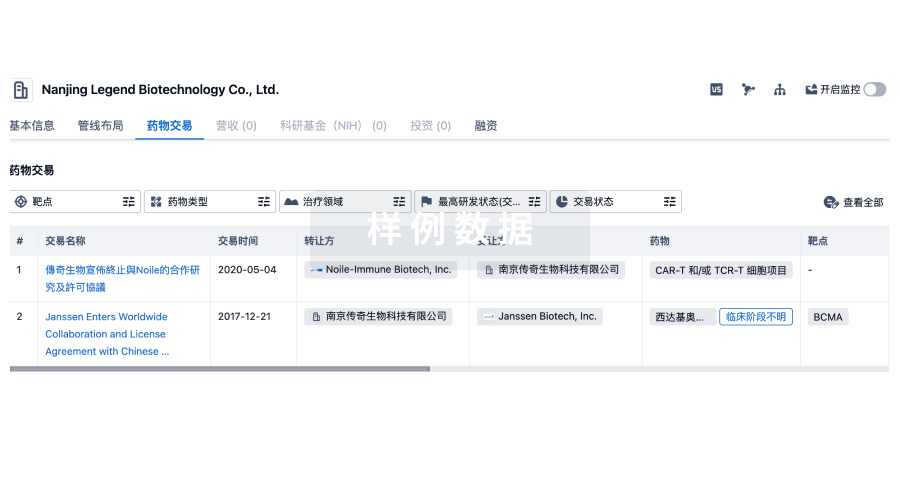
100 项与 易威生医科技股份有限公司 相关的药物交易
登录后查看更多信息
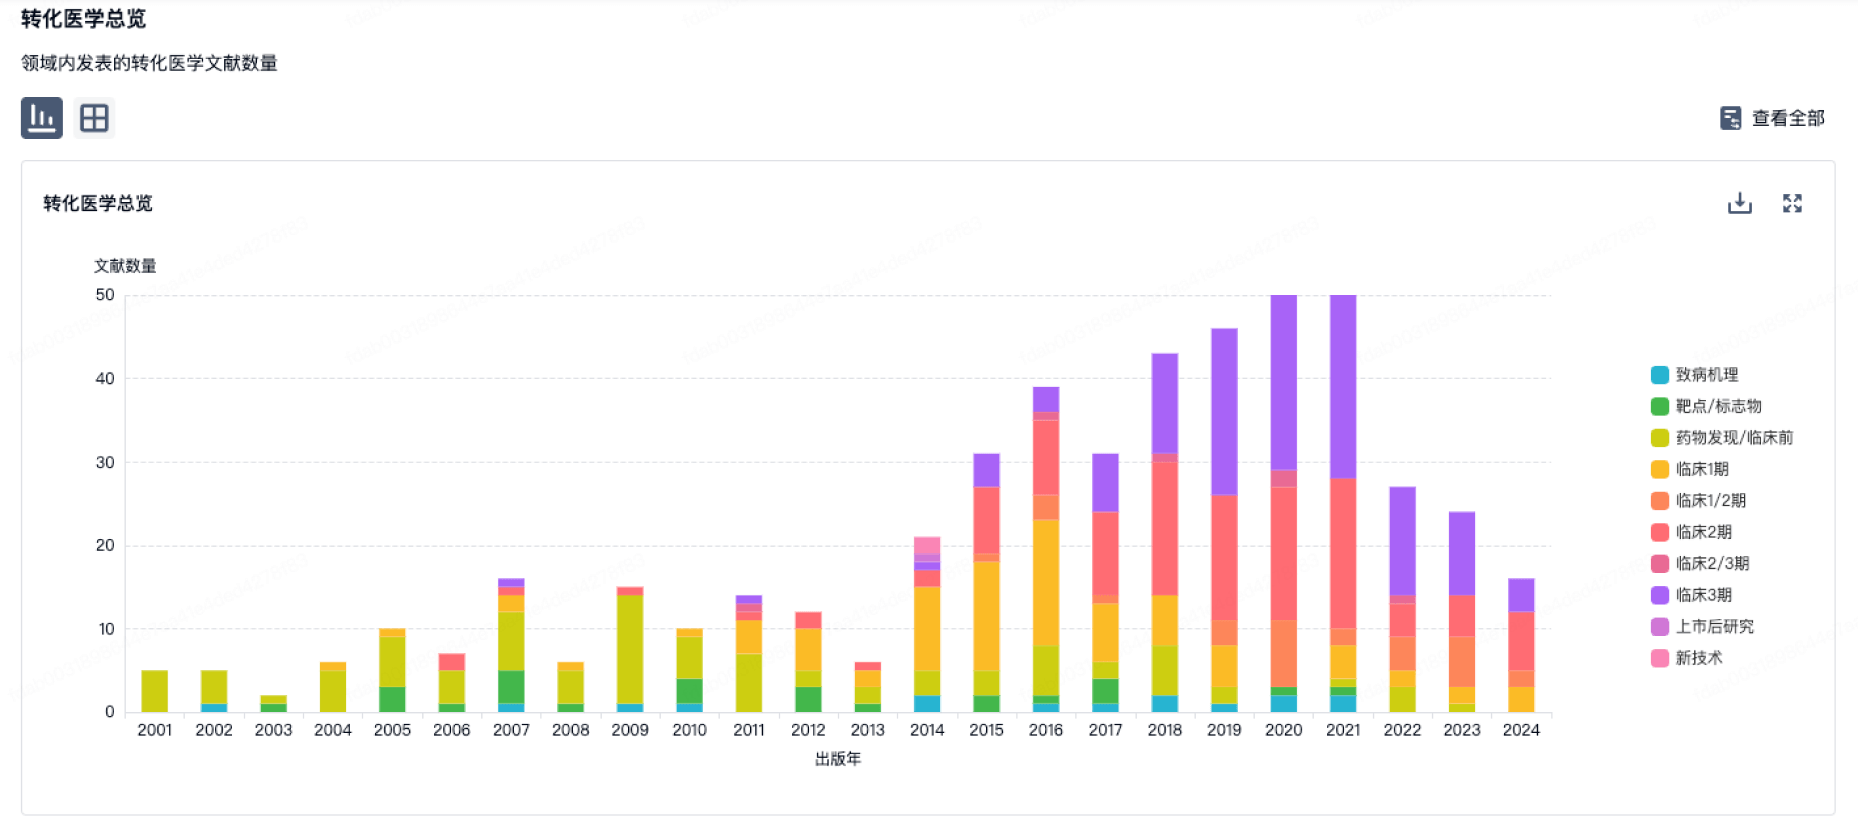
100 项与 易威生医科技股份有限公司 相关的转化医学
登录后查看更多信息
组织架构
使用我们的机构树数据加速您的研究。
登录
或
管线布局
2026年07月21日管线快照
管线布局中药物为当前组织机构及其子机构作为药物机构进行统计,早期临床1期并入临床1期,临床1/2期并入临床2期,临床2/3期并入临床3期
临床前
4
登录后查看更多信息
药物交易
使用我们的药物交易数据加速您的研究。
登录
或
转化医学
使用我们的转化医学数据加速您的研究。
登录
或
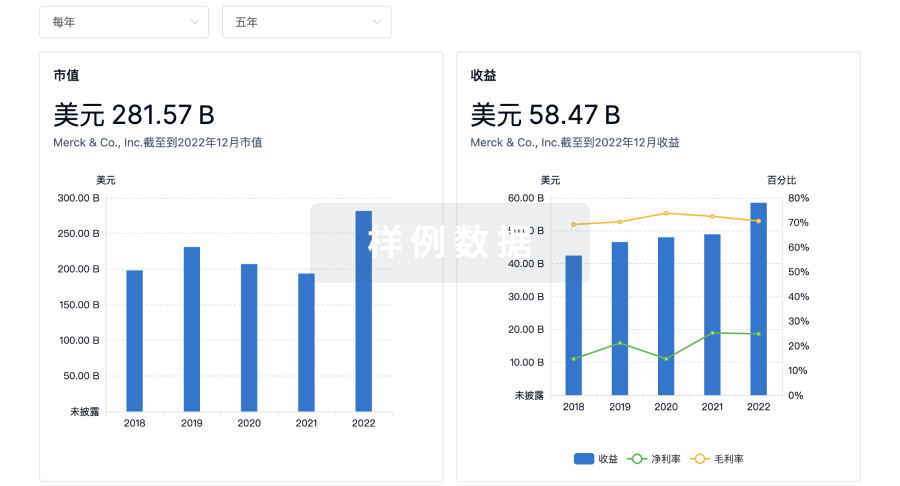
营收
使用 Synapse 探索超过 36 万个组织的财务状况。
登录
或
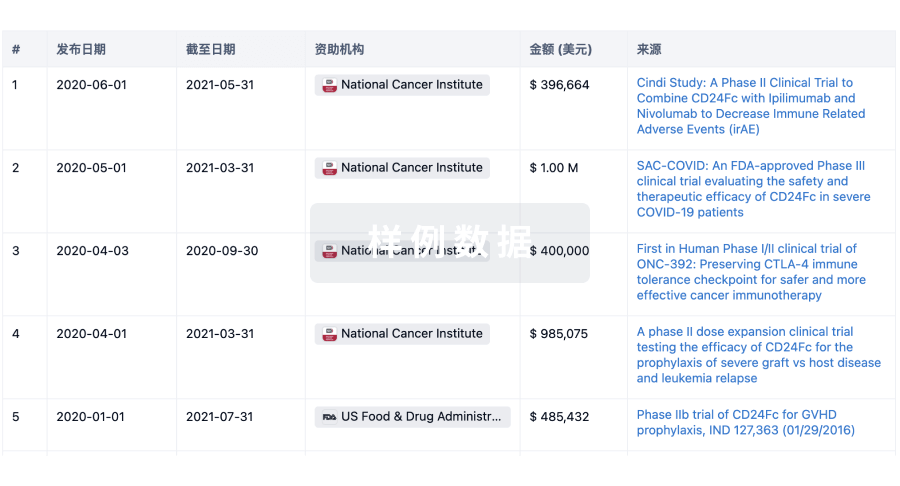
科研基金(NIH)
访问超过 200 万项资助和基金信息,以提升您的研究之旅。
登录
或
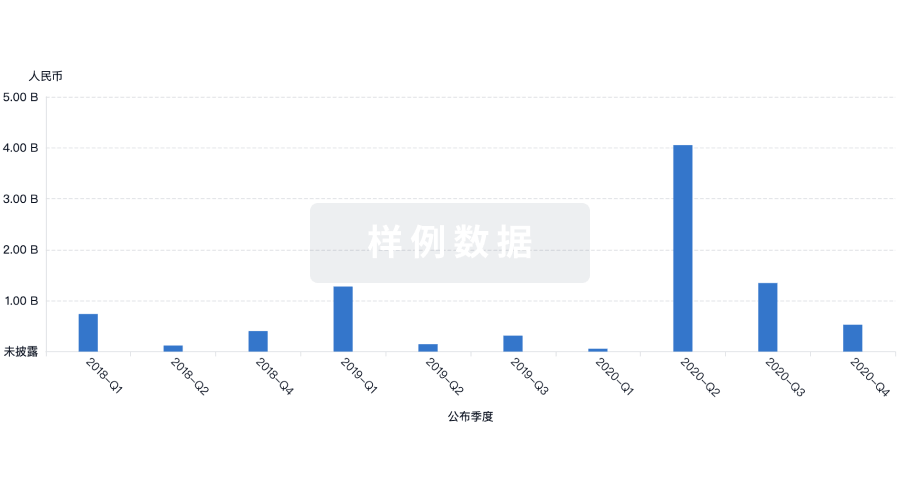
投资
深入了解从初创企业到成熟企业的最新公司投资动态。
登录
或
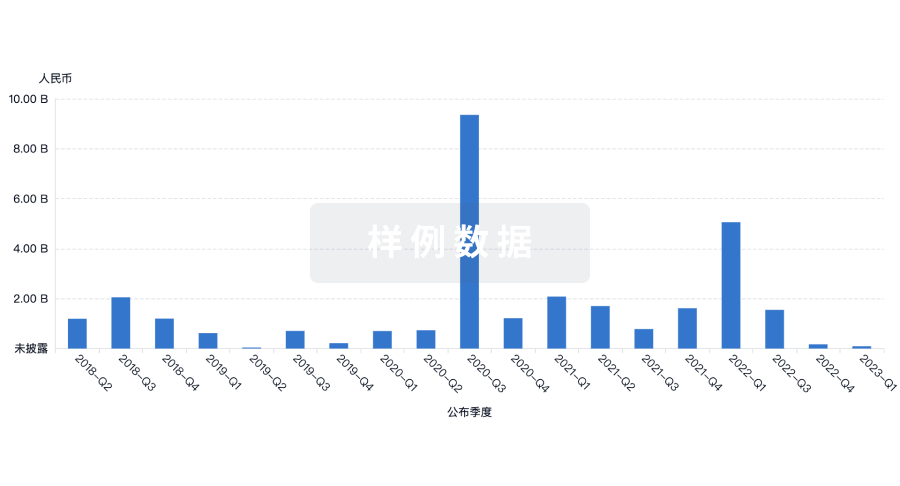
融资
发掘融资趋势以验证和推进您的投资机会。
登录
或
芽仔
全新生物医药AI Agent 覆盖科研全链路,让突破性发现快人一步
立即开始免费试用!
智慧芽新药情报库是智慧芽专为生命科学人士构建的基于AI的创新药情报平台,助您全方位提升您的研发与决策效率。
立即开始数据试用!
智慧芽新药库数据也通过智慧芽数据服务平台,以API或者数据包形式对外开放,助您更加充分利用智慧芽新药情报信息。
生物序列数据库
生物药研发创新
免费使用
化学结构数据库
小分子化药研发创新
免费使用