预约演示
更新于:2026-11-13

更新于:2026-11-13
概览
标签
肿瘤
合成多肽
双特异性T细胞结合器
单克隆抗体
疾病领域得分
一眼洞穿机构专注的疾病领域

技术平台
公司药物应用最多的技术
靶点
公司最常开发的靶点
关联
靶点 |
作用机制 |
在研机构 |
原研机构 |
在研适应症 |
非在研适应症 |
最高研发阶段 |
首次获批国家/地区 |
首次获批日期 |


靶点 |
作用机制 |
在研机构 |
原研机构 |
在研适应症 |
非在研适应症 |
最高研发阶段 |
首次获批国家/地区 |
首次获批日期 |
靶点 |
作用机制 |
在研机构 |
原研机构 |
在研适应症 |
非在研适应症 |
最高研发阶段 |
首次获批国家/地区 |
首次获批日期 |
NCT07828769
The Effect of Orofacial Myofunctional Therapy on Neuromuscular Outcomes and Orofacial Function in Children and Adolescents in Estonia
CTIS2025-524612-11-00
Effect of an adjunctive intervention on the tolerability of semaglutide in overweight adults without diabetes: a prospective, randomised, double-blind, single-centre, placebo-controlled clinical trial (SEMTOL)
NCT07622420
Late Effects of Cancer Therapies on Gonadal Function, Fertility, Efficiency of Fertility Preservation Procedures and Pregnancy Outcomes (ProspectiveFemaleAYA)

100 项与 University of Tartu 相关的临床结果
登录后查看更多信息
登录后查看更多信息
2027-02-01SPECTROCHIMICA ACTA PART A-MOLECULAR AND BIOMOLECULAR SPECTROSCOPY
Assessment of lichen classification using metabolic fingerprint of Fourier transform infrared spectra
Article
作者: Xie, Congmiao ; Lehismets, João Paulo Silva ; Rungi, Mait ; Adler, Priit ; Mark, Kristiina ; Tuvikene, Rando
Lichens exhibit an intriguing diversity of fungi with approximately 20,000 accepted species worldwide. Their identification relies on time-consuming investigation of morphological and chemical characters in addition to phylogenetic evidence. The most widely utilized method for lichen chemotaxonomic investigations, thin layer chromatography, uses hazardous chemicals, while attenuated total reflectance Fourier transform infrared spectra provide simple, rapid, and environmentally friendly metabolic analysis. With the 12 different spectral pre-processing pipelines tested on data subsets of different sizes, of largest encompassing 12 families, 25 genera, and 35 lichenized fungal species from the full dataset of 25 families, 98 genera and 324 species, we found asymmetric least squares for baseline correction, and vector and z-score normalization as the best tools for accurate lichen identification. We conducted Random Forest classification on five mid-infrared spectral regions using the optimum pipeline for each subset, and the results indicate that taxonomically most informative FTIR spectra region was 1800-650 cm-1, which we report here as the "lichen fingerprint region". The RF prediction accuracies across the taxonomic units tested using the fingerprint region were higher for species clustering (on average 87%), compared to genus (77%) or family (77%). The spectral regions of highest importance for species clustering are usually associated with cell wall carbohydrate and amide, which may provide characteristic features for lichen classification. Due to the high variability of FTIR spectra in the fingerprint region, the methodology that we propose here could be applied for studies on purified lichen metabolites, specific genera and ecological research questions, and quantitative analysis.
2027-01-01Methods in molecular biology (Clifton, N.J.)
Purification of Nascent, Chromatin-Associated RNA Enriched for RNA Modifications
Article
作者: Ørom, Ulf Andersson Vang ; Kudrin, Pavel
RNAs that are being synthesized and remain tethered to chromatin during transcription are key participants in co-transcriptional gene regulation. They contribute to essential processes such as splicing, transcription elongation, and chromatin structure shaping. Co- and post-transcriptional RNA modifications have emerged as critical regulators of RNA metabolism and may modulate the function of chromatin-associated RNAs, including their interactions with chromatin. Here, we describe a method to isolate nascent, chromatin-associated RNA enriched for specific RNA modifications, using a combination of metabolic labeling, cell fractionation, and immunoprecipitation. This approach involves labeling of newly transcribed RNA with nucleotide analogs, followed by subcellular fractionation to enrich for chromatin-bound RNA species. Subsequently, immunoprecipitation with RNA modification-specific antibodies is used to selectively purify RNA bearing specific epitranscriptomic marks. We detail each component of the protocol, which can be adapted to various mammalian cell types and experimental conditions. The nature of this workflow enables investigation of RNA modifications on nascent, chromatin-associated transcripts under physiological or perturbed conditions, including various stimuli, genetic mutants, or disease-relevant cell lines.
2026-12-01Journal of Translational Autoimmunity
Integrative post-GWAS analysis prioritizes immune regulatory pathways and candidate effector signals in systemic lupus erythematosus
Article
作者: Salumets, Andres ; Modhukur, Vijayachitra ; Patel, Naisarg ; S, Sajitha Lulu ; Lingasamy, Prakash ; Khatun, Masuma
Background:
Systemic lupus erythematosus (SLE) has a complex polygenic architecture, but translating genome-wide association signals into biologically interpretable candidates remains challenging. We applied an integrative post-GWAS framework to refine SLE-associated loci and prioritize candidate regulatory mechanisms.
Methods:
European-ancestry SLE GWAS summary statistics from FinnGen and Bentham et al. were meta-analysed, comprising 8417 cases and 354,277 controls. After quality filtering, 6,782,131 SNPs were retained. Downstream analyses included LAVA regional prioritization, Bayesian colocalization with GTEx v8 whole-blood and spleen eQTLs, independent replication in the Julià et al. Spanish cohort, pathway enrichment, bivariate LAVA cross-trait local genetic correlation, and therapeutic annotation.
Results:
The discovery meta-analysis identified 46 genome-wide significant SLE-associated loci, including putative novel signals requiring database/literature qualification. LAVA identified 14 candidate index variants across 12 high-confidence regions, of which nine index variants were retained as the primary prioritized set based on LAVA support and/or convergent regulatory evidence. The strongest association mapped to the chr6p21.3/MHC region (rs389884), where four genes showed colocalization support, including CLIC1 in whole blood and C4A in spleen. Because the chr6p21.3/MHC rs389884 region lead variant was unavailable for replication and no suitable proxy was identified, this signal was interpreted as an emerging candidate for functional validation rather than a replicated causal signal. Seven available variants replicated with concordant effects. An exploratory Roadmap immune chromatin-state overlap analysis placed 15 of 45 non-MHC lead variants (33.3%) directly, and 34 of 45 (75.6%) within ±10 kb, in active immune enhancer/promoter states. Pathway analyses highlighted type I interferon, JAK-STAT signaling, cytokine regulation, and antigen presentation, while bivariate LAVA analyses supported shared local genetic architecture with rheumatoid arthritis, systemic sclerosis, and Sjögren syndrome.
Conclusions:
This integrative post-GWAS analysis refines SLE association signals into biologically interpretable candidate regions and supports interferon and JAK-STAT signaling as central genetically supported pathways in SLE.
2026-09-06
基因疗法临床1期临床结果
2026-07-23
·生息致知
100 项与 University of Tartu 相关的药物交易
登录后查看更多信息
100 项与 University of Tartu 相关的转化医学
登录后查看更多信息
组织架构
使用我们的机构树数据加速您的研究。
登录
或
管线布局
2026年11月13日管线快照
管线布局中药物为当前组织机构及其子机构作为药物机构进行统计,早期临床1期并入临床1期,临床1/2期并入临床2期,临床2/3期并入临床3期
药物发现
1
3
临床前
登录后查看更多信息
当前项目
登录后查看更多信息
药物交易
使用我们的药物交易数据加速您的研究。
登录
或
转化医学
使用我们的转化医学数据加速您的研究。
登录
或
营收
使用 Synapse 探索超过 36 万个组织的财务状况。
登录
或
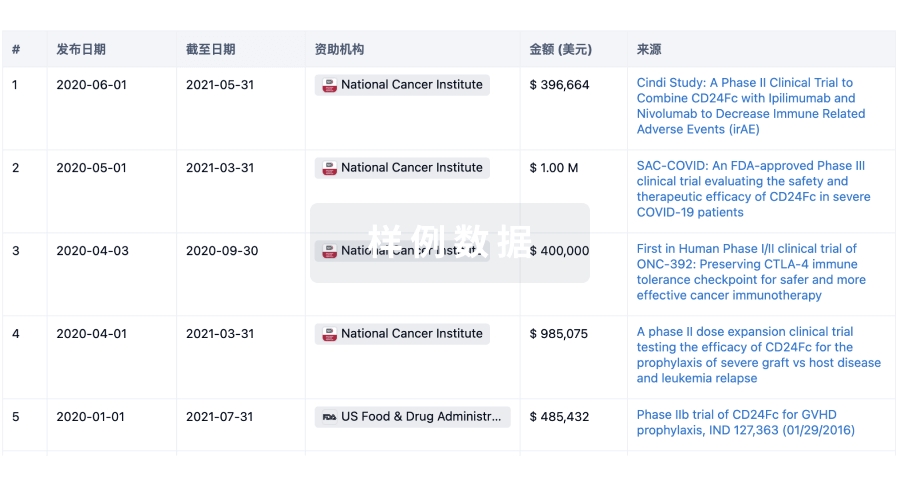
科研基金(NIH)
访问超过 200 万项资助和基金信息,以提升您的研究之旅。
登录
或
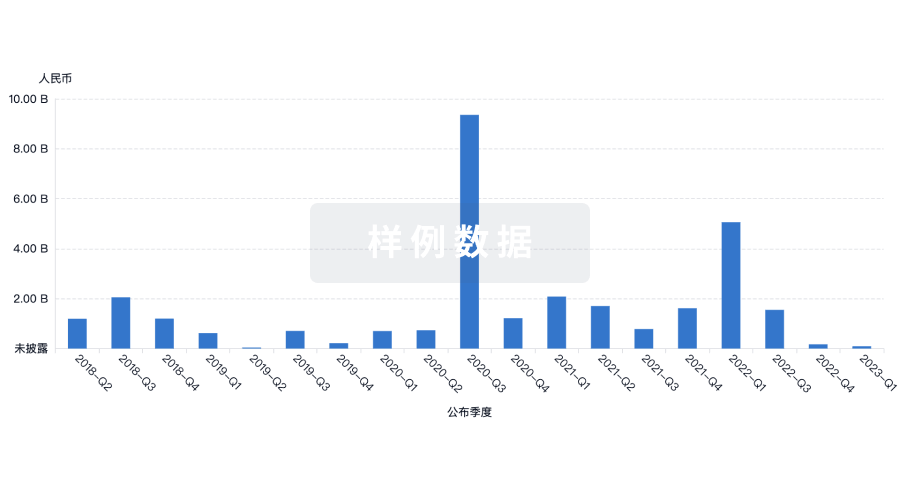
投资
深入了解从初创企业到成熟企业的最新公司投资动态。
登录
或
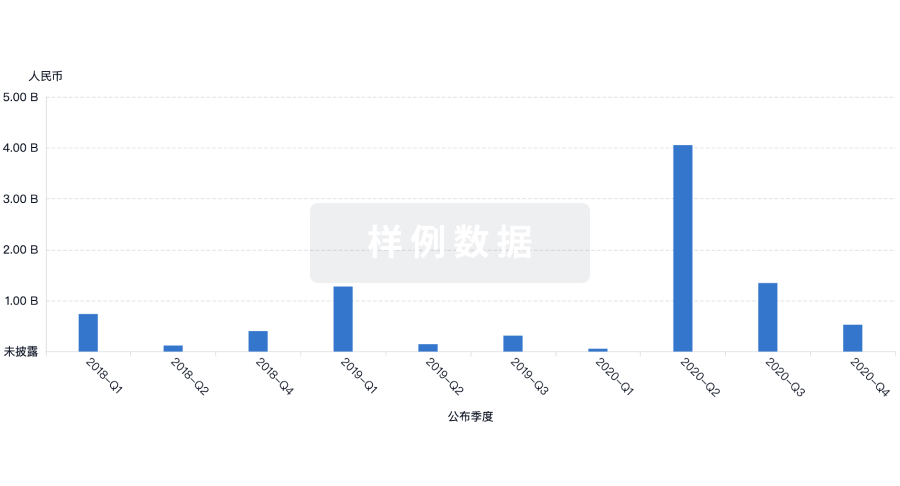
融资
发掘融资趋势以验证和推进您的投资机会。
登录
或
提出任何生物医药研究问题
让每一步生物医药决策都精准制胜
基于十亿级生物数据与全球情报的精准 AI,赋能早期药物发现
立即开始免费试用!
智慧芽新药情报库是智慧芽专为生命科学人士构建的基于AI的创新药情报平台,助您全方位提升您的研发与决策效率。
立即接入生物医药数据包
智慧芽新药库数据也通过智慧芽开放平台,以MCP或API服务形式对外开放。立即使用我们的MCP服务定制您的LLM智能体。
生物序列数据库
生物药研发创新
免费使用
化学结构数据库
小分子化药研发创新
免费使用