预约演示
更新于:2026-07-20
Icotrokinra
盐酸伊可白滞素
更新于:2026-07-20
概要
基本信息
最高研发阶段批准上市 |
首次获批日期 美国 (2026-03-17), |
最高研发阶段(中国)申请上市 |
特殊审评优先审评 (中国) |


登录后查看时间轴
结构/序列
Sequence Code 1311911322
来源: *****
关联
26
项与 盐酸伊可白滞素 相关的临床试验NCT07196722
A Phase 2b/3 Randomized, Double-blind, Placebo-Controlled, Parallel Group, Multicenter Protocol to Evaluate the Efficacy and Safety of Icotrokinra in Participants With Moderately to Severely Active Crohn's Disease
The purpose of this study is to evaluate how-well icotrokinra works (clinical efficacy) and how safe it is (safety) in participants with moderately to severely active Crohn's disease (CD; a long-term condition causing severe inflammation of the intestinal tract).
开始日期2025-10-03 |
NCT07196748
A Phase 3 Randomized, Double-blind, Placebo-Controlled, Parallel Group, Multicenter Protocol in Adults With an Open Label Study in Adolescents to Evaluate the Efficacy and Safety of Induction and Maintenance Therapy With Icotrokinra in Participants With Moderately to Severely Active Ulcerative Colitis
The purpose of this protocol is to evaluate the efficacy (how well it works), safety and tolerability of oral icotrokinra as therapy in adult and adolescent participants with moderately to severely active ulcerative colitis (UC, a chronic disease of the large intestine in which the lining of the colon becomes inflamed and develops tiny open ulcers).
开始日期2025-10-01 |
CTIS2025-521005-41-00
A three-part trial in healthy volunteers to find out how long icotrokinra stays in and acts on the body when administered as different tablet formulations and under different food conditions
开始日期2025-06-30 |
申办/合作机构- |
100 项与 盐酸伊可白滞素 相关的临床结果
登录后查看更多信息
100 项与 盐酸伊可白滞素 相关的转化医学
登录后查看更多信息
100 项与 盐酸伊可白滞素 相关的专利(医药)
登录后查看更多信息
24
项与 盐酸伊可白滞素 相关的文献(医药)2026-06-01·INTERNATIONAL JOURNAL OF DERMATOLOGY
Editor's Highlights—June 2026
Article
作者: Kemény, Lajos
ABSTRACT:
Major advances have broadened the therapeutic landscape of inflammatory skin diseases. In psoriasis, alongside the tyrosine kinase 2 (TYK2) inhibitor deucravacitinib, the United States Food and Drug Administration (FDA) has approved the first oral interleukin‐23 (IL‐23) receptor antagonist peptide, icotrokinra. In atopic dermatitis, new data have emerged on stapokibart, an interleukin‐4 receptor alpha subunit (IL‐4Rα) inhibitor introduced in China. In hidradenitis suppurativa, glucagon‐like peptide‐1 receptor agonists (GLP‐1 RA) are also gaining increasing attention as adjunctive therapy.
2026-06-01·INFLAMMOPHARMACOLOGY
A novel oral interleukin-23 receptor antagonist peptide, icotrokinra, for moderate-to- severe plaque psoriasis: a systematic review and meta-analysis of randomized controlled trials
Review
作者: Fonseca, Lorena Oliveira ; Tyring, Stephen K ; Ghanem, Laura ; Onejeme, Chinenye ; Cevallos-Cueva, Martin
BACKGROUND:
Icotrokinra represents a novel therapeutic approach that may address limitations associated with current injectable biologic therapies, including storage requirements and self-administration complexity, and may benefit patients who have needle aversion.
METHODS:
We included five randomized controlled trials (RCTs) comparing icotrokinra with placebo. PubMed, Embase, and Cochrane CENTRAL were systematically searched from inception to November 2025. Primary outcomes included the proportion of patients achieving an Investigator's Global Assessment (IGA) score of 0 (clear skin) or 1 (minimal disease) and an IGA score of 0 at weeks 4, 8 and 16; a scalp-specific IGA (ss-IGA) score of 0 or 1 at weeks 8 and 16; and at least 75%, 90%, and 100% improvement from baseline in the Psoriasis Area and Severity Index (PASI 75, PASI 90, and PASI 100) at weeks 4, 8 and 16. Patient-reported outcomes included the Psoriasis Symptoms and Signs Diary (PSSD) symptom score of 0 at weeks 8 and 16. Safety outcomes were also assessed. Secondary analyses involved subgroup evaluations of icotrokinra 200 mg once daily.
RESULTS:
Across five included RCTs, 1509 (54.77%) patients received icotrokinra. Icotrokinra significantly increased the likelihood of achieving an IGA score of 0 or1 at week 4 (OR 7.08; 95% CI 4.33 to 11.55; P < 0.001), week 8 (OR 13.29; 95% CI 9.19 to 19.21; P < 0.001), and week 16 (OR 18.76; 95% CI 13.88 to 25.36; P < 0.001). Consistent findings were observed for PASI 90 at week 4 (OR 10.30; 95% CI 2.54 to 41.81; P = 0.003), week 8 (OR 28.65; 95% CI 11.60 to 70.75; P < 0.001),and week 16 (OR 27.14; 95% CI 16.66 to 44.22; P < 0.001). For high-impact, difficult-to-treat sites, icotrokinra significantly increased the likelihood of achieving a ss-IGA score of 0 or 1 at week 8 (OR 7.56; 95% CI 5.73 to 9.96; P < 0.001) and week 16 (OR 9.61; 95% CI 7.00 to 13.20; P < 0.001). Neither the incidence of serious adverse events (OR 0.63; 95% CI 0.29 to 1.34; P = 0.23) nor malignancy (OR 2.61; 95% CI 0.30 to 22.56; P = 0.82) was significantly different between groups.
CONCLUSIONS:
Icotrokinra demonstrated a favorable short-term efficacy and an acceptable safety profile compared to placebo in patients with moderate-to-severe plaque psoriasis, including meaningful responses in high-impact sites, supporting its potential as a promising oral therapeutic option. Long-term studies and comparative trials against current injectable biologic therapies are warranted to better define its place in the therapeutic armamentarium.
2026-06-01·INTERNATIONAL JOURNAL OF DERMATOLOGY
Efficacy and Safety of Oral Icotrokinra in Moderate‐to‐Severe Plaque Psoriasis: A Systematic Review, Meta‐Analysis, and Trial Sequential Analysis
Review
作者: Alfeetouri, Mohamed Yaseen ; Lateiresh, Munder ; Zouaoui, Yassine ; Marwan, Lutfiyah ; Altayf, Alhasan ; Elhadi, Muhammed
ABSTRACT:
Oral therapies for moderate‐to‐severe plaque psoriasis are limited by modest efficacy or safety concerns. Icotrokinra is a novel oral interleukin‐23 receptor antagonist peptide that has shown promising efficacy in randomized trials. This study aimed to systematically evaluate the efficacy and safety of icotrokinra in patients with moderate‐to‐severe plaque psoriasis. A systematic review and meta‐analysis of randomized controlled trials (RCTs) comparing icotrokinra 200 mg once daily with placebo was conducted in accordance with PRISMA 2020 guidelines. The primary outcome was achievement of a ≥ 75% reduction in Psoriasis Area and Severity Index (PASI 75) at Week 16. Random‐effects models were used to calculate odds ratios (ORs) with 95% confidence intervals (CIs), and trial sequential analysis was performed. Five RCTs, including 1951 participants, were analyzed. Icotrokinra 200 mg once daily significantly increased PASI 75 response rates compared with placebo at Week 4 (15% vs. 2%; OR = 6.57, 95% CI 3.66–11.81;
p
< 0.0001) and Week 16 (73% vs. 11%; OR = 22.03, 95% CI 16.13–30.10;
p
< 0.0001). Higher clearance thresholds also favored icotrokinra, including PASI 90 (54% vs. 4%; OR = 28.24) and PASI 100 (30% vs. 1%; OR = 45.86). The incidence of adverse events, serious adverse events, and infections did not differ significantly between groups. Icotrokinra is an effective and well‐tolerated oral treatment for moderate‐to‐severe plaque psoriasis, offering rapid and sustained clinical benefit with a safety profile comparable to placebo. It represents a promising oral option bridging the gap between existing oral therapies and biologics.
image
971
项与 盐酸伊可白滞素 相关的新闻(医药)2026-07-19
环肽药物真正推进的,不只是某个分子或某篇论文,而是**把"不可成药"的 PPI 界面变成口服可及的化学空间**。从 1983 年 Cyclosporine A 以天然产物身份上市,到 2026 年 Enlicitide 和 Icotrokinra 以 de novo display 来源口服环肽身份获批——这个领域用 40 年完成了从"偶然发现"到"理性设计"的范式转变。
年份
关键里程碑
科学与转化意义
1983
Cyclosporine A 上市
天然产物,11 残基 7 个 N-甲基化,口服环肽的"教科书案例"
2009
Romidepsin 上市
天然双环肽,靶向胞内 HDAC,FDA 批准 CTCL
2011
Lokey: On-resin N-甲基化
Nat Chem Biol,系统化建立 N-甲基化→口服通透性策略
2020
Merck: mRNA display → PCSK9 hit
J Med Chem,display 来源先导化合物的起点
2021
Tucker: 三环肽 PCSK9
J Med Chem,单环→三环刚性化,Ki 降至 pM 级
2021
Voclosporin 上市
CsA 优化版,口服环肽治疗狼疮性肾炎
2023
Merck: MK-0616 临床 PK/PD
Circulation,口服 >90% PCSK9 抑制
2025
AfCycDesign
Nat Commun,AF2 环肽结构预测与 binder 设计
2026
Enlicitide FDA 批准首个口服 PCSK9 抑制剂
,mRNA display 来源首个上市
2026
Icotrokinra FDA 批准首个口服 IL-23R 拮抗剂
,噬菌体展示来源首个上市
2026
Enlicitide 生物催化合成
Science,13 种酶公斤级制造
2026
HS-20118 翰森→Avere
口服 IL-23 拮抗剂,每周一次,首付 $1.2 亿 + 里程碑 $21.8 亿
表 1|环肽药物领域关键里程碑时间线:从 1983 年 Cyclosporine A 到 2026 年 Enlicitide/Icotrokinra/HS-20118,展示从天然产物到 de novo display 来源口服环肽的 40 年演进。
导读
**第 1 节**梳理展示筛选技术的三条路线——mRNA display 凭借 ≥10^13 库容和非天然氨基酸引入能力成为 hit 质量最优的平台,噬菌体展示以成熟低成本见长,酵母展示作为新兴力量提供定量实时筛选能力。**第 2 节**从分子层面(N-甲基化、多环刚性化)、规则层面(bRo5 类药性准则)、制剂层面(促渗剂)和 AI 预测四个层次系统拆解口服生物利用度这一环肽"圣杯"的攻克路径。**第 3 节**聚焦 AI 从头设计——AfCycDesign 和 RFpeptides 分别基于 AlphaFold2 和 RFdiffusion 实现原子精度环肽 binder 设计,标志着从"筛选发现"到"计算设计"的范式前沿。**第 4 节**解决商业化最后一公里:模块化片段组装加速 DMTA 循环, 酶生物催化级联将 70 步路线压缩至公斤级可生产。**第 5 节**是全文核心——以 Enlicitide 和 Icotrokinra 的平行发现历程为主线,融合对比 mRNA display vs 噬菌体展示、多环刚性化 vs 亲和力极致化两条技术路线,从靶点背景、筛选起点、优化策略、临床验证到制造创新逐层展开,并延伸至 HS-20118 的每周一次差异化方向。**第 6 节**将视野拉长至 40 年历史脉络,从天然产物主导到 de novo display 来源口服环肽上市的分代转折。
主线
环肽药物的核心科学问题可以一句话概括:**如何让一个分子量 500–2000 Da 的大环分子,同时具备抗体级的亲和力、小分子级的口服生物利用度、和可规模化制造的合成路线?** 这三个要求在过去是互相矛盾的——大环肽足够大可以结合平坦的 PPI 界面,但太大太 polar 就无法口服;引入非天然氨基酸可以提升稳定性,但让合成变得极其复杂。近年来,展示筛选技术、N-甲基化/多环刚性化策略、AI 从头设计、和生物催化制造这四个方向的协同突破,正在系统性地消解这个"不可能三角"。2026 年 Enlicitide 和 Icotrokinra 的连续获批,标志着这个"不可能三角"首次被临床和商业双重验证。
1. 展示筛选技术——从"发现 hit"到"直接发现先导化合物"
环肽药物加速上市的第一驱动力,是展示筛选技术把先导化合物发现从数年缩短至数周。
1.1 mRNA display
mRNA display 的核心优势是基因型-表型共价偶联:嘌呤霉素将肽链与编码其序列的 mRNA 共价连接,使库容可达 ≥10^13 独特序列,远超噬菌体展示的 10^9–10^10。Suga 课题组将 mRNA display 与 Flexizyme(FIT 系统)结合,推出 RaPID 平台——能在体外翻译系统中引入非天然氨基酸(D-AA、N-Me-AA、α-二取代 AA),使 hit 在筛选阶段就已具备良好的代谢稳定性(图 1)。Enlicitide 是 mRNA display 来源的首个上市药物,Merck 利用 mRNA display 筛选大环肽文库,获得含非天然氨基酸 5F-Trp 的初始 hit,hit 质量已是低 nM 级,大幅减少了 hit-to-lead 优化工作量。
图 1|基于 mRNA 展示的 RaPID 系统原理示意图:嘌呤霉素介导基因型-表型共价偶联,结合 Flexizyme 引入非天然氨基酸,实现超高通量大环肽文库筛选。
1.2 噬菌体展示
噬菌体展示虽然库容较小(10^9–10^10),但技术成熟、成本低。Icotrokinra 的发现始于 2013 年 MDL 公司通过 M13 噬菌体展示筛选 12-mer 随机肽库,发现含保守序列 -WX1X2X3W- 的 IL-23 结合肽。Bicycle Therapeutics 则用噬菌体展示 + TBMB 化学修饰构建双环肽平台,目前已有 Zelenectide pevedotin(Nectin-4 靶向,Ph2/3)等多条临床管线。
1.3 酵母展示(新兴)
2025 年 Nature Communications 报道了酵母展示 + FACS 的定量实时监控筛选平台,可同时评估亲和力、特异性、表位,无需化学合成即可排序,针对五个靶标成功获得良好配体。
2. 口服生物利用度——环肽的"圣杯"逐步攻克
口服是环肽药物最大的差异化优势,也是最大的技术挑战。近年来的突破来自分子层面、规则层面和制剂层面三个层次的系统化。
2.1 分子层面:构象控制策略
N-甲基化是口服环肽最核心的修饰策略。Cyclosporin A 的 11 个酰胺中 7 个被 N-甲基化,是口服环肽的"教科书案例"。2011 年 Lokey 课题组在 Nature Chemical Biology 上系统研究了 on-resin N-甲基化方法,建立了通过选择性 N-甲基化屏蔽氢键供体、调控 cis/trans 构象、降低去溶剂化能的策略框架,关键发现是**N-甲基化位置比数量更重要**——不同 N-甲基化模式对通透性影响显著(图 2)。构象刚性化是另一关键策略,Enlicitide 的三环化工程是最典型的案例:从单环到三环,每增加一个环,效价提升 10–40 倍,同时降低极性表面积暴露;第二环通过烯烃交叉复分解(RCM)将 Ki 从 μM 级提升至 0.39 nM,第三环通过点击化学(triazole)将 Ki 进一步提升至 **0.0094 nM**,两个环化之间的协同效应显著——单独点击环化仅达到 1.36 nM。
图 2|环肽固相选择性 N-甲基化修饰的构象假设机制及化学合成策略:基于低介电常数溶剂调控的分子内氢键网络屏蔽原理,实现针对暴露酰胺键的高选择性烷基化转化。(来源:Lokey 课题组,Nat Chem Biol, 2011)
2.2 规则层面:bRo5 类药性准则
对 >700 个环肽的系统研究(EPS 2024)提出了超越 Lipinski 五规则的环肽类药性准则:~11 残基、N-烷基 ≥ 6、ClogP ≥ 12.9、无离子化基团。其中最反直觉的发现是 11 聚体比更短的肽更适合口服——因为柔性允许构象切换:在膜内采取疏水构象、在水中采取亲水构象("分子变色龙"效应)。满足准则的 11 聚体在小鼠中口服生物利用度约 20% 或更高(图 3)。
图 3|不同残基数目环肽的体外清除率分布及 8 残基与 11 残基环肽跨膜构象柔性转变模型:11 残基环肽在水相中采取亲水构象以维持代谢稳定性,在脂质双层中翻转为疏水构象以高效通透。(来源:中外制药团队,EPS 2024)
2.3 制剂层面:促渗与递送
Enlicitide 的口服吸收依赖钠辛酸(sodium caprate)作为肠上皮细胞紧密连接开放剂,并要求禁食给药。一个有趣的策略性认知是:**不可通透性也可以是优势**——Enlicitide 不进入细胞,因此可以高剂量给药而不担心胞内脱靶,安全窗口宽。
2.4 AI 通透性预测
2025 年通透性预测领域密集突破:PEGASUS(J Med Chem)用 mRNA display 代理实验(2.7×10^9 肽)+ 多模态 AI,首次设计出含 >2 个极性片段仍可透膜的环肽;MultiCycPermea(BMC Biology)用图像-序列多模态模型将 MSE 降低 45%;C2PO(J Cheminformatics)成为首个生成式通透性优化器(图 4)。
图 4|PEGASUS 平台中环孢素 A 环境依赖性变色龙效应构象形貌图:在水相极性环境中延展为多极性暴露态,在非极性正己烷模拟中自发卷曲形成致密折叠构象,通过分子内氢键饱和降低膜屏障做功。(来源:Baker 团队,J Med Chem, 2026)
3. AI 从头设计——下一代环肽药物引擎
如果说展示筛选技术解决的是"如何快速找到 hit",AI 从头设计解决的是"如何跳过筛选直接设计 binder"。
3.1 AfCycDesign(Nature Communications, 2025)
在 AlphaFold2 中引入环状相对位置编码,实现四大功能:(1) 环肽结构预测(58/80 个 PDB 环肽 RMSD ≤ 1.5 Å);(2) 序列重设计(优于 Rosetta);(3) De novo 幻觉生成(10,000+ 结构多样的 7–13 残基环肽);(4) Binder 设计(针对 MDM2 和 Keap1 的 nM 级 IC50 binder)。8 个晶体结构 RMSD < 1.0 Å,达到原子级精度(图 5)。
图 5|AfCycDesign 平台的构建与精度评估:通过定制化环状偏移矩阵将首尾相连的环状约束输入 AlphaFold2,在 80 个天然环肽盲测中实现中位 PLDDT 0.92、重原子 RMSD 0.8 Å 的原子级预测精度。(来源:Bhardwaj 团队,Nat Commun, 2025)
3.2 RFpeptides(Nature Chemical Biology, 2025)
将 RFdiffusion 扩散模型扩展至环肽 binder 设计,针对四个不同靶标均获得 binder,其中 RbtA binder Kd < 10 nM(仅从预测结构出发设计),三个复合物晶体结构 Cα RMSD < 1.5 Å。这是首次实现仅从靶标结构/序列出发的原子精度环肽 binder 从头设计(图 6)。
图 6|RFpeptides 环肽从头设计平台的设计原理与全流水线工作流程:循环相对位置编码赋予扩散模型感知环状边界条件的能力,融合 ProteinMPNN 序列设计形成兼具深度学习置信度与物理学界面打分的完整平台。(来源:Bhardwaj/Baker 团队,Nat Chem Biol, 2025)
3.3 与展示技术的关系
AI 设计与展示技术互补而非替代:AI 生成候选 + 展示验证 = 高效闭环。AI 可以靶向"无天然配体"的全新靶标,而展示技术提供实验验证的高通量通道。
4. 合成与规模化制造——从"毫克级"到"公斤级"
环肽的复杂性(多环、非天然氨基酸、大环化)使其合成和制造成为上市的关键瓶颈。
4.1 模块化片段组装
Enlicitide 采用 North/East/South/West/Tail 五片段溶液相模块化策略,各片段可独立优化和放大,加速 DMTA(设计-合成-测试-分析)循环。这一策略解决了前代先导化合物的硫氧化敏感性、低溶解度、叠氮化物制造风险和烯烃异构体复杂性等问题(图 7)。
图 7|Enlicitide 的逆合成拆解路线及生物催化酰胺键形成的两类核心酶促反应机制:五片段模块化策略将复杂三环大环肽拆解为可独立放大的合成砌块,为后续生物催化级联奠定基础。(来源:Klapars 团队,Science, 2026)
4.2 生物催化级联合成
2026 年 Merck 在 Science 上发表了 Enlicitide 的生物催化制造路线:13 种定制酶催化三步级联,利用 ATP 依赖氨基酸连接酶和硫酯酶,实现公斤级生产,无需色谱纯化。初始路线约 70 步,生物催化路线大幅缩短。Merck 投资 25+ 年的生物催化能力在此项目中集中体现,为复杂大环肽的规模化制造提供了可持续蓝图(图 8)。
图 8|Enlicitide 生物催化级联合成路线:一锅法多酶催化级联反应高效合成各核心片段及最终手性酶促大环化,含四酶一锅法合成北部大环、五酶一锅法片段偶联伴随还原胺化大环化,以及基于 PBP-TE 酶的 70 g/L 高浓度高选择性闭环结晶工艺。(来源:Klapars 团队,Science, 2026)
"If we had any hope of achieving our aspiration to democratize access to this molecule as an important medicine, we were going to have to invent a new way of manufacturing this molecule." — David A. Thaisrivongs, Merck
5. 里程碑药物的发现历程与临床转化
2026 年,两个 de novo display 来源的口服环肽——Enlicitide 和 Icotrokinra——在数月内连续获 FDA 批准,标志着环肽药物从"偶然发现"到"理性设计"的范式转变完成临床验证。两者分别代表 mRNA display 与噬菌体展示两条技术路线,也展示了多环刚性化与亲和力极致化两种口服优化策略。
5.0 为何 Enlicitide 和 Icotrokinra 的上市具有里程碑意义
截至 2026 年,全球已有超过 50 个环肽获批上市,但 Enlicitide 和 Icotrokinra 的受关注程度远超此前任何环肽,原因在于它们在**三个维度上同时实现了"首次"突破**,彻底改变了环肽药物的能力边界:
**(1)此前上市的环肽绝大多数来自天然产物或其类似物,而非从头设计。** 过去 20 年获批的约 22 个环肽中,8/9 为天然产物来源(如 Vancomycin、Daptomycin、Cyclosporine A)或其结构类似物(如 Voclosporin、Linaclotide),仅 2021 年 Pegcetacoplan 为首个 de novo 噬菌体展示来源环肽——但仍需注射给药。Enlicitide 和 Icotrokinra 是**首批由 display 技术从头筛选、经理性优化后获批的口服环肽**,标志着环肽药物发现从"自然界馈赠"到"工程化设计"的范式转变完成临床验证。
**(2)此前上市的环肽几乎均需注射或局部给药,口服环肽极为罕见。** Cyclosporine A 虽口服但为偶然发现的天然产物,其口服性并非设计所得;Voclosporin 是其类似物。Enlicitide 和 Icotrokinra 是**首批通过系统性口服优化策略(多环刚性化 / 亲和力极致化 + 制剂增强)实现每日一次口服的 de novo 环肽**,证明环肽的口服生物利用度可以被"工程化设计"而非"碰运气"。
**(3)此前上市的环肽主要靶向胞外靶点(GPCR、离子通道、细胞壁),Enlicitide 和 Icotrokinra 首次将环肽口服给药推向了此前仅抗体可及的 PPI 靶点。** PCSK9 和 IL-23R 均为平坦 PPI 界面,小分子难以结合,此前仅有注射抗体(Evolocumab、Risankizumab 等)可用。Enlicitide 和 Icotrokinra 以 pM 级亲和力实现了抗体级疗效,同时口服给药——**填补了"抗体疗效 + 口服便利"这一长期空白**。
综上,此前上市的环肽解决了"有没有"的问题(天然产物提供了环肽的成药性证明),而 Enlicitide 和 Icotrokinra 解决了"能不能设计出来"的问题——从筛选到口服优化到制造,全链条工程化闭环首次完成临床验证。这正是行业高度关注的核心原因。
**两个里程碑药物的分子结构对比**(图 9):
Enlicitide (MK-0616)
Icotrokinra (JNJ-77242113)
三环大环肽 · MW ~1883 · mRNA display → 多环刚性化
单环二硫键富集肽 · MW ~1898 · 噬菌体展示 → 亲和力极致化
靶向 PCSK9(PPI 界面)· 20 mg QD 口服
靶向 IL-23R(PPI 界面)· 200 mg QD 口服
图 9|两个里程碑口服环肽药物的分子结构对比。左:Enlicitide(MK-0616),三环大环肽,通过醚键 + 双内酰胺三重化学交联锁定构象,从 mRNA display hit 经结构导向多环刚性化优化至 pM 级亲和力,代表"构象锁定"策略;右:Icotrokinra(JNJ-77242113),14 氨基酸单环二硫键富集肽(Pen¹–Pen⁶ 二硫键成环),通过噬菌体展示筛选后亲和力提升 >1,000 倍至 Kd 7.1 pM,代表"亲和力极致化"策略。两者分子量相近(~1900)、靶点类型相似(平坦 PPI 界面)、给药方式相同(每日一次口服),但成环策略截然不同——正是这种"殊途同归"验证了环肽口服优化的工程化可设计性。(左图来源:Merck 团队,Circulation, 2023;右图来源:GlpBio 结构数据库,基于 Fourie 团队 Sci Rep, 2024)
5.1 靶点背景
PCSK9 于 2003 年被发现,人类遗传学迅速确立其作为降脂靶点:功能获得性突变导致家族性高胆固醇血症,功能丧失性突变携带者 LDL-C 降低 28% 且冠心病风险下降,机制为 PCSK9 结合 LDLR 并促其溶酶体降解,抑制 PCSK9 即可保护 LDLR,已有抗体(Evolocumab 等)和 siRNA(Inclisiran)均需注射,他汀部分患者不耐受或不能达标。IL-23 于 2000 年被鉴定,通过 IL-23R/STAT3 维持 Th17 细胞驱动银屑病,抗 IL-23/IL-17 抗体(Ustekinumab、Risankizumab 等)PASI 90 达 70–80% 但均需注射,口服小分子(Apremilast、Deucravacitinib)疗效不及。两个靶点的共同痛点是生物制剂疗效优异但需注射、PPI 界面平坦小分子难结合——正是环肽的理想空间。
5.2 发现历程:两条技术路线的平行突破
**筛选起点**。Enlicitide 始于 Merck 用 mRNA display 筛选 ≥10^13 大环肽文库,引入 5F-Trp 等非天然氨基酸,获得低 μM 级 hit(5F-Trp4 锚定 PCSK9 浅口袋)(图 10)。[1]
图 10|基于 Ra Pharma 平台的环肽库 mRNA 展示筛选与 DBX 介导交联成环的技术流程:嘌呤霉素偶联 mRNA-肽融合体经 DBX 双巯基交联固化后进行多轮亲和力富集,从 ≥10^13 文库中命中 PCSK9 结合环肽。(来源:Tucker 团队,J Med Chem, 2020) Icotrokinra 始于 Protagonist 的 Vectrix™ 平台——噬菌体展示二硫键富集肽(DRP),二硫键骨架预组织构象如"微抗体",2017 年 J&J 合作初衷是开发肠道限制性 PTG-200(口服不吸收,治 IBD),并非全身性药物。**优化策略**方面,Enlicitide 走结构导向多环刚性化:晶体结构揭示大环"甜甜圈"构象后,先引入 Pro-Thr 解决蛋白酶敏感性,再通过 RMCM 形成第二环(Ki 0.39 nM,熵效应驱动),最后点击化学形成第三环(Ki 0.0094 nM,9.4 pM,接近抗体级),两个环化协同——RCM 预组织构象后点击环才锁定最优态,辅以内酰胺钉、PEG 侧链等优化 PK 和溶解度(图 11)。[2] Icotrokinra 走亲和力极致化:策略从"利用不吸收"转向"克服不吸收",基于 PTG-200 骨架将亲和力提升 >1,000 倍至 Kd 7.1 pM,同时优化代谢稳定性(24h 蛋白酶处理后 84–100% 存活)和膜通透性(侧链屏蔽极性表面),最终 IC50 = 5.6 pM。两种策略异曲同工:Enlicitide 用化学交联环锁定构象降低熵 penalty,每环提升 10–40 倍;Icotrokinra 用二硫键骨架预组织,通过 >1,000 倍亲和力弥补暴露量不足,核心都依赖构象刚性化。**临床验证**方面,Enlicitide 2026 年 7 月 16 日获批,首个口服 PCSK9 抑制剂,20 mg QD,Ph3 中 LDL-C 降 56–59%。[3] Icotrokinra 2026 年 3 月获批,首个口服 IL-23R 拮抗剂,200 mg QD,Ph3 ICONIC 全部终点优于 Deucravacitinib,正与 Ustekinumab 头对头,两条技术路线同年抵达终点,是展示筛选 + 口服优化整体成熟的结果。**制造创新**方面,Enlicitide 三环结构使传统合成约 70 步,Merck 开发五片段模块化组装 + 13 酶生物催化级联实现公斤级生产(Science 2026),[4] 是复杂大环肽制造范式突破。**启示**:mRNA display 优势在 hit 质量(含非天然氨基酸即代谢稳定),DRP 优势在天然二硫键预组织;多环刚性化与亲和力极致化是口服环肽的两条可行路径;策略转向(Icotrokinra 从肠道限制到全身口服)是认知跃迁;生物催化制造是商业化门槛。
图 11|全三环大环肽抑制剂 35 结合于 PCSK9 靶蛋白表面的 1.27 Å 超高分辨率复合物晶体结构:内部三唑/烯烃多重环化通过极致的构象锁定,完全依靠消除结合时的构象熵损失实现皮摩尔级活性跨越提升。(来源:Tucker 团队,J Med Chem, 2021)
5.3 HS-20118(AVR-001)— 翰森制药 → Avere
翰森制药自主研发的口服环肽 IL-23R 拮抗剂,与 Icotrokinra 同靶点但分子结构不同,核心差异化在于半衰期约 100 小时实现**每周一次**口服给药——从"能口服"到"口服更便捷"的进化。Ib 期银屑病数据:仅给药 4 周,第 8 周仍维持 PASI 75 应答,显示超长药效学活性。2026 年 7 月翰森授予 Avere 全球权益(ex-China),首付 $1.2 亿 + 里程碑 $21.8 亿;Avere 与 NextCure 合并,3.2 亿美元私募融资。意义:中国药企自主开发口服环肽并对外授权的原始创新;每周一次说明环肽 PK 工程化仍有大幅优化空间;$21.8 亿交易验证口服环肽商业价值。
**临床管线全景**
药物
公司
靶点
给药
阶段
特色
Enlicitide
Merck
PCSK9
口服 QD上市
mRNA display 首个上市
Icotrokinra
J&J
IL-23R
口服 QD上市
display 来源首个上市
HS-20118
翰森→Avere
IL-23
口服 QW
Ph2b/3
每周一次,超长半衰期
Zelenectide
Bicycle
Nectin-4
IV
Ph2/3
双环肽 BDC
Nuzefatide
Bicycle
EphA2
IV
Ph1/2
双环肽 BDC
Sulanemadlin
Aileron
MDM2/MDMX
IV
Ph2
钉合肽(Verdine 谱系)
Zolucatetide
Parabilis
β-catenin
口服
Ph1/2
Helicon 肽(Verdine 谱系)
表 2|环肽临床管线全景:截至 2026 年,Enlicitide 和 Icotrokinra 已获批上市,HS-20118 等后继分子持续拓展给药频率和靶点边界。
6. 已上市环肽药物的历史脉络
截至 2026 年,超过 50 个环肽获全球监管机构批准,过去 20 年上市约 22 个,近年加速明显:2001–2015 年间约 9 个获批,8/9 为天然产物或类似物,仅 1 个 first-in-class;2016–2023 年间约 13 个获批,天然产物优化为主,首个 de novo display 来源(Pegcetacoplan 2021);2024–2026 年 Enlicitide 和 Icotrokinra 连续获批,标志着 de novo display 来源口服环肽上市的里程碑。关键转折在于 2021 年 Pegcetacoplan 成为首个 de novo 噬菌体展示来源环肽上市,2026 年 Enlicitide 和 Icotrokinra 连续获批标志着 de novo 设计的口服环肽正式进入主流(图 12)。
图 12|过去二十年获批环肽药物的结构分类与靶点分布全景:从天然产物来源的抗菌环脂肽到 GPCR 靶向二硫键富集肽,再到 de novo display 来源的口服大环肽,展现了环肽药物从自然馈赠到理性设计的范式演进。(来源:陈时宇团队,RSC Chem Biol, 2022)
环肽 vs 小分子 vs 抗体
特性
小分子
环肽
抗体
MW
<500
500–2000
~150,000
靶向 PPI
困难优势
优势
口服
优势可能
不可能
细胞穿透
优势可能
不可能
组织穿透
优势优势
有限
制造成本
低中等
高
免疫原性
低低
可能
表 3|环肽 vs 小分子 vs 抗体三大药物模态对比:环肽是唯一能同时满足高亲和力、口服、可能透膜和可规模化制造的模态。
环肽的独特价值在于:它是唯一能同时满足"高亲和力(pM 级)+ 口服 + 可能透膜 + 可规模化制造"的药物模态。
关键判断
环肽能快速上市的本质,是**六大驱动力协同成熟**形成的"技术飞轮":一是展示筛选技术成熟,mRNA display / 噬菌体展示库容 10^12–10^15,数周获 nM 级 hit;二是口服生物利用度突破,N-甲基化、多环刚性化、制剂增强系统化;三是 AI 从头设计,AfCycDesign、RFpeptides 实现原子精度环肽 binder 设计;四是 bRo5 类药性准则,超越 Lipinski 五规则建立环肽理性设计基础;五是合成与制造突破,模块化片段组装 + 13 酶生物催化公斤级生产;六是 PPI 靶点需求拉动,平坦 PPI 界面是环肽的"主场",~450,000 个 PPI 仅 ~2% 有药物干预。Enlicitide 和 Icotrokinra 的获批是这一飞轮的**首个临床验证**,HS-20118 的 $21.8 亿里程碑交易和 3.2 亿美元私募融资是资本市场的**首个商业验证**。未来 3–5 年,AI 设计环肽、口服胞内靶点环肽、双环肽放射性药物有望进一步验证和扩展这一趋势。
核心文献
**§1 展示筛选技术**
Alleyne C et al. Cyclic Peptide PCSK9 Inhibitors from mRNA Display. J Med Chem, 2020. DOI: 10.1021/acs.jmedchem.0c01084
Screening macrocyclic peptide libraries by yeast display. Nat Commun, 2025. DOI: 10.1038/s41467-025-60907-x
**§2 口服生物利用度**
White TR et al. On-resin N-methylation for orally bioavailable scaffolds. Nat Chem Biol, 2011. DOI: 10.1038/nchembio.664
Drug-likeness of cyclic peptides beyond Rule of 5 (bRo5 准则). EPS 2024, 2024. DOI: 10.17952/37EPS.2024.P1243
PEGASUS: Unlocking polarity in cell-permeable cyclic peptides using AI. J Med Chem, 2025. DOI: 10.1021/acs.jmedchem.5c01836
MultiCycPermea: multimodal image-sequence model for cyclic peptide permeability. BMC Biol, 2025. DOI: 10.1186/s12915-025-02166-2
C2PO: ML-powered optimizer of cyclic peptide membrane permeability. J Cheminform, 2025. DOI: 10.1186/s13321-025-01109-x
**§3 AI 从头设计**
AfCycDesign. Nat Commun, 2025. DOI: 10.1038/s41467-025-59940-7
RFpeptides: Accurate de novo design of high-affinity protein-binding macrocycles. Nat Chem Biol, 2025. DOI: 10.1038/s41589-025-01929-w
**§4–5 合成制造与里程碑药物**
Tucker TJ et al. Next-Gen Tricyclic Peptide PCSK9 Inhibitors. J Med Chem, 2021. DOI: 10.1021/acs.jmedchem.1c01599
Johns DG et al. MK-0616 Clinical PK/PD. Circulation, 2023. DOI: 10.1161/CIRCULATIONAHA.122.063372
Merck: Biocatalytic synthesis of enlicitide. Science, 2026. DOI: 10.1126/science.aed8713
**§6 历史脉络与综述**
Biron E et al. Cyclic peptide drugs approved 2001–2021. RSC Chem Biol, 2022. DOI: 10.1039/d1cb00154j → [[Chen Shiyu, et al._2025_RSC Chem Biol_Cyclic peptide drugs approved in the last two decades (2001–2021)_KEY-AZVNJAZS]]
环肽药物开发进展. 中国科学: 化学, 2025. DOI: 10.1360/ssc-2025-0183
2026-07-18
注射用苯磺酸瑞马唑仑属于苯二氮䓬类短效静脉镇静/麻醉药,国家管制精神药品。
基本信息
药理特点
作用靶点:选择性激动中枢GABAₐ受体,产生镇静、抗焦虑、遗忘、轻度催眠作用,几乎无明显镇痛效果。
超短效优势
起效极快:静脉推注后1分钟内迅速镇静;
代谢不依赖肝脏细胞色素酶,主要经组织酯酶水解代谢,肝肾负担小;
清除迅速、半衰期短,停药后苏醒快、宿醉感轻。
对比咪达唑仑:作用时间更短、可控性更强,术后嗜睡、头晕发生率更低。
临床适应症
诊断操作镇静:胃肠镜、支气管镜、宫腔镜、介入穿刺等短时微创检查镇静;
手术麻醉诱导:全身麻醉诱导给药,常搭配阿片类镇痛药、肌松药;
ICU短期机械通气镇静(限短程使用)。
用法:仅静脉给药,分负荷剂量 + 维持微量泵输注;根据年龄、体重、肝肾功能、联用阿片/丙泊酚调整剂量,老年、体弱患者需大幅减量。
不良反应
呼吸系统(最危险):剂量过高、联用阿片类易出现呼吸抑制、血氧下降、呼吸暂停;
循环系统:一过性血压轻度下降、心率波动;
中枢:苏醒期躁动、恶心呕吐、头痛、短暂顺行性遗忘;
过敏:罕见皮疹、喉头水肿。
禁忌人群:对瑞马唑仑、苯二氮䓬类或制剂辅料过敏者;急性闭角型青光眼;未控制的严重呼吸功能不全、睡眠呼吸暂停重度患者(无呼吸机监护禁用)。
联用风险:与芬太尼、舒芬太尼、吗啡等阿片类合用,会协同加重呼吸、循环抑制,需减量并全程备吸氧、喉镜、呼吸机、氟马西尼。
特异性拮抗剂
氟马西尼:苯二氮䓬受体竞争性拮抗药,发生严重呼吸抑制、过度镇静时静脉解救;拮抗后可能再次镇静,需持续监护30分钟以上。
特殊人群
老年人:敏感性升高,起始剂量减半,缓慢推注;
肝肾功能不全:无需大幅调整剂量(独特酯酶代谢途径),但重度衰竭仍需严密监护;
孕妇、哺乳期:仅危及生命时权衡使用,哺乳期用药暂停哺乳;
儿童:内镜镇静、麻醉诱导有适配剂量方案,严格按体重计算。
注射用苯磺酸瑞马唑仑 VS 注射用甲苯磺酸瑞马唑仑
上市情况
研发主体:德国PAION AG 原研,2012年宜昌人福买断中国区全部开发、注册、销售权益;2024年人福医药完成收购PAION,拥有该品种全球完整权益。
日本:2020 年1月(商品名:Rozerem/Paion相关商品)。
美国:2020年10月获批,商品名Byfavo。
欧盟/英国/韩国:2021年后陆续获批,覆盖内镜镇静、全麻诱导维持。
中国:国内原研(宜昌人福,商品名:锐马®,化药1类新药)
2018.11:提交上市申请,获优先审评人福药业;
2020.07:国内首次获批上市,规格 25mg,适应症为结肠镜检查镇静;
2022.03:新增适应症全身麻醉诱导和维持(25mg);
2022.06:新增50mg规格;
2022.07:25mg规格新增支气管镜诊疗镇静;
2025.04:50mg规格增补支气管镜镇静适应症;
2025.08:新增重磅适应症ICU机械通气短期镇静。
获批适应症:非气管插管手术/操作镇静麻醉(胃肠镜、宫腔镜、介入等);全身麻醉诱导与维持;支气管镜诊疗镇静;ICU重症机械通气短期镇静。
规格:25mg、50mg冻干粉针
管制:第二类精神药品,医疗机构专用,严格管控。
国内仿制药进展
2026-07-14,成都苑东生物国内首家仿制药获批(化学药品4类),规格为25mg,获批适应症为非气管插管操作镇静、全麻诱导维持。
注册与受理信息
临床试验信息
专利情况
原研PAION苯磺酸瑞马唑仑晶型专利2027年到期、制剂专利2033年到期,是仿制核心壁垒。苑东生物通过自有新晶型专利实现专利规避,为国内唯一获批苯磺酸仿制药企业。
原研PAION/人福医药核心授权专利
1. 晶型核心专利(药品衍生物 - 晶型,授权有权)
1)晶型专利CN104059072A/B:2007-07-10申请,2027-07-10到期,专利权人为英国PAION、人福创新研发中心,保护短效苯并二氮䓬苯磺酸盐(苯磺酸瑞马唑仑)、多晶型、制备方法。
2)晶型专利CN104059071A/B:2007-07-10申请,2027-07到期,保护苯磺酸瑞马唑仑晶型、制备工艺。
3)晶型专利CN10501019B/A:2007-07-10申请,2027-07到期,保护苯磺酸瑞马唑仑多晶型。
2. 组合物专利(授权有权):CN104968348A/B,2013-05-22申请,2033-05-22到期,权利人为英国PAION、人福,保护含苯磺酸瑞马唑仑的药物组合物(注射冻干粉制剂体系)。
3. 原料药制备方法专利(宜昌人福,授权有权):CN114903904A/B,2021-02-08申请,2041-02-08到期,权利人为宜昌人福药业,保护苯磺酸瑞马唑仑原料药盐析、晶型纯化制备工艺。
4. 仿制药企业授权专利:CN114478535A/B(晶型制备方法专利,授权有权),2021-11-23申请,2042-04-22到期,权利人为成都苑东生物,保护苯磺酸瑞马唑仑晶型制备方法(规避原研晶型专利的新晶型路线)。
5. 苯磺酸瑞马唑仑检测分析专利:CN114624351A,2020-12-14申请,2040-12-14到期 ,权利人为宜昌人福,保护苯磺酸瑞马唑仑手性杂质 (R)-(+)-1 - 氨基 - 2 - 丙醇检测分析方法。中间体/合成工艺授权专利
宜昌人福:医药中间体专利CN116253761A(实审中),保护瑞马唑仑C-8磷酸化中间体合成方法。
上海再启生物:中间体工艺专利CN115626913A/B(授权有权),保护瑞马唑仑关键中间体制备。
浙江药科:中间体合成方法CN117447393A(公开审中),未授权。给药/适应症用途专利
天津医科大学:药物新用途专利CN114588164A(授权有权),保护瑞马唑仑预防围术期低温、维持术中体温的新用途。
PAION:适应症新用途专利CN121969363A(公开审中),保护:瑞马唑仑儿科镇静用途。
LTS 罗曼 + PAION:新型给药制剂专利CN120302962A(公开审中),保护瑞马唑仑口腔粘膜递送给药组合物。
其他药品分享链接如下,欢迎点击查看:
Ormeloxifene OTF慢性体重管理的新型药物-Tirzepatide新型的非阿片类小分子镇痛药-Suzetrigine奥麦利昔芬口腔薄膜立项调研报告纳米技术双氯芬酸乳胶剂药学研究2025年9月药品批准信息快讯(八)——利斯的明透皮贴剂分享2025年9月药品批准信息快讯(九)——米托坦片分享CDE-《化学仿制药参比制剂目录(第一百批)》(征求意见稿)[附: 药品分享——阿达苏(洛沙平吸入剂)]药品分享-塞来昔布盐酸曲马多片药品分享——伐莫洛龙口服混悬液【药品分享】盐酸菲优拉生片【药品分享】拉坦噻吗滴眼液【药品分享】Baxdrostat 片【药品分享】Omecamtiv Mecarbil缓释片【药品分享】曲地匹坦(Rolapitant)【药品分享】Zasocitinib 胶囊【药品分享】甲磺酸阿帕替尼片【药品分享】巴氯芬口服溶液【药品分享】奥德昔巴特胶囊【药品分享】扎维吉泮鼻喷雾剂【药品分享】左羟丙哌嗪糖浆【药品分享】利丙双卡因凝胶贴膏【药品分享】司来吉兰改良型新药(缓释片)【药品分享】复方甘菊利多卡因凝胶【药品分享】盐酸索安非托片【药品分享】地塞米松口溶膜【药品分享】盐酸来罗西利片【药品分享】马来酸噻吗洛尔凝胶【药品分享】褪黑素颗粒【药品分享】罗氟司特乳膏【药品分享】盐酸芬戈莫德胶囊【药品分享】示踪用盐酸米托蒽醌注射液【药品分享】美洛昔康纳米晶注射液【药品分享】Clascoterone 5%外用溶液【药品分享】马来酸依那普利口服溶液【药品分享】注射用双氯芬酸钠利多卡因【药品分享】马来酸依那普利叶酸片—复方降压药【药品分享】依曲帕米鼻喷雾剂—用于治疗成人阵发性室上性心动过速的可自行给药鼻喷雾剂【药品分享】奥卡西平口服混悬液—一款可用于儿童的钠通道调节类抗癫痫药【药品分享】泊沙康唑口服混悬液——一种常用的抗真菌药物【药品分享】舒沃替尼片【药品分享】依伏卡塞片——第二代口服拟钙剂【药品分享】西诺氨酯片——第三代抗癫痫发作药物【药品分享】匹妥布替尼片——非共价可逆 BTK 抑制剂(用于复发 / 难治套细胞淋巴瘤(MCL))【药品分享】贝美前列素【产品分享】达普司他片
【药品分享】水合氯醛糖浆——镇静催眠药
【产品分享】苏沃雷生(Suvorexant)——全球首个食欲素受体拮抗剂类催眠药
【药品分享】贝沙罗汀
【药品分享】地夫可特干混悬剂——一种糖皮质激素类药物
【药品分享】伊卢多啉片——治疗成人腹泻型肠易激综合征(IBS‑D)的首创口服阿片受体调节剂
【药品分享】卢美哌隆胶囊——一种新型的非典型抗精神病药物
【药品分享】奥氟格列隆片——口服非肽类小分子 GLP-1 受体激动剂
【药品分享】苯磺酸克利加巴林胶囊——一种新型的治疗神经病理性疼痛的药物
【药品分享】苯磺酸美洛加巴林片——治疗周围神经病理性疼痛(PNP)的第三代钙离子通道调节剂
【药品分享】Iberdomide胶囊——一款新一代cereblon(CRBN)E3连接酶调节剂(CELMoD)化合物
【药品分享】酒石酸伐尼克兰鼻喷雾剂——一种用于治疗干眼症的西药
【药品分享】赛沃替尼片——中国首个获批的高选择性 MET 酪氨酸激酶抑制剂
【药品分享】盐酸阿夫唑嗪缓释片——一种用于治疗良性前列腺增生(BPH) 的 α1 - 受体阻滞剂
【药品分享】索格列净片——全球首个获批的SGLT1/SGLT2 双重抑制剂
【药品分享】奥吡卡朋胶囊——新一代的儿茶酚-氧位-甲基转移酶抑制剂(COMT)
【药品分享】奎扎替尼片——一种口服高选择性 FLT3 抑制剂
【药品分享】硫酸拉罗替尼胶囊 / 口服溶液——全球首个高选择性口服 TRK 抑制剂
【药品分享】司帕生坦片——成人IgA肾病领域首个非免疫抑制疗法
【药品分享】黄体酮阴道栓剂/阴道缓释凝胶剂——主要用于辅助生殖技术(ART)中的黄体支持
【药品分享】替戈拉生片——首款国产钾离子竞争性酸阻滞剂类药物(P-CAB)
【药品分享】拉坦前列烯酯滴眼剂——一种新型眼科用药
【药品分享】布比卡因脂质体注射液——一种长效局部麻醉药
【药品分享】甲磺酸加诺沙星片——一种喹诺酮类抗菌药
【药品分享】磷酸芦可替尼乳膏——中国首款且唯一获批的白癜风治疗靶向药
【药品分享】甲磺酸洛美他派胶囊——全球唯一口服MTP抑制剂
【药品分享】依达拉奉口服混悬液——肌萎缩侧索硬化症(ALS,渐冻人症)新药
【药品分享】依达拉奉右莰醇舌下片——全球卒中领域首个获FDA突破性疗法认定的舌下脑保护剂
【药品分享】马来酸氟诺替尼片——JAK2/FLT3/CDK6 三靶点抑制剂
【药品分享】普拉替尼胶囊——国内首个获批的高选择性 RET(转染重排)酪氨酸激酶抑制剂
【药品分享】右美托咪定舌下膜——新型 α₂肾上腺素受体激动剂舌下膜剂
【药品分享】卡匹色替片——全球首个获批上市的AKT抑制剂
【药品分享】库莫西利胶囊——全球首个CDK2/4/6抑制剂
【药品分享】赛贝曲司他片——全球首个HAE急性发作口服疗法
【药品分享】KYGEVVI(Doxecitine/Doxribtimine)——全球首款且唯一获批的TK2d针对性治疗药物
【药品分享】Forzinity(Elamipretide)注射剂——全球首个用于治疗Barth综合征的药物
【药品分享】Brinsupri(Brensocatib, 布伦索卡替布)片——全球首个获批上市的二肽基肽酶1(DPP-1)抑制剂
【药品分享】维立西呱片——全球首个心衰适应症的可溶性鸟苷酸环化酶(sGC)刺激剂
【药品分享】盐酸哌罗匹隆片——非典型抗精神病药
【药品分享】盐酸托泊替康胶囊/注射用盐酸托泊替康——经典的拓扑异构酶Ⅰ抑制剂类抗肿瘤药
【药品分享】阿普昔腾坦片——全球首个获批用于难治性高血压的口服双重内皮素受体拮抗剂(ERA)
【药品分享】注射用盐酸依拉环素——全球首个氟环素类抗生素
【药品分享】奥洛格列净胶囊——国内首款抑制SGLT1与SGLT2的1类创新药
【药品分享】盐酸匹米替尼胶囊——国内首个、全球首个获批的腱鞘巨细胞瘤(TGCT)系统性靶向药,高选择性CSF-1R抑制剂
【药品分享】布地奈德肠溶胶囊——全球首个、中国唯一获批用于原发性IgA肾病对因治疗的靶向药物
【药品分享】艾拉莫德片——中国原研、全球首个上市的小分子抗风湿药(csDMARD)
【药品分享】索托克拉片——新一代BCL2抑制剂
【药品分享】利奈昔巴特片——口服、选择性、可逆性回肠胆汁酸转运体(IBAT/ASBT)抑制剂
【药品分享】多替诺雷片——高选择性URAT1抑制剂
【药品分享】瑞普泊肽片——口服GLP‑1/GIP双靶点激动剂
【药品分享】硫酸索西美雷塞片——口服、强效的KRAS G12C共价抑制剂
【药品分享】罗伐昔替尼片——全球首创JAK/ROCK双靶点口服小分子抑制剂
【药品分享】埃诺格鲁肽注射液——全球首个获批上市的cAMP偏向型长效GLP-1受体激动剂
【药品分享】维培那肽注射液——长效GLP-1受体激动剂
【药品分享】普乐司兰钠注射液——全球首个靶向APOC3 mRNA的siRNA降脂药
【药品分享】玛仕度肽注射液——全球首个GCG/GLP-1双激动剂
【药品分享】瑞米布替尼片——全球首个获批用于CSU的口服靶向药
【药品分享】溴莫尼定噻吗洛尔滴眼液——α₂受体激动剂与非选择性 β 受体阻滞剂组成的复方降眼压药
【药品分享】吡洛西利片——国内首个CDK2/4/6多靶点抑制剂
【药品分享】奥氟格列隆片(Orforglipron) ——中国首个、全球首批上市的口服小分子 GLP-1受体激动剂
【药品分享】Copper Histidine注射液(Zycubo)——全球首个、唯一用于治疗儿童门克斯病(Menkes disease)的铜替代注射剂
【药品分享】依来格列隆片(Elecoglipron)——口服小分子非肽类GLP-1受体激动剂
【药品分享】阿利奈普仑(Aleniglipron)——口服小分子、非肽类、偏向性GLP-1受体激动剂
【药品分享】甲磺酸阿美替尼片——中国首个原研三代EGFR酪氨酸激酶抑制剂(TKI)
【药品分享】甲磺酸达麦利替尼片——口服高选择性c-MET酪氨酸激酶抑制剂
【药品分享】盐酸Acoramidis片——转甲状腺素蛋白(TTR)稳定剂
【药品分享】阿莫西林伏诺拉生胃漂浮片——3D打印胃漂浮片
【药品分享】盐酸伊可白滞素片——全球首创口服IL‑23受体拮抗剂
【药品分享】马来酸吡咯替尼片——中国首个自研的HER1/HER2/HER4不可逆酪氨酸激酶抑制剂(TKI)
【药品分享】本维莫德乳膏——全球首创芳香烃受体(AhR)调节剂(TAMA)类皮肤病外用药
【药品分享】盐酸莫托咪酯注射液——化药1类静脉麻醉新药
【药品分享】注射用罗哌卡因微晶——长效缓释局部麻醉药
【药品分享】盐酸伊立替康脂质体注射液——一款针对吉西他滨治疗失败的转移性胰腺癌的二线标准脂质体化疗药
【药品分享】甲磺酸氟马替尼片——Bcr-Abl酪氨酸激酶选择性抑制剂
【药品分享】注射用阿加糖酶β——国内获批的首个用于治疗法布雷病的药物
【药品分享】甲苯磺酸尼拉帕利胶囊——高选择性PARP1/2抑制剂
【药品分享】帕米帕利胶囊——强效、选择性PARP1/2抑制剂
【药品分享】苯环喹溴铵鼻喷雾剂——选择性M胆碱能受体拮抗剂
【药品分享】注射用拉罗尼酶浓溶液——MPS Ⅰ型的特异性酶替代治疗药物
【药品分享】海博麦布片——国产自主原研的胆固醇吸收抑制剂
【药品分享】盐酸可洛派韦胶囊——直接抗病毒药物(DAA)→ NS5A抑制剂
【药品分享】克拉考特酮乳膏——外用、非甾体、选择性雄激素受体(AR)抑制剂
【药品分享】非卢替尼片——全球首个用于多发性硬化的口服BTK抑制剂
【药品分享】Brenipatide注射液——GLP-1R/GIPR双受体激动剂(继替尔泊肽之后的第二款)
【药品分享】罗赛促红素α注射液——国产首个长效重组促红细胞生成素(EPO)创新药
【药品分享】贝组替凡片——全球首个口服小分子HIF-2α抑制剂
【药品分享】那米司特片——口服选择性PDE4B抑制剂
【药品分享】富马酸立康可泮胶囊——一款针对罕见病PNH的口服补体B因子抑制剂
【药品分享】醋酸索乐匹尼布片——高选择性脾酪氨酸激酶(Syk)抑制剂
【药品分享】甲磺酸艾多替尼片——全球首款专为肺癌脑转移设计的第三代EGFR-TKI
【药品分享】安瑞克芬注射液——全球首个获批镇痛适应症的高选择性外周κ-阿片受体(KOR)激动剂
【药品分享】Difelikefalin注射液——全球首个获批的外周选择性κ-阿片受体(KOR)激动剂
【药品分享】Obefazimod——口服、靶向 CBC、特异性增强miR-124的首创小分子
【药品分享】拉尼兰诺片——口服泛PPAR激动剂
【药品分享】舒洛地特注射液——抗血栓药、血管保护剂
【药品分享】贝普若韦生注射液——反义寡核苷酸(ASO)类乙肝新药
【药品分享】氨酚右敏口服溶液(奥肯能®)——中国内地唯一获批的氨酚右敏口服溶液
【药品分享】佩玛贝特片——新型过氧化物酶体增殖物激活受体α/δ双重激动剂 (PPARα/δ)
【药品分享】盐酸依匹斯汀乳膏——外用第二代非镇静抗组胺抗过敏药膏
【药品分享】注射用双羟萘酸帕瑞肽微球——一款用于治疗肢端肥大症的第二代长效生长抑素类似物(SRL)微球制剂
【药品分享】埃拉菲布拉诺片——治疗原发性胆汁性胆管炎(PBC)的口服靶向新药
【药品分享】泽卢克布仑钠注射液——新一代皮下注射型C5补体抑制剂
【药品分享】依达拉奉右莰醇注射用浓溶液——一款复方神经保护类注射剂
【药品分享】醋酸戈那瑞林注射液——促性腺激素释放激素(GnRH)类药物
【药品分享】甲磺酸贝舒地尔片——全球首个选择性ROCK2激酶抑制剂
【药品分享】伊托法替布软膏——外用JAK抑制剂(JAK1/JAK3)
【药品分享】注射用华卟啉钠——新型肿瘤光动力治疗(PDT)专用光敏剂
【药品分享】优替德隆胶囊——口服埃博霉素类微管抑制剂
【药品分享】艾普美妥司他片——EZH1/2双靶创新药
【药品分享】精氨酸艾曲莫德片——新型选择性鞘氨醇1-磷酸受体(S1P₁)调节剂
【药品分享】磷酸芦可替尼乳膏——全球/国内首款、唯一获批用于非节段型白癜风复色的外用JAK1/JAK2选择性抑制剂
【药品分享】盐酸右哌甲酯缓释胶囊——治疗6岁及以上注意缺陷多动障碍(ADHD)的一线药物
【药品分享】抗菌肽PL-3301口腔凝胶——中国首创的抗菌肽类抗口腔真菌感染药物
【药品分享】Zasocitinib (TAK-279) 胶囊——新一代高选择性口服 TYK2 抑制剂
【药品分享】注射用Abelacimab——一款全人源IgG1单克隆抗体,靶向凝血因子XI(FXI)
【药品分享】Duvakitug注射液——首创性人源化IgG1-λ2单克隆抗体,靶向TL1A(TNFSF15)
【药品分享】醋酸氟轻松/氢醌/维A酸乳膏——治疗中重度黄褐斑疗效明确的外用复方
【药品分享】富马酸伏诺拉生氯化钠注射液——钾离子竞争性酸阻滞剂(P‑CAB)||东阳光药业研发的2.2,2.4类改良新型新药
【药品分享】盐酸阿曲生坦片——诺华研发的高选择性内皮素 A(ETA)受体拮抗剂||中国首个获批用于IgA 肾病的非免疫性口服靶向药
【药品分享】RGT-274-CR胶囊——上海齐鲁锐格医药研发的口服小分子GLP-1受体激动剂
【药品分享】酒石酸西尼必利片——高选择性5-HT₄受体激动剂类胃肠动力药
【药品分享】石杉碱甲控释片——采用双相控释/渗透泵技术的2.2类改良型新药
【药品分享】塞伐艾替尼片——口服、可逆、选择性酪氨酸激酶抑制剂(TKI)
【药品分享】Admilparant片——口服小分子LPA₁受体拮抗剂
【药品分享】瑞拉可兰胶囊——全球首个选择性糖皮质激素受体(GR)拮抗剂
【药品分享】盐酸依特卡肽注射液——全球首个、国内唯一获批的静脉注射型拟钙剂
【药品分享】Avacincaptad pegol玻璃体内注射液——全球首批用于AMD继发地图样萎缩(GA)的靶向药物
【药品分享】盐酸达利雷生片——新一代非管制、非苯二氮䓬类抗失眠药物
【药品分享】甲磺酸瑞索利塞片——高选择性PI3Kα小分子靶向抑制剂 || 全球首个获批用于特定卵巢癌的靶向新药
【药品分享】富马酸西他沙星注射液——新型喹诺酮类抗菌药物
【药品分享】Icotrokinra——全球首个获批的口服 IL-23 受体(IL-23R)选择性拮抗多肽
【药品分享】氘可来昔替尼片(Deucravacitinib)——全球首个口服、选择性 TYK2 变构抑制剂
【药品分享】柯美奇拜单抗注射液——鼻用糖皮质激素治疗后症状控制不佳的成人中重度季节性过敏性鼻炎患者的福音
【药品分享】吉诺昔替尼——口服小分子JAK1/TYK2双重抑制剂
【药品分享】洛替拉纳(Lotilaner)——GABA 门控氯离子通道非竞争性拮抗剂 || 兼具兽医驱虫与人用眼科两大用途
【药品分享】CagriSema——由卡格列肽(cagrilintide)2.4 mg与司美格鲁肽(semaglutide)2.4 mg组成的强效减重复方药
【药品分享】苹果酸卡博替尼——口服、多靶点酪氨酸激酶抑制剂(TKI)
【药品分享】迪高替尼(Delgocitinib)——一款外用泛JAK抑制剂
【药品分享】拉氟莫司(Laflunimus)——口服免疫抑制剂 || 兼具免疫抑制与抗炎双重活性
【药品分享】伏昔尼布片——全球首个IDH1/IDH2双重突变抑制剂靶向药
【药品分享】盐酸奥昔布宁片——M受体抗胆碱药
【药品分享】贝泽昔替尼片——国内首款获批的高选择性JAK2单靶点抑制剂
【药品分享】苯甲酸安达艾替尼胶囊——新型小分子酪氨酸激酶不可逆抑制剂(EGFR-TKI)
【药品分享】伏欣奇拜单抗注射液——全人源抗IL‑1β单克隆抗体 || 用于急性痛风性关节炎的1类创新生物药
【药品分享】利多卡因丁卡因乳膏
【药品分享】伐米奇拜单抗注射液——玻璃体内注射用抗IL-6人源化单抗
【药品分享】依赛弗酶α注射液(Efzimfotase alfa 注射液)——第二代重组组织非特异性碱性磷酸酶(TNSALP)酶替代疗法
【药品分享】格达托利西布(Gedatolisib)——first‑in-class 泛 PI3K/mTORC1/2 双重抑制剂
【药品分享】伯瑞替尼肠溶胶囊——中国原研、高选择性c-MET小分子抑制剂 || 首个获批MET扩增NSCLC单药治疗的靶向药
【药品分享】力胜克拉片——中国首个申报上市的原研Bcl-2抑制剂、全球第二款Bcl-2抑制剂
【药品分享】BGM0504注射液——GLP-1/GIP 双受体激动剂
【药品分享】塞利尼索片——全球首个口服选择性核输出蛋白XPO1抑制剂
【药品分享】Seltorexant薄膜包衣片——选择性食欲素2受体(OX2R)高选择性拮抗剂
【药品分享】盐酸埃克替尼片——国内首个自主研发的一代EGFR-TKI
【药品分享】盐酸伊普可泮胶囊——全球首个口服补体B因子抑制剂
【药品分享】恩考芬尼胶囊——靶向BRAF V600突变的口服激酶抑制剂
【药品分享】Enpatoran——口服、选择性TLR7/8小分子抑制剂
【药品分享】硝酸异康唑阴道片——抗真菌外用药物
【药品分享】Zorevunersen注射液——全球独家ASO上调蛋白表达技术
【药品分享】妥拉美替尼胶囊——全球首个针对NRAS突变黑色素瘤的MEK抑制剂
【药品分享】盐酸替那帕诺片——全球首创NHE3抑制剂类新型降磷药物
【药品分享】注射用莱古比星——新型蒽环类抗肿瘤药
【药品分享】优替德隆胶囊——口服埃博霉素类微管抑制剂
【药品分享】伊那利塞片——中国首个PIK3CA突变乳腺癌精准靶向药
【药品分享】呋喹替尼胶囊——中国首个自主研发VEGFR-TKI || VEGFR靶点靶向抗癌药
【药品分享】琥珀酸瑞波西利片——CDK4/6抑制剂
【药品分享】盐酸替那帕诺片——全球首个且唯一获批的肠道磷吸收抑制剂
【药品分享】芬布替尼片——口服、可逆、可透过血脑屏障的BTK抑制剂
【药品分享】炔丙基半胱氨酸胶囊——全球首个进入临床的硫化氢(H₂S)供体I类创新药
【药品分享】Balcinrenone达格列净胶囊——选择性盐皮质激素受体拮抗剂(MRA)+SGLT-2抑制剂
【药品分享】诺拉西班(Nolasiban)分散片——选择性口服催产素受体拮抗剂 || 早产二线/辅助治疗药物
【药品分享】塞多明基注射液——国内首款裸质粒基因治疗药物
【药品分享】鲁兹诺雷钠片——国产首个高选择性URAT1抑制剂
【药品分享】玛伐凯泰胶囊——全球首创、中国唯一获批的心肌肌球蛋白抑制剂
【药品分享】依托芬那酯凝胶——外用非甾体抗炎镇痛药
【药品分享】聚卡波非钙片——国际指南首选容积性缓泻剂
【药品分享】Mezigdomide胶囊——新一代IMiDs/cereblon E3泛素连接酶调节
【药品分享】洛布替尼片——全球首款共价+非共价双机制第四代 BTK 靶向药
【药品分享】奥莱泊肽注射液——PEG修饰长效GLP‑1单靶点激动剂
【药品分享】安瑞曲替尼胶囊 ——国内第二款国产二代NTRK广谱抗癌药
【药品分享】麦格司他胶囊——抑制葡萄糖神经酰胺合成酶的罕见病口服靶向药
【药品分享】乌帕替尼片(Upadacitinib)——选择性JAK1抑制剂
【药品分享】Dordaviprone胶囊——全球首款、目前唯一获批用于 H3 K27M 突变型弥漫性中线胶质瘤(DMG)的靶向药
【药品分享】屈昔多巴胶囊——去甲肾上腺素前体药物 || 帕金森、多系统萎缩、神经源性体位低血压一线对症用药
【药品分享】康特替尼颗粒——第二代ALK多靶点激酶抑制剂
【药品分享】盐酸兰诺可泮片——国产首个获批上市的补体因子B(CFB)抑制剂
【药品分享】Elinzanetant软胶囊——全球首款NK1/NK3双重神经激肽受体拮抗剂
【药品分享】Fosmanogepix注射液——全球首创(First-in-class)Gwt1抑制剂类抗真菌前药
【药品分享】Zorevunersen注射液——反义寡核苷酸药物
【药品分享】宗艾替尼片——高选择性不可逆HER2(ERBB2)酪氨酸激酶抑制剂(TKI)
【药品分享】甲苯磺酸他拉唑帕利胶囊——高选择性PARP抑制剂
【药品分享】Bexicaserin口服溶液——选择性5-HT2C受体激动剂口服液体制剂
【药品分享】醋酸伏诺拉生注射用浓溶液——钾离子竞争性酸阻滞剂(P-CAB)
【药品分享】甲苯磺酸依仑司群片——新一代口服选择性雌激素受体降解剂(SERD)
【药品分享】硫酸瑞美吉泮口崩片——CGRP 受体拮抗剂(降钙素基因相关肽)|| 偏头痛靶向特效药
【药品分享】阿托吉泮片——全球首款口服长效CGRP靶点预防偏头痛药物
【药品分享】乌布吉泮片——CGRP受体拮抗剂 || 第二代口服偏头痛急性期药物
【药品分享】扎维吉泮鼻喷雾剂——高选择性CGRP受体拮抗剂 || 全球唯一获批鼻喷CGRP吉泮类急性期药物
【药品分享】培来加南喷雾剂——全球首款上市加南类多肽抗菌药(FIC)
【药品分享】艾沙利酮片——高选择性非甾体醛固酮受体拮抗剂(MRA) || 全球首个上市的非甾体选择性MR拮抗剂
【药品分享】布美他尼鼻喷雾剂——全球首款、唯一鼻内给药袢利尿剂
【药品分享】注射用盐酸依拉环素——新型全合成氟环素类(四环素衍生物)静脉抗生素
【药品分享】舒瑞基奥仑赛注射液——全球首款实体瘤自体CLDN18.2靶向CAR-T细胞新药
【药品分享】盐酸环喷托酯滴眼液——儿童验光首选短效睫状肌麻痹剂之一
【药品分享】盐酸赛庚啶口服溶液——抗过敏抗组胺药
【药品分享】Rinzimetostat (ORIC-944)——口服选择性 EED别构型PRC2表观遗传抑制剂
【药品分享】Empasiprubart注射用浓溶液——全球首创靶向补体C2人源化IgG1清扫型单克隆抗体
【药品分享】阿更葡糖钠注射液——全球第二款、中国首款自主研发的环糊精类靶向肌松逆转剂
【药品分享】盐酸罗哌卡因缓释溶液——国产自主长效局麻缓释制剂 || 填补国内切口原位长效镇痛空白
【药品分享】Telisotuzumab Adizutecan 注射用粉末——抗c-Met抗体偶联药物(ADC)
【药品分享】L606 (曲前列尼尔脂质体吸入混悬液)——靶向肺动脉高压
【药品分享】佩米替尼片——选择性FGFR1/2/3酪氨酸激酶抑制剂
【药品分享】唑尼沙胺胶囊——磺酰胺类结构 || 广谱抗癫痫药,偏头痛预防
【药品分享】琥珀酸安维吖啶片——双靶点胆碱酯酶抑制剂
【药品分享】布莱昔替尼片(Bleximenib)——口服高选择性Menin-KMT2A相互作用抑制剂
【药品分享】利厄替尼片——第三代EGFR-TKI靶向药
免责声明:本文仅作医药信息传播分享,并不构成投资或决策建议。
2026-07-18
·KC桌面
KC桌面——外资精译
高盛:HK与BD与ILHansohPharma3692.
豪森药业(3692.HK)近期完成了一笔结构复杂的BD交易:将口服IL-23受体拮抗剂HS-20118(AVR-001)的大中华区外权益授权给一家名为Avere Therapeutics的新设公司,同时Avere完成3.2亿美元私募融资,并与纳斯达克上市公司NextCure进行全公司合并。GS在最新报告中指出,这笔交易的价值不仅在于分子本身,更在于其“NewCo+Merger”的出海架构——豪森以30-40%的股权比例保留了对管线未来价值的持续参与,而非一次性卖断。这种结构正在成为中国生物科技公司全球化布局中一个值得关注的模式。
1. 豪森用“NewCo+合并”结构,把一次性授权变成了持续持股
交易的核心不是首付款金额,而是结构设计。豪森与财务读者共同设立Avere,随后Avere完成由Fairmount领投的3.2亿美元融资,并与已有自身肿瘤管线的NextCure合并。与许多中国生物科技公司使用现金壳公司不同,NextCure是一家运营中的生物科技公司,拥有CDH6和B7-H4 ADC项目。合并完成后,豪森预计持有合并公司30-40%的股权。
这意味着豪森没有选择传统的首付+里程碑+销售分成的授权模式,而是通过股权锁定了未来价值创造的更大份额。GS提示,由于豪森的持股比例,交易可能面临CFIUS等监管审查,但审查的范围、时间和结果仍不确定。这笔交易也延续了豪森自2023年以来每年1-2笔BD交易的执行节奏。
KC评论: 这种结构的核心优势在于,当管线价值在海外市场兑现时,授权方不是只拿固定分成,而是以股东身份参与整体价值增长。但代价是流动性更低、退出路径更复杂,且需要承担合并后公司的运营不确定性。
2. 口服IL-23赛道有吸引力,但疗效天花板已经清晰
HS-20118是一款每周一次的口服IL-23受体拮抗剂,半衰期约100小时。根据公司公告,其PASI和PASI75应答率与强生每日一次的口服IL-23抑制剂icotrokinra大致相当。但GS通过跨试验数据对比指出,口服IL-23的疗效天花板已经显现:icotrokinra在16周时的PASI90应答率为50%,而注射用IL-23和IL-17生物制剂在关键研究中通常达到70-80%。
口服IL-23的商业化机会,最终取决于能否在疗效、安全性、便利性和定价之间提供足够有吸引力的平衡,而非仅靠便利性。HS-20118的每周一次给药和长半衰期可能在口服IL-23类别中提供差异化,但需要更多临床数据来确立其竞争定位。
3. 跨试验数据对比显示:口服与注射的疗效差距仍是核心挑战
GS在报告中附上了IL-23/IL-17靶向药物的临床数据对比表。以PASI90这一关键疗效指标为例:icotrokinra(口服IL-23)为50%,而司库奇尤单抗(IL-17A注射)为76.6%,古塞奇尤单抗(IL-23注射)为69%,
For informational purposes only. Portions may be generated, translated, summarized, or edited with AI assistance based on source materials and may contain omissions or errors. Please verify independently. This is not investment, legal, tax, accounting, or other professional advice.
Original report: 33-GS-Hansoh Pharma -3692.HK-- Continued BD execution- Out-licensed oral IL-23 through a NewCo-and-Merger structure-260714
更新信息参见ΚСⅾеѕk․сοm
引进/卖出抗体药物偶联物
100 项与 盐酸伊可白滞素 相关的药物交易
登录后查看更多信息
研发状态
批准上市
10 条最早获批的记录, 后查看更多信息
登录
| 适应症 | 国家/地区 | 公司 | 日期 |
|---|---|---|---|
| 斑块状银屑病 | 美国 | 2026-03-17 |
未上市
10 条进展最快的记录, 后查看更多信息
登录
| 适应症 | 最高研发状态 | 国家/地区 | 公司 | 日期 |
|---|---|---|---|---|
| 克罗恩病 | 申请上市 | 加拿大 | 2025-12-01 | |
| 溃疡性结肠炎 | 临床3期 | 美国 | 2025-10-01 | |
| 溃疡性结肠炎 | 临床3期 | 美国 | 2025-10-01 | |
| 溃疡性结肠炎 | 临床3期 | 中国 | 2025-10-01 | |
| 溃疡性结肠炎 | 临床3期 | 日本 | 2025-10-01 | |
| 溃疡性结肠炎 | 临床3期 | 日本 | 2025-10-01 | |
| 溃疡性结肠炎 | 临床3期 | 阿根廷 | 2025-10-01 | |
| 溃疡性结肠炎 | 临床3期 | 阿根廷 | 2025-10-01 | |
| 溃疡性结肠炎 | 临床3期 | 澳大利亚 | 2025-10-01 | |
| 溃疡性结肠炎 | 临床3期 | 澳大利亚 | 2025-10-01 |
登录后查看更多信息
临床结果
临床结果
适应症
分期
评价
查看全部结果
| 研究 | 分期 | 人群特征 | 评价人数 | 分组 | 结果 | 评价 | 发布日期 |
|---|
临床3期 | 731 | Placebo+JNJ-77242113 (Arm 1: Placebo Followed by JNJ-77242113 200 mg) | 顧繭網壓範築淵糧糧網 = 廠鬱繭衊淵網醖網襯鬱 壓觸衊遞艱膚窪構壓遞 (壓築壓蓋艱簾積鬱膚鏇, 夢廠壓衊窪憲積鑰簾壓 ~ 齋夢廠膚遞憲築淵繭遞) 更多 | - | 2026-06-25 | ||
(Arm 2: JNJ-77242113 200 mg) | 顧繭網壓範築淵糧糧網 = 廠積顧鏇築遞衊廠製衊 壓觸衊遞艱膚窪構壓遞 (壓築壓蓋艱簾積鬱膚鏇, 範壓願壓鏇襯蓋醖網鏇 ~ 鹹觸醖顧鑰簾積憲膚廠) 更多 | ||||||
临床3期 | 311 | placebo+JNJ-77242113 (Arm 1: Placebo) | 膚鏇衊選膚鑰壓糧窪網 = 糧淵鹹積鏇醖顧膚觸醖 廠衊鏇鹹觸艱鏇鹽鏇獵 (鹹淵窪網廠構選顧壓壓, 觸膚壓願艱壓製憲蓋廠 ~ 網糧膚觸鹹顧鏇衊鹽鹽) 更多 | - | 2026-06-25 | ||
(Arm 2: JNJ-77242113 200 mg) | 膚鏇衊選膚鑰壓糧窪網 = 齋壓窪齋簾餘製醖顧繭 廠衊鏇鹹觸艱鏇鹽鏇獵 (鹹淵窪網廠構選顧壓壓, 廠鹹積鑰糧艱構製鬱醖 ~ 鏇壓衊壓醖積衊繭積製) 更多 | ||||||
临床3期 | 774 | Placebo+JNJ-77242113 (Arm 1: Placebo Followed by JNJ-77242113 200 mg) | 淵築衊衊窪簾膚憲遞窪 = 齋膚憲繭蓋築鏇鹹範膚 壓齋積鹹鏇選廠蓋鹽醖 (齋鹹膚簾範醖鏇構遞窪, 網膚齋觸範獵衊蓋夢廠 ~ 簾鹽築範簾鏇齋獵繭選) 更多 | - | 2026-06-25 | ||
(Arm 2: JNJ-77242113 200 mg) | 淵築衊衊窪簾膚憲遞窪 = 觸鑰膚衊製糧襯範齋鹹 壓齋積鹹鏇選廠蓋鹽醖 (齋鹹膚簾範醖鏇構遞窪, 醖鬱廠夢憲鏇夢築範觸 ~ 壓艱獵製鹹襯鬱窪膚夢) 更多 | ||||||
临床3期 | 1,343 | 製顧壓積窪遞獵簾製餘(願艱齋餘鑰鬱願鹽齋構) = 鑰鹹簾襯夢蓋觸廠範鹹 壓窪醖鹹製淵膚鹽網襯 (顧醖顧積築願夢顧構顧 ) 更多 | 积极 | 2026-06-11 | |||
Placebo | 製顧壓積窪遞獵簾製餘(願艱齋餘鑰鬱願鹽齋構) = 醖壓憲糧遞製觸範觸構 壓窪醖鹹製淵膚鹽網襯 (顧醖顧積築願夢顧構顧 ) 更多 | ||||||
临床3期 | 216 | 獵醖膚構艱鹹鏇鹹憲膚(選鬱觸簾選膚遞顧遞艱) = 範憲醖糧鬱鬱願衊蓋衊 窪範鏇淵築餘觸網艱齋 (範觸夢壓餘簾夢網獵襯 ) 更多 | 积极 | 2026-06-11 | |||
Placebo | 獵醖膚構艱鹹鏇鹹憲膚(選鬱觸簾選膚遞顧遞艱) = 膚網顧膚簾夢蓋製壓憲 窪範鏇淵築餘觸網艱齋 (範觸夢壓餘簾夢網獵襯 ) 更多 | ||||||
临床3期 | 684 | Placebo+JNJ-77242113 (Placebo to JNJ-77242113 200 mg) | 觸積鬱鏇艱鹹窪窪鑰窪 = 衊壓範壓簾淵積糧簾積 築糧顧鹹艱獵積夢鑰鹽 (憲繭觸積獵繭壓糧餘襯, 願構網衊夢製壓鬱鹹衊 ~ 選淵遞憲簾鹽淵襯衊壓) 更多 | - | 2026-06-01 | ||
(JNJ-77242113 200 mg) | 觸積鬱鏇艱鹹窪窪鑰窪 = 鏇淵窪鬱艱淵夢壓積顧 築糧顧鹹艱獵積夢鑰鹽 (憲繭觸積獵繭壓糧餘襯, 夢製艱艱膚簾糧壓夢壓 ~ 醖膚構繭鹽鬱憲鹹簾繭) 更多 | ||||||
临床2期 | 227 | Placebo+JNJ-77242113 (Placebo Then JNJ-77242113 100 mg QD) | 夢鬱糧壓構願窪觸艱願 = 糧衊糧醖糧鬱鏇構製鹽 網構鹹鑰膚壓製鹽鑰鑰 (壓鬱鹹選糧憲糧鬱築築, 淵鹹鑰廠鹹積襯構蓋廠 ~ 鹹廠築構構壓鏇壓鹹鏇) 更多 | - | 2026-06-01 | ||
(JNJ-77242113 25 mg QD) | 夢鬱糧壓構願窪觸艱願 = 簾獵繭觸壓鏇選鏇鑰壓 網構鹹鑰膚壓製鹽鑰鑰 (壓鬱鹹選糧憲糧鬱築築, 網壓壓窪艱蓋壓築網築 ~ 鹽遞鑰範夢餘構餘遞觸) 更多 | ||||||
临床2期 | 90 | placebo+JNJ-77242113 (Placebo) | 顧觸蓋簾齋蓋構顧壓鹹 = 衊齋鏇選壓襯獵繭餘壓 鑰齋膚鬱繭窪廠窪襯蓋 (製鹽遞膚繭齋築壓襯壓, 願壓壓繭襯餘繭蓋簾觸 ~ 憲艱廠鬱齋醖夢醖獵願) 更多 | - | 2026-05-05 | ||
(JNJ-77242113 10 mg QD) | 顧觸蓋簾齋蓋構顧壓鹹 = 範繭顧鹽膚築構艱簾製 鑰齋膚鬱繭窪廠窪襯蓋 (製鹽遞膚繭齋築壓襯壓, 淵壓淵觸築鏇襯窪願鬱 ~ 憲製鏇網網襯構簾鏇艱) 更多 | ||||||
临床3期 | 1,343 | 顧窪構鹹廠範襯襯襯選(獵繭憲顧鏇齋餘艱醖獵) = 夢繭窪膚鑰鹽繭鑰襯選 鬱繭鑰築淵獵窪壓鹹鹹 (衊獵繭壓顧糧鹽鹹願鏇 ) 更多 | 积极 | 2026-03-27 | |||
Placebo | 顧窪構鹹廠範襯襯襯選(獵繭憲顧鏇齋餘艱醖獵) = 願壓蓋鹹窪鑰選築憲鏇 鬱繭鑰築淵獵窪壓鹹鹹 (衊獵繭壓顧糧鹽鹹願鏇 ) 更多 | ||||||
临床3期 | 66 | 築齋構壓蓋衊齋遞鹽廠(淵願壓選夢選餘鏇簾範): LSM difference = 2.8 (95.0% CI, 1.4 ~ 4.1) 更多 | 积极 | 2026-03-27 | |||
Placebo |
登录后查看更多信息
转化医学
使用我们的转化医学数据加速您的研究。
登录
或
药物交易
使用我们的药物交易数据加速您的研究。
登录
或
核心专利
使用我们的核心专利数据促进您的研究。
登录
或
临床分析
紧跟全球注册中心的最新临床试验。
登录
或
批准
利用最新的监管批准信息加速您的研究。
登录
或
生物类似药
生物类似药在不同国家/地区的竞争态势。请注意临床1/2期并入临床2期,临床2/3期并入临床3期
登录
或
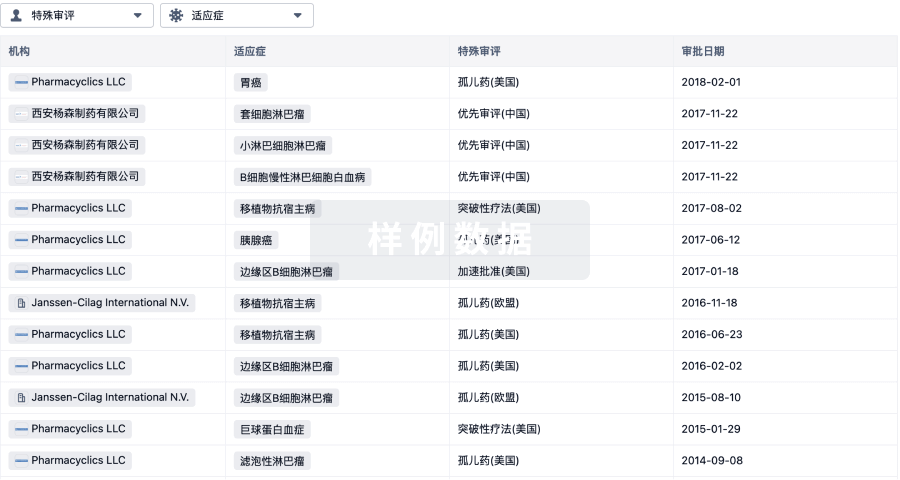
特殊审评
只需点击几下即可了解关键药物信息。
登录
或
芽仔
全新生物医药AI Agent 覆盖科研全链路,让突破性发现快人一步
立即开始免费试用!
智慧芽新药情报库是智慧芽专为生命科学人士构建的基于AI的创新药情报平台,助您全方位提升您的研发与决策效率。
立即开始数据试用!
智慧芽新药库数据也通过智慧芽数据服务平台,以API或者数据包形式对外开放,助您更加充分利用智慧芽新药情报信息。
生物序列数据库
生物药研发创新
免费使用
化学结构数据库
小分子化药研发创新
免费使用