预约演示
更新于:2025-09-09
Università degli studi Magna Græcia di Catanzaro
更新于:2025-09-09
概览
标签
血液及淋巴系统疾病
肿瘤
小分子化药
双特异性抗体
疾病领域得分
一眼洞穿机构专注的疾病领域

技术平台
公司药物应用最多的技术
靶点
公司最常开发的靶点
关联
靶点 |
作用机制 |
在研机构 |
原研机构 |
在研适应症 |
非在研适应症 |
最高研发阶段 |
首次获批国家/地区 |
首次获批日期 |

WO2023079425
专利挖掘靶点 |
作用机制 |
在研机构 |
原研机构 |
在研适应症 |
非在研适应症 |
最高研发阶段 |
首次获批国家/地区 |
首次获批日期 |
NCT06830460
Efficacy of a Theoretical-practical Course for the Ultrasound Measurement of the Optic Nerve Diameter in Different Healthcare Operators
NCT06652776
The Italian COPD Registry. the DescribinG BUrden of COPD and Occurrence of MortaLity in a Cohort of Italian Patients

NCT06778590
Comparison of Piezoelectric and Conventional Surgery for Germectomy of the Lower Third Molar: Assessment of Post-operative Sequelae
100 项与 Università degli studi Magna Græcia di Catanzaro 相关的临床结果
登录后查看更多信息
登录后查看更多信息
2025-12-31RENAL FAILURE
Expanded screening for Fabry disease in patients with chronic kidney disease not on dialysis: a multicenter Italian experience
Article
作者: Pieruzzi, Federico ; Mignani, Renzo ; Tronconi, Giulia ; Scichilone, Laura ; Duro, Giovanni ; Sessa, Concetto ; Sartori, Gemma ; Andreucci, Michele ; Shakkour, Meilad ; Battaglia, Yuri ; Colomba, Paolo ; Baciga, Federica ; Carnicella, Giulia ; Russo, Savio ; Erlati, Michela
Fabry disease (FD) is a progressive, multisystemic X-linked disorder caused by mutations in the GLA gene, often leading to renal failure. Although several screening programs have been conducted, the prevalence of FD in patients with chronic kidney patients who are not dependent on dialysis (NDD-CKD) is likely underestimated due to restrictive inclusion criteria and methodological shortcomings. This study aims to assess the prevalence of FD in NDD-CKD patients using an expanded screening approach. Ongoing outpatients attending Italian nephrology clinics were screened by assay of plasma α-galactosidase A (α-Gal A) activity. Genetic testing was also performed in all females and males with low α-Gal A activity. Inclusion criteria were: (1) females ≥18 years old; (2) males aged between 18 and 70 years; (3) NDD-CKD stages 1-5. Patients with histological diagnosis of glomerulonephritis or diagnosis of autosomal dominant polycystic kidney disease (ADPKD) were excluded. Demographic data and laboratory results were also collected. Among 385 NDD-CKD outpatients, 173 underwent screening. One patient with three family members carrying a novel mutation (c.320 A > G, p.Q107R); one patient with three family members carrying a silent mutation (c.48 T > G, p.L16L) and two patients with a missense mutation (c.376A > G, p.S126G), were identified. Overall, the prevalence of FD was 2.3%, increasing to 5.4% (10 in 183) with family screening. FD may be more common than previously believed, particularly within NDD-CKD populations. FD screening should be expanded to include NDD-CKD patients with known causes of CKD, such as hypertension and diabetes mellitus, and genetic testing should be routinely used for female patients.
2025-12-31Journal of Maternal-Fetal & Neonatal Medicine
Changes in adrenomedullin in bronchoalveolar lavage fluid with chorioamnionitis in a sheep-based model
Article
作者: D’Adamo, Ebe ; Strozzi, Mariachiara ; Lapergola, Giuseppe ; Gazzolo, Francesca ; Picone, Simonetta ; Panichi, Daniele ; Gavilanes, Danilo AW. ; Levantini, Gabriella ; Fabiano, Adele ; Kramer, Boris W. ; Gazzolo, Diego ; Abdelhameed, Ali Saber
BACKGROUND:
Adrenomedullin (AM) is a potent angiogenic, antioxidant and anti-inflammatory peptide protecting the developing lung from injury due to bronchopulmonary dysplasia (BPD) of the preterm infant. At this stage, no data on the potential effects of chorioamnionitis (CA) occurrence and glucocorticoids (GC) administration on AM in developing lungs are still lacking.
OBJECTIVE:
to investigate, in a sheep-based model, the positive/side-effects of combined exposure to CA and GC on AM concentrations measured in bronchoalveolar lavage fluid (BALF).
METHODS:
Time-mated ewes were randomly admitted to one of six treatment groups receiving injection: saline (controls); lipopolysaccharide (L) in intra-amniotic fluid treated alone at 7 or 14 d before delivery or associated with betamethasone (B) intramuscularly; B treated alone (7d) or associated with L (14d). Lambs were surgically delivered at 120 days gestation and euthanized. BALF was used for AM measurement in the studied groups.
RESULTS:
AM BALF levels significantly (p < 0.05, for all) changed both to B and L exposure in a time-dependent manner. The latter was characterized by AM levels at short term superimposable to controls, whilst significantly (p > 0.05) decreased at long-term. The former showed increased AM at short and decreased at long-term (p < 0.05, for all), respectively.
CONCLUSIONS:
the present results showing AM BALF changes in a sheep-based model support the AM role in the hemodynamic patterns due to CA and BPD occurrence and open the way to further studies investigating the role of vasoactive agents as trustable markers of lung development/damage.
2025-12-01Current Cardiology Reports
From Mechanisms to Management: Tackling In-Stent Restenosis in the Drug-Eluting Stent Era
Review
作者: Indolfi, Ciro ; Greco, Francesco ; Polimeni, Alberto ; Curcio, Antonio ; Spaccarotella, Carmen ; Quarta, Rossella ; Gori, Tommaso ; Romano, Letizia ; Spadafora, Luigi ; Martino, Giovanni
Abstract:
Purpose of review:
Drug-eluting stent (DES) technology has greatly enhanced the safety and effectiveness of percutaneous coronary interventions (PCI). The aim of the present paper is to provide a comprehensive review of in-stent restenosis (ISR), focusing on the contemporary DES era, including its incidence, mechanisms, and imaging characterization.
Recent findings:
Despite the widespread use of DES and numerous improvements, recent clinical data indicate that ISR still occurs in 5–10% of PCI procedures, posing a considerable public health issue.
Summary:
The incidence, morphology, and clinical implications of ISR are determined by a complex interplay of several factors: the patient, stent, procedure, and vessel and lesion-related factors. Advancements in intracoronary imaging have provided greater insight into its patterns and underlying causes. Over time, treatment strategies have evolved, and current guidelines recommend an individualized approach using intracoronary imaging to characterize ISR’s underlying substrate.
100 项与 Università degli studi Magna Græcia di Catanzaro 相关的药物交易
登录后查看更多信息
100 项与 Università degli studi Magna Græcia di Catanzaro 相关的转化医学
登录后查看更多信息
组织架构
使用我们的机构树数据加速您的研究。
登录
或
管线布局
2026年07月22日管线快照
管线布局中药物为当前组织机构及其子机构作为药物机构进行统计,早期临床1期并入临床1期,临床1/2期并入临床2期,临床2/3期并入临床3期
药物发现
1
1
临床前
其他
1
登录后查看更多信息
当前项目
登录后查看更多信息
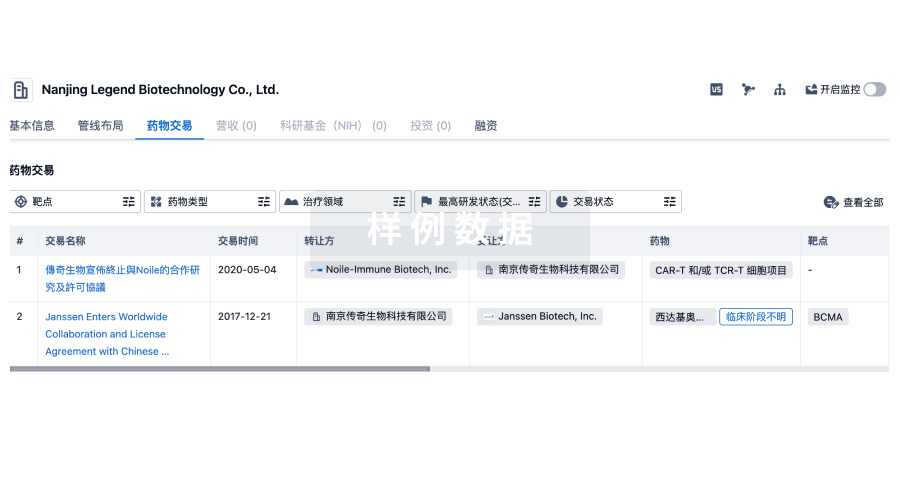
药物交易
使用我们的药物交易数据加速您的研究。
登录
或
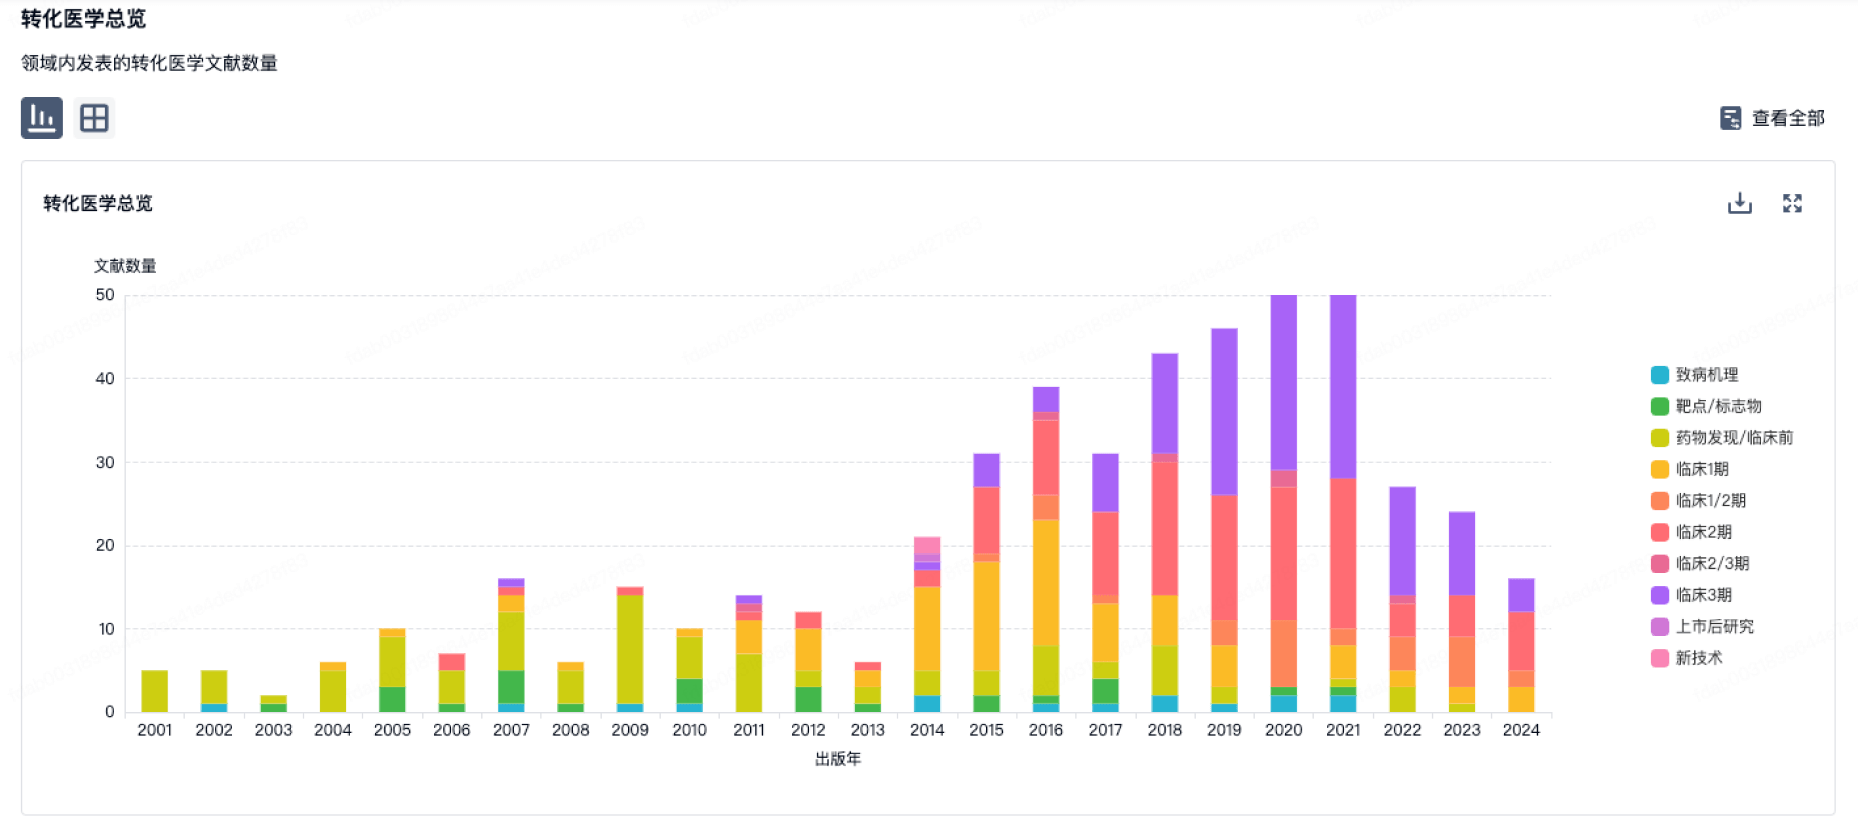
转化医学
使用我们的转化医学数据加速您的研究。
登录
或
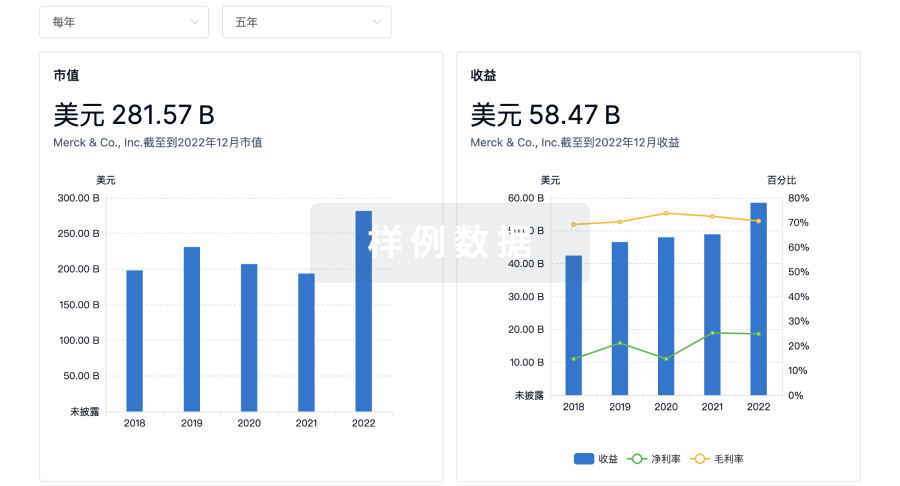
营收
使用 Synapse 探索超过 36 万个组织的财务状况。
登录
或
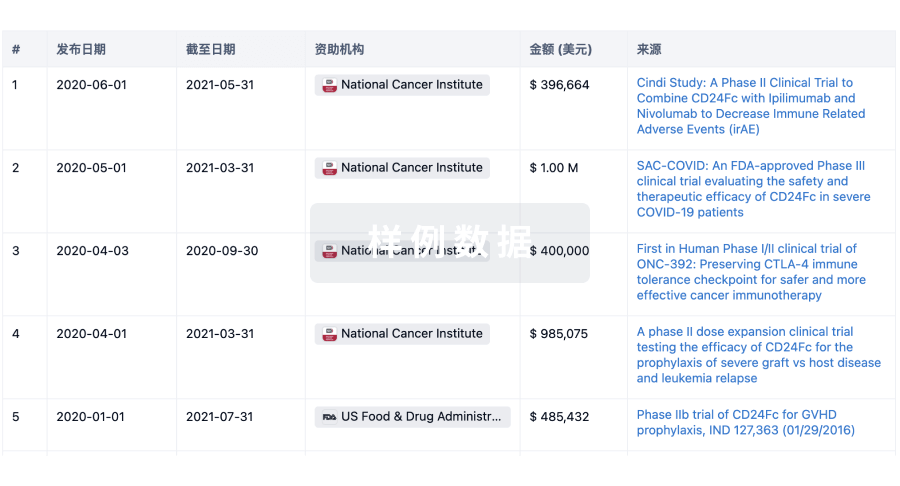
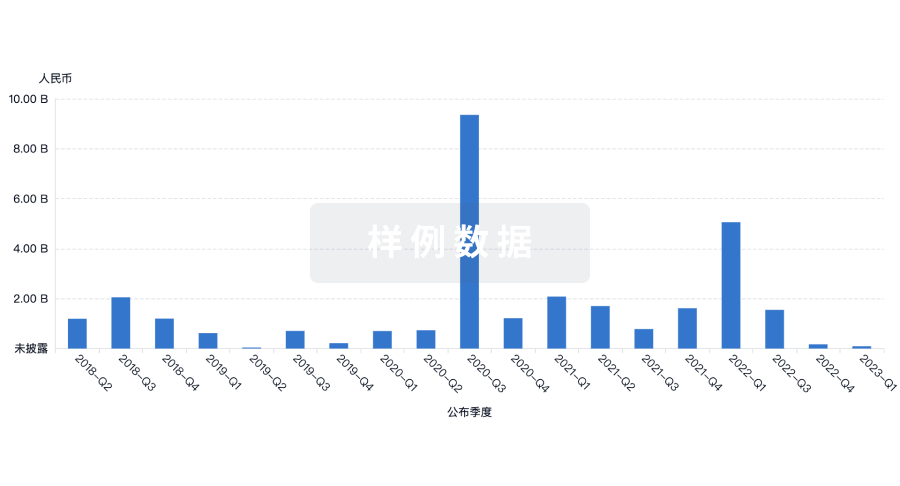
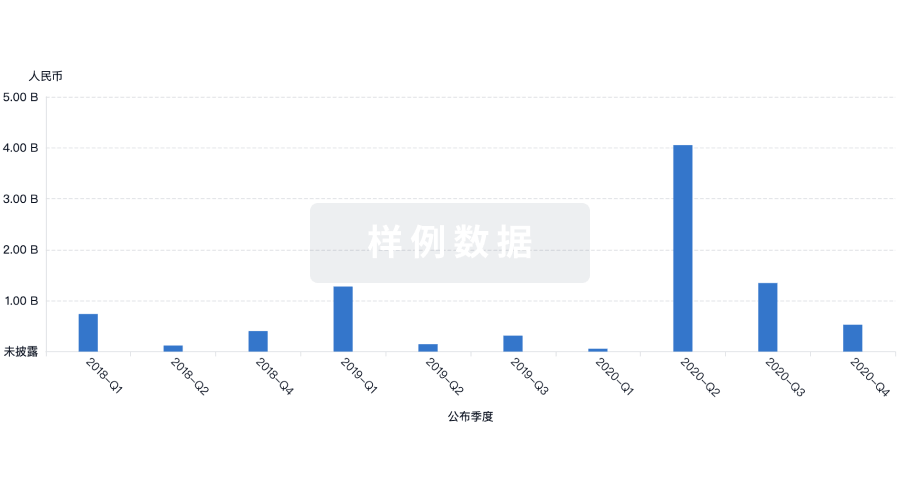
科研基金(NIH)
访问超过 200 万项资助和基金信息,以提升您的研究之旅。
登录
或
投资
深入了解从初创企业到成熟企业的最新公司投资动态。
登录
或
融资
发掘融资趋势以验证和推进您的投资机会。
登录
或
芽仔
全新生物医药AI Agent 覆盖科研全链路,让突破性发现快人一步
立即开始免费试用!
智慧芽新药情报库是智慧芽专为生命科学人士构建的基于AI的创新药情报平台,助您全方位提升您的研发与决策效率。
立即开始数据试用!
智慧芽新药库数据也通过智慧芽数据服务平台,以API或者数据包形式对外开放,助您更加充分利用智慧芽新药情报信息。
生物序列数据库
生物药研发创新
免费使用
化学结构数据库
小分子化药研发创新
免费使用