预约演示
更新于:2026-03-08
The European Molecular Biology Laboratory
更新于:2026-03-08
概览
标签
心血管疾病
神经系统疾病
消化系统疾病
小分子化药
CRISPR/Cas9
疾病领域得分
一眼洞穿机构专注的疾病领域

暂无数据
技术平台
公司药物应用最多的技术
暂无数据
靶点
公司最常开发的靶点
暂无数据
| 排名前五的药物类型 | 数量 |
|---|---|
| 小分子化药 | 1 |
| CRISPR/Cas9 | 1 |
关联
2
项与 The European Molecular Biology Laboratory 相关的药物WO2024102811
专利挖掘靶点 |
作用机制- |
在研适应症 |
非在研适应症- |
最高研发阶段药物发现 |
首次获批国家/地区- |
首次获批日期- |
WO2024133360
专利挖掘作用机制 autotaxin抑制剂 |
非在研适应症- |
最高研发阶段药物发现 |
首次获批国家/地区- |
首次获批日期- |
1
项与 The European Molecular Biology Laboratory 相关的临床试验NCT04334707
Kidney Precision Medicine Project
Acute kidney injury (AKI) and chronic kidney disease (CKD) impose a significant global health burden. Yet, no effective therapies currently exist for AKI, and only a few are available for CKD.
Despite significant effort from industry and academia, development of pharmacologic therapies for AKI and CKD has been hampered by:
Non-predictive animal models The inability to identify and prioritize human targets The limited availability of human kidney biopsy tissue A poor understanding of AKI and CKD heterogeneity Historically, AKI and CKD have been described as single, uniform diseases. However, growing consensus suggests that different disease pathways lead to different subgroups of AKI and CKD (AKIs and CKDs).
Access to human kidney biopsy tissue is a critical first step to define disease heterogeneity and determine the precise molecular pathways that will facilitate identification of specific drug targets and ultimately enable individualized care for people with AKI and CKD.
A number of research centers across the United States are collaborating to bring state-of-the-art technologies together to:
Ethically obtain and evaluate kidney biopsies from participants with AKI or CKD
Define disease subgroups
Create a kidney tissue atlas
Identify critical cells, pathways, and targets for novel therapies
The KPMP is made up of three distinct, but highly interactive, activity groups:
Recruitment Sites: The recruitment sites (RS) are responsible for recruiting participants with AKI or CKD into the longitudinal study and performing the kidney biopsy.
Tissue Interrogation Sites: The tissue interrogation sites (TIS) are responsible for developing and using innovative technologies to analyze the biopsy tissue.
Central Hub: The central hub is responsible for aggregating, analyzing, and visualizing the generated data and providing scientific, infrastructure, and administrative support for the KPMP consortium.
开始日期2019-09-01 |
申办/合作机构  University of Washington University of Washington [+20] |
100 项与 The European Molecular Biology Laboratory 相关的临床结果
登录后查看更多信息
0 项与 The European Molecular Biology Laboratory 相关的专利(医药)
登录后查看更多信息
5,782
项与 The European Molecular Biology Laboratory 相关的文献(医药)2026-04-30·RAPID COMMUNICATIONS IN MASS SPECTROMETRY
Pyrene‐Conjugated, 2‐Pyridinecarboxaldehyde Derivatives as N‐Terminus‐Specific Tags for MALDI‐ and LALDI‐MS
Article
作者: Murat Kucukdisli ; Oliver Schilling ; Nadine Meier ; Florian Braun ; Bettina Wehrle ; Melanie Christine Föll ; David W. Will ; Mujia Jenny Li ; Larissa Chiara Meyer
ABSTRACT:
Background:
Proteolytic processing is a fundamental post‐translational modification. Liquid chromatography–tandem mass spectrometry (LC–MS/MS) workflows are powerful for degradomic analyses but inherently sacrifice spatial information, a critical aspect for investigating biological systems such as aberrant extracellular matrix remodeling and alterations of the tumor microenvironment. Matrix‐assisted laser desorption/ionization (MALDI) offers potential for fast spatial profiling, but MALDI imaging of tryptic peptides is still challenged by spectral crowding and restricted abilities for MALDI MS/MS identification.
Methods:
To address these limitations, we developed pyrene‐conjugated 2‐pyridinecarboxaldehyde (pyr‐2PCA) tags for selective N‐terminal labeling and enhanced detection sensitivity. The 2PCA reagent exclusively modifies N‐terminal α‐amines, not lysine ε‐amines, as could be confirmed in MALDI‐MS, with concentration‐dependent side reactions minimized by dilution. A distinct reporter ion produced by 2PCA‐labeled peptides in prm‐PASEF (MALDI MS/MS) serves as a unique marker for successful labeling.
Results:
The covalent conjugation of 2PCA with a pyrene structure results in the pyr‐2PCA tag that enables matrix‐free, label‐assisted laser desorption ionization mass spectrometry (LALDI‐MS) measurements of peptides. We demonstrate that labeling with a pyrene‐coupled 2PCA tag (pyr‐2PCA) prior to tryptic digestion results in the selective detection of N‐terminal peptides in LALDI, with no significant off‐target labeling.
Conclusions:
This study presents the first presentation and characterization of this novel pyr‐2PCA tag, thereby laying the groundwork and demonstrating its future potential for MALDI/LALDI‐based in situ spatial N‐terminomics to study proteolytic processes.
2026-03-01·NATURE REVIEWS MOLECULAR CELL BIOLOGY
Elucidating the coordination of RNA processing using short-read and long-read RNA-sequencing methods
Review
作者: Hilgers, Valérie ; Alfonso-Gonzalez, Carlos
The maturation of mRNAs is crucial for gene regulation and proteome diversification. Transcripts are processed co-transcriptionally through a complex interplay of mechanisms that involve numerous protein machineries. In eukaryotes, most genes undergo alternative RNA processing through the context-dependent use of transcription start sites (TSSs), splice sites and polyadenylation sites. The accurate measurement of alternative TSS usage, alternative splicing and alternative polyadenylation has been enabled by short-read RNA-sequencing technologies. However, elucidating the timing, coordination and functional outcomes of alternative RNA processing is challenging, especially in vivo. The development of long-read sequencing (LRS) methodologies enables the characterization of various aspects of co-transcriptional RNA processing, each methodology providing unique perspectives and limitations. In this Review, we discuss recent advances in short-read sequencing and LRS technologies that measure transcripts in their nascent and mature state and at single-cell resolution and with whole-molecule read length in the case of LRS. We integrate new findings that functionally link alternative TSS, alternative splicing and alternative polyadenylation, with new implications for diseases such as cancer and neurodevelopmental and neurodegenerative disorders. Finally, we discuss insights gained using CRISPR tools into the coordination of RNA processing events.
2026-03-01·EUROPEAN JOURNAL OF HUMAN GENETICS
The LMSz method - an automatable scalable approach to constructing gene-specific growth charts in rare disorders
Article
作者: Almoguera, Berta ; Firth, Helen V ; Garavelli, Livia ; Hobson, Rachel J ; Woods, Emily ; Bayat, Allan ; Low, Karen J ; Foreman, Julia ; Balasubramanian, Meena ; Marin-Reina, Purin ; Cole, Tim J ; Wright, Caroline M ; Martinez-Cayuelas, Elena ; Caraffi, Stefano G ; Ockeloen, Charlotte W ; Kwuo, Hannah
Abstract:
Children with monogenic neurodevelopmental disorders often grow abnormally. Gene-specific growth charts would be useful but require large samples to construct them using the conventional LMS method. We transformed anthropometry to British 1990 reference z-scores for 328 UK and 264 international individuals with
ANKRD11, ARID1B, ASXL3, DDX3X, KMT2A
, or
SATB2-
related disorders, and modelled mean and standard deviation (SD) of the z-scores as gene-specific linear age trends adjusted for sex. Assuming the same skewness in the reference and rare disease distributions, we then back-transformed the mean ±2 SD lines to give gene-specific median, 2nd, and 98th centiles. The resulting z-score charts look plausible on several counts. Only
KMT2A
shows a (rising) age trend in median height, while BMI and weight increase for several genes, possibly reflecting population trends. Apart from
SATB2
and
DDX3X
, the gene-specific medians are all below the reference (range 0.1th centile for height
KMT2A
to 36th centile for BMI
ANKRD11
). Median OFC z-score shows no age trend, with medians ranging from 10th to 30th centile, and
ASXL3
is lowest, on the 3rd centile. In 19/24 cases, the centiles for the two sexes are the same on the z-score scale. Our LMSz method produces gene-specific growth charts for rare diseases, which, when used in the correct context, could be an important clinical tool. We plan to automate it within the DECIPHER platform, enabling availability for relevant genes.
137
项与 The European Molecular Biology Laboratory 相关的新闻(医药)2026-03-04
从“结构生物学圣杯”到产业变革引擎:DeepMind的AlphaFold系统,自2020年横空出世以来,不仅解决了困扰生物学界长达50年的蛋白质折叠预测难题,更在短短五年内催生了一个价值数百亿美元的新兴产业
2024年诺贝尔化学奖授予了计算蛋白质科学领域的先驱者,这标志着人工智能在生命科学领域的突破获得了最高学术认可。
蛋白质是生命活动的核心执行者,其功能由氨基酸序列决定的三维结构主导。传统蛋白质研究依赖X射线晶体学、核磁共振等实验手段,耗时费力且成本高昂。确定一个蛋白质结构通常需要数月甚至数年时间,而AlphaFold仅需几分钟就能以接近实验精度完成预测。2021年,DeepMind与欧洲分子生物学实验室欧洲生物信息学研究所合作,免费开放了涵盖超过2亿种蛋白质预测结构的数据库,这一举措被欧洲生物信息研究所主任Ewan Birney博士称为“人类基因组图谱发布以来最重要的数据库之一”。
AlphaFold的意义远不止于科学突破。它代表了一种全新的技术范式:将深度学习从图像识别、自然语言处理等感知智能领域,成功迁移到生命科学这一认知智能的核心地带。这场革命正在重构全球生物医药产业的研发逻辑、竞争格局和价值分配体系。一、技术演进:从静态结构到动态系统的认知跃迁1.1 AlphaFold的技术突破路径
AlphaFold的技术演进经历了三个关键阶段。第一代AlphaFold在2018年CASP13竞赛中首次亮相,展示了深度学习在蛋白质结构预测中的潜力。真正的突破发生在2020年,AlphaFold2在CASP14竞赛中以惊人的准确性预测蛋白质结构,其预测质量已达到与X射线晶体学、冷冻电镜等顶尖实验手段几乎等同的水平。
AlphaFold2的核心创新在于其独特的架构设计。系统采用基于注意力的神经网络,通过端到端的方式直接从蛋白质序列预测三维结构。模型包含两个主要组件:Evoformer模块处理多序列比对信息,捕捉进化约束;结构模块则生成最终的三维坐标。这一架构使AlphaFold2能够准确预测蛋白质的局部和全局结构特征。
2024年发布的AlphaFold3代表了技术的又一次飞跃。与之前版本相比,AlphaFold3不仅能够预测单一蛋白质的结构,还可以模拟蛋白质与其他分子(如DNA、RNA、小分子、离子以及修饰残基)的相互作用。这一扩展为科学家们提供了理解细胞内复杂过程的新途径,特别是对于药物开发和疾病研究意义重大。
1.2 从结构预测到功能预测的范式转变
AlphaFold3的最大突破在于其从“结构预测”向“功能预测”的范式转变。传统上,结构生物学关注的是蛋白质的静态三维形态,而药物研发需要理解的是蛋白质与配体相互作用的动态过程。AlphaFold3通过引入扩散模型等新技术,实现了对蛋白质-配体复合物结构的直接预测,无需传统分子对接的构象采样与力场优化步骤。
这一技术突破具有深远的产业意义。在经典的DUDE-Z基准测试中,AlphaFold3展现出卓越性能:86%的靶点能复现实验晶体中的配体构象,结合口袋预测精度均满足RMSD的标准。更令人瞩目的是,在93%的靶点上,AlphaFold3的界面预测TM分数和平均预测对齐误差评分在logAUC指标上优于传统分子对接工具DOCK3,平均提升幅度分别达27和31。
然而,技术并非完美。中国科学院上海药物研究所徐华强团队的研究揭示了AlphaFold3的局限性。在对74个GPCR-小分子配体复合物的系统评估中,研究人员发现AlphaFold3在整体受体骨架预测方面表现优秀,Cα均方根偏差平均仅为0.98 Å,优于前代AlphaFold2的1.64 Å。但在小分子配体定位方面,AlphaFold3表现出显著不稳定性,配体重原子RMSD平均高达4.28 ± 5.77 Å,尤其在新型配体和别构调节剂上更为显著。这表明AlphaFold3在关键配体结合模式的预测上仍存在明显不足。1.3 开源生态与商业化的平衡
2024年11月,DeepMind宣布开源AlphaFold3的模型代码和权重,但仅限于学术和非商业用途。这一决策体现了DeepMind在推动科学进步与保护商业利益之间的平衡艺术。开源版本使全球科研人员能够在本地部署AlphaFold3,加速基础研究,但商业应用仍需获得许可。
与此同时,开源社区也在积极行动。OpenFold3作为AlphaFold3的开源复刻版,在2025年11月发布,允许所有用户测试模型、使用新数据集训练模型、开发新应用程序并调整模型。OpenFold3采用Apache 2.0许可证,用户可以在任何目的下(包括商业用途)使用、复制、修改、合并、发布以及再分发软件或其衍生作品。这一开源举措已经吸引了诺和诺德、拜耳等医药巨头的关注,它们计划利用OpenFold3加速新疗法和产品的研发。二、产业应用:重构药物研发全流程2.1 靶点发现:从“经验猜测”到“系统计算”
传统药物研发中,靶点发现依赖文献综述与少量组学验证,周期长达12-24个月,成功率不足10%。AlphaFold的出现彻底改变了这一局面。通过提供高质量的蛋白质结构预测,研究人员能够更准确地理解疾病相关蛋白的功能机制,识别新的药物靶点。
英矽智能(Insilico Medicine)利用生成式AI平台Pharma.AI,仅用3天就锁定了特发性肺纤维化新靶点TNIK,而传统方法需要5年时间。基于这一靶点设计的药物Rentosertib(ISM001-055)已成为全球首款端到端生成式AI辅助设计的药物,并于2025年3月获得美国通用名委员会正式命名。
AlphaFold3进一步扩展了靶点发现的范围。传统上被认为是“不可成药”的靶点,如缺乏深口袋的转录因子或蛋白-蛋白相互作用界面,现在可以通过AlphaFold3预测其与潜在配体的结合模式,为药物设计提供新的切入点。2.2 分子设计:从“筛选”到“创造”的范式革命
分子设计是药物研发的核心环节,传统方法依赖高通量筛选,面临化学空间庞大(约10^60个潜在分子)、筛选效率低、成药性差等问题。AI生成式技术实现了从“筛选已知分子”到“从头设计新分子”的跨越。
Chai Discovery公司发布的Chai-2模型代表了这一领域的最新突破。该模型能够实现“零样本”从头抗体设计,仅需输入靶点抗原信息,就能直接生成全新的、具有结合活性的抗体或微型蛋白的序列和3D结构。实验数据显示,Chai-2的成功率平均达到15.5%-20%,相较于传统计算方法仅约0.1%的成功率,效率提升超100倍。
在抗生素设计领域,研究团队构建了双路径生成式设计平台,包括基于片段设计与从头设计两种互补路径。基于片段设计以化学片段为起点,通过“筛选-扩展-优化”三步生成抗菌分子,核心逻辑是“片段决定活性,AI优化成药性”。第一步是4.5亿片段的高通量虚拟筛选,通过GNN模型筛选并施加三重过滤:活性过滤、安全性过滤和新颖性过滤。2.3 临床前研究:大幅缩短研发周期
AI技术在制药领域的应用带来了研发效率的革命性提升。在研发周期方面,AI可将药物发现和临床前研究阶段从3-6年缩短至1.5-3.6年,临床试验阶段从6-7年压缩至2.4-3.5年,整体研发周期平均缩短三分之一至一半。
更激进的案例显示,某些企业通过AI技术将研发周期从平均10年缩短至18个月,成本降低80%。在研发成功率方面,AI技术带来的提升更为显著。AI设计药物在I期临床试验的成功率达到80-90%,远超传统药物的40-65%。整体而言,AI有望将药物总成功率从10%提升至14%。2.4 具体应用案例:从概念验证到临床进展
2024-2025年是AI药物发现从概念验证向规模化商业应用转型的关键时期。多个AI设计的药物已经进入临床试验阶段:
英矽智能的Rentosertib:作为全球首款端到端生成式AI辅助设计的药物,Rentosertib针对特发性肺纤维化适应症已公布阳性Phase IIa结果。从靶点发现到IIa期临床仅耗时18个月,耗时仅为传统研发的三分之一,研发成本降至传统模式的十分之一。
Schrödinger的Zasocitinib:该药物靶向TYK2(酪氨酸激酶2),已进入Phase III临床试验。Zasocitinib源于Nimbus Therapeutics,后被Schrödinger收购,验证了物理+AI设计策略的有效性。
Recursion Pharmaceuticals的REC-994:针对脑海绵状血管瘤(CCM),2025年Phase I显示病变体积减少。这是一种氧化还原循环硝基氧化物化合物,通过AI设计发现。三、市场格局:多元化竞争与生态重构3.1 全球AI制药市场规模与增长
根据头豹研究院数据,2024年全球AI制药市场规模达175.36亿元人民币,2025年预计突破200亿美元,2030年将达850亿美元,2024-2030年复合年增长率保持在30%以上。区域分布上,北美占比超57%,主导全球技术创新与商业化;欧洲凭借制药巨头资源布局紧随其后;中国市场增速最快,成为全球重要增长极。
在中国市场,2019-2024年AI制药市场规模从0.7亿元增至7.3亿元,复合年增长率达47.8%;预计2025-2028年复合年增长率达68.3%,2028年将达58.6亿元。市场结构方面,AI药物研发服务(CRO模式)占比60%,自研管线占比30%,SaaS平台服务占比10%,随着技术成熟,自研管线占比将持续提升。3.2 主要参与者与商业模式
AI制药产业形成了多元化的竞争格局,主要参与者包括:
技术驱动型公司:以DeepMind/Isomorphic Labs为代表,依托强大的AI技术积累,专注于底层算法突破。Isomorphic Labs于2021年从DeepMind分拆,基于AlphaFold技术,战略目标是利用AI“治愈所有疾病”。2025年4月完成首轮外部融资6亿美元,由Thrive Capital领投。Isomorphic计划于2026年底正式启动首个由AI全流程驱动的抗癌药物临床试验。
平台服务型公司:以英矽智能、Schrödinger、Recursion Pharmaceuticals等为代表,提供AI驱动的药物发现平台服务。英矽智能于2025年12月30日在港交所挂牌上市,募资22.77亿港元,摘得2025年港股生物医药IPO桂冠。Schrödinger则通过物理驱动与AI结合的策略,在药物设计领域取得显著成果。
传统药企转型:大型制药公司如辉瑞、礼来、诺华等纷纷加大AI布局。礼来在2025年进行了十次AI制药领域合作,投入金额超30亿美元。辉瑞与DeepMind签订5年8亿美元的独家合作协议,获得肿瘤领域200个潜在靶点的优先开发权。
中国本土创新势力:百济神州自主搭建的千星平台整合AlphaFold3算法与冷冻电镜数据,将抗体表位定位效率提升40倍,其2025年新申报的10个First-in-class项目中7个采用该技术。恒瑞医药公布的临床前管线中采用AlphaFold3技术的项目占比从2023年的8%跃升至2025年的49%,其PD-L1/IL-15双抗项目IND申报时间缩短11个月。3.3 产业整合与生态构建
2024-2025年,AI制药行业出现了明显的整合趋势。Recursion与Exscientia的合并代表了行业整合的典型案例,两家公司结合后创建了端到端平台,拥有30+项目管线。这种整合反映了行业从单一技术点突破向全流程平台化发展的趋势。
在中国,政策支持为AI制药产业发展提供了有力保障。2026年1月,工信部等八部门联合印发《“人工智能+”行动方案》,直接点名AI制药领域,强调要建设人工智能驱动的新药发现平台,利用多模态药效预测大模型加速靶点识别和候选药物发现,降低研发成本和周期。国家药监局(NMPA)推出的“30日审批通道”为1类创新药提供了极速准入可能,使AI研发的高效优势得以在行政端兑现。四、中国AI制药产业的独特路径4.1 政策驱动与市场机遇
中国AI制药产业在政策强力推动下快速发展。2025年6月,北京市联合多部门发布了《医药工业数智化转型实施方案(2025-2030年)》,确立了未来五年的战略框架。该方案的核心在于“数智赋能”:支持龙头药企与算力、模型平台协作,开发针对医药垂直领域的通用智能体;建设一批具备预测性维护、AI质检、智能调度能力的先进工厂;实现研发与制造的区域协同。
为解决国产算力昂贵且适配难的问题,北京、上海、深圳、杭州等地普遍推行了“三券”制度。算力券针对初创AI药企在国产智算中心进行的研发训练,政府给予实际采购额10%-30%的补贴;语料券与模型券旨在解决中文医药数据贫瘠问题。4.2 技术突破与应用创新
中国企业在AI制药领域展现出独特的技术路径和应用创新。分子之心发布的升级版MoleculeOS展示了工业级蛋白质基础设施的实力。该平台集成“NewOrigin(达尔文)”多模态大模型,实现了从静态观察到动态设计的全覆盖。其核心技术亮点包括超高精度动态设计,融合AI与第一性原理,将分子动力学模拟效率提升百万倍,达到了工业级应用水平。
在抗体设计领域,百奥赛图提出“千鼠万抗”战略,以规模化的人源化小鼠平台RenMice为基础,系统性地对上千个靶点开展抗体制备与筛选,目标短时间内构建出海量的候选抗体“货架”。2023-2024年,在“千鼠万抗”框架内,依托自主开发的RenMice全人抗体小鼠平台,获得了针对1000+靶点的超百万全人抗体序列。4.3 资本市场的积极响应
2025年以来,中国AI制药领域融资活跃。截至2025年12月24日,全球AI辅助制药公司超350家,其中中国至少101家。2025年以来,全球AI制药相关投融资事件近80起,其中中国至少有31起。AI制药初创企业在2025年上半年融资总额达34亿美元,其中靶点发现平台类企业估值普遍采用58倍的市销率倍数,显著高于传统药企的23倍。五、挑战与局限:理想与现实的距离5.1 技术瓶颈:从结构预测到功能验证
尽管AlphaFold在蛋白质结构预测方面取得了突破性进展,但在实际药物研发应用中仍面临诸多挑战。中国科学院上海药物研究所的研究显示,AlphaFold3在预测GPCR-小分子复合物时,虽然整体受体骨架预测表现优秀,但在小分子配体定位方面表现出显著不稳定性,配体重原子RMSD平均高达4.28 ± 5.77 Å。特别是在面对新型配体和别构调节剂时,预测准确性大幅下降。
BENTO研究框架对当前主流AI药物设计工具进行了系统性评估,发现了一个关键问题:在“全新的蛋白口袋”测试场景下,所有方法的成功率都断崖式下跌。深度学习模型(如DiffDock等)下降最惨烈,说明它们更多是在“背板”训练集里的口袋特征,而不是学到了物理相互作用。即便是AlphaFold3,在陌生口袋上的表现也并不比经典的smina好多少。这打破了“AF3可以解决所有结构问题”的幻想。5.2 数据壁垒与商业机密
2025年3月,全球药企巨头联合宣布将基于自有蛋白质结构数据开发新型AI模型,以弥补AlphaFold在药物相互作用预测上的不足。这场由数据垄断引发的技术竞赛,正将蛋白质结构预测从开源科学推向商业壁垒时代。
AlphaFold3虽能预测蛋白质3D结构,但公共数据库(PDB)中90%的结构为生物分子(如ATP)结合态,药物结合数据仅占1%。药企内部却拥有数万条药物-蛋白质复合体结构数据:PDB收录20万+结构,药企私有数据或超50万条,如AbbVie贡献9,000条。技术瓶颈方面,AlphaFold3预测药物结合的准确率仅65%,而药企内部模型在特定靶点上已达82%。
由AbbVie、强生等组成的“AI结构生物学联盟”采用柏林初创公司Apheris的隐私计算平台,实现数据隔离:各药企在本地训练模型,原始数据不出公司防火墙;模型共享:训练后的参数通过加密通道汇总,形成统一模型;不可追溯:无法反向工程推断训练数据来源,保护专利结构。5.3 临床验证的终极考验
尽管AI在药物发现早期阶段展现出巨大潜力,但临床验证仍是其必须跨越的门槛。截至2025年底,全球虽已有多款AI研发药物进入临床试验阶段,但迄今为止,尚无一款由AI主导研发的药物获批上市。从国内来看,数个宣称是“AI药物”的项目还停留在一期临床试验的阶段,仅有少数药品进入2期临床阶段。
中国医学科学院特聘教授王宏广指出:“AI在药物研发中的应用仍处于早期阶段,尽管AI能快速筛选海量化合物,但已经有不少案例表明,AI设计的分子可能在体外实验中表现优异,但进入人体后因代谢、毒性等问题失败。AI虽能缩短前期时间,却无法完全规避后期风险。”六、未来趋势:从预测工具到设计平台6.1 技术融合:物理模型与AI的深度结合
未来的AI药物设计将不再是单纯的深度学习模型,而是物理模型与AI的深度融合。Schrödinger等公司的成功证明了混合方法的威力。物理模型基于量子力学和分子力学原理,能够提供更准确的能量计算和动力学模拟;而AI模型则擅长从海量数据中学习复杂模式。两者的结合有望突破当前的技术瓶颈。
麻省理工学院与Recursion联合开发的开源生物分子基础模型Boltz-2,以比传统自由能扰动模拟快1000倍的速度实现近物理级结合亲和力预测精度,使早期团队的大规模虚拟筛选成为现实。这种技术融合代表了未来的发展方向。6.2 自动化实验室:从“AI大脑”到“机器人手脚”
Demis Hassabis多次强调:“AI只是大脑,自动化实验室是手脚。”在Isomorphic Labs的实验室里,很难看到手持移液枪的研究员。取而代之的,是由调度算法控制的机械臂阵列。这种“Lab-in-the-Loop”的设计,旨在解决生物学数据最大的痛点:批次效应和不可重复性。
通过标准化、高通量的自动化实验,Isomorphic能够以每天数千次的频率验证AI的预测,并将结果实时反馈给模型进行微调。这种“干湿闭环”的迭代速度,是传统CRO模式无法比拟的。2025年突破显示,人形机器人在AI集成实验室中进行药理学和生物化学实验,大幅提升高通量筛选、显微镜分析和试剂制备的自动化水平。6.3 从蛋白质到基因组:AlphaGenome的扩展
2026年1月,DeepMind基于AlphaFold体系推出了AlphaGenome,攻克占人类基因组98%的非编码区(曾被称为“垃圾DNA”),以单碱基分辨率预测基因表达、剪接、染色质状态等调控轨迹。AlphaGenome一次可处理100万碱基对,在24项评估中拿下22项SOTA,26轮疾病变异预测中胜出25轮,精准区分癌症驱动突变与乘客突变。
这一扩展将AI在医学的应用从蛋白结构推向全基因组功能解读,大幅提速罕见病、癌症、心血管疾病的研究与转化。AlphaGenome将AI能力从蛋白质结构拓展至全基因组调控,形成“蛋白结构+基因调控”的完整生命分子解析体系,为疾病早筛、靶点发现、基因治疗提供统一计算框架。结论:范式转移中的产业重构
AlphaFold破解蛋白质折叠预测难题,不仅是科学上的重大突破,更是产业生态的重构。它标志着药物研发从“经验试错”向“理性设计”的范式革命,从“手工作坊”向“数据智能驱动”的产业转型。
从技术角度看,AlphaFold系列模型的发展轨迹展示了AI在生命科学领域的演进路径:从单一蛋白质结构预测(AlphaFold2),到多分子复合物预测(AlphaFold3),再到基因组功能解读(AlphaGenome)。这一路径体现了AI从解决具体问题到构建完整认知体系的进步。
从产业角度看,AlphaFold催生了一个全新的生态系统:上游是算力提供商和基础模型开发者,中游是AI制药平台和解决方案提供商,下游是传统药企和生物技术公司。这个生态系统正在重构全球生物医药产业的竞争格局和价值链分配。
从商业角度看,AlphaFold带来的不仅是效率提升,更是商业模式创新。传统的“重磅炸弹”模式正在被“精准医疗”和“个性化治疗”所取代。AI使针对罕见病和个性化治疗药物的开发成为可能,这将改变制药行业的盈利模式和市场结构。
然而,这场革命仍面临诸多挑战。技术层面,从结构预测到功能验证仍有差距;数据层面,高质量数据的稀缺和壁垒制约了模型性能;监管层面,现有审评体系需要适应AI驱动的新药研发模式;伦理层面,AI在生命科学中的应用需要建立新的规范和标准。
展望未来,AlphaFold代表的不仅是技术工具,更是一种新的科学范式。它将计算与实验、数据与知识、人工智能与人类智慧深度融合,开启了生命科学研究的“数字生物”时代。正如DeepMind所展望的,生物学只是AI加速科学发现的第一个前沿领域,从核聚变到地球科学,AI正在成为推动所有科学领域进步的核心引擎。
中国拥有庞大的患者群体、丰富的临床数据、强大的制造能力和政策支持,但在基础算法、原创技术、高端芯片等方面仍存在短板。如何在全球化竞争中形成差异化优势,构建自主可控的AI制药生态体系,是中国产业界需要思考的战略问题。
2026-03-02
·古登堡
随着全球化进程的加速和国际教育的普及,欧洲国家以其优质的教育资源、多元的文化体验及良好的就业前景,成为众多中国学子的留学优选。本文将深入解析德国、法国、意大利、荷兰这四个欧洲热门留学目的地的教育体系、优势专业、申请流程及费用概况,旨在为有志于欧洲深造的学子提供一份全面且专业的指导。一、 德国留学:免学费理工强国,严谨学术天花板
德国以其世界顶尖的工程技术和严谨的学术传统,吸引着全球目光。作为制造业强国,德国的教育体系尤其在理工科领域享有盛誉。留学优势
费用友好:德国公立大学普遍免收本科和硕士学费,仅需缴纳少量学期注册费,年均生活成本约为10-12万人民币,显著低于英美等国。
工科顶尖:机械、汽车、电气、计算机、化工等领域全球领先,与行业巨头企业合作紧密,为学生提供丰富的实习和就业机会。
就业利好:德国作为制造业强国,毕业后留德工作政策相对宽松,所获学历在欧盟范围内认可度极高,为职业发展奠定坚实基础。
学历硬通:德国公立大学文凭全球认可度高,学术严谨,科研资源雄厚,含金量十足。
打工优势:在校期间,学生每年可合法打工120个全天或240个半天,假期可全职工作。时薪约10-15欧元,理工科实习多为带薪,收入可观。制造业、车企、IT行业岗位众多,专业匹配度高。
留签优势:毕业后可获得18个月的找工作签证,无行业限制。工作满2年有机会申请欧盟蓝卡或永久居留,紧缺工科专业甚至更快。持有德国工签可在欧盟内部自由迁徙工作。推荐院校及王牌专业
慕尼黑工业大学(TUM)(2026QS22):机械工程:
汽车工程、精密制造、机器人方向,与宝马/奥迪深度合作。电气工程:
电力系统、可再生能源、电力电子,能源转型研究领先。计算机科学:
人工智能、数据科学、网络安全,AI伦理研究中心实力强劲。航空航天:
飞行器设计、航空材料、卫星技术,对接欧洲航天局项目。工业工程:
供应链优化、生产管理,制造业就业优势明显。院校特点:
德国首批精英大学、TU9成员,被誉为“欧洲理工标杆”,与宝马、西门子等企业深度合作,科研转化率极高,欧盟创新排名前列。拥有欧洲最早的心脏医学中心——德意志心脏研究中心。优势专业:
慕尼黑大学(LMU)(2026QS58):医学:
临床医学、生物医学、公共卫生,附属医院资源顶级,科研转化强。物理学:
量子物理、凝聚态物理,拥有诺奖级科研团队。计算机科学:
算法、机器学习、生物信息学,跨学科项目丰富。经济学:
计量经济、金融市场、产业组织,德国顶尖。心理学:
认知神经科学、临床心理学,德语区标杆。院校特点:
德国顶尖综合研究型大学,43位诺贝尔奖得主,LERU创始成员。18个学院覆盖全学科,医学、人文、理工均衡发展。优势专业:
海德堡大学(2026QS80):生命科学:
分子生物学、基因编辑、神经科学,与欧洲分子生物学实验室合作。医学:
肿瘤学、免疫学、转化医学,附属医院临床资源一流。法学:
民法、刑法、欧盟法,大陆法系研究高地。计算机科学:
计算语言学、医学影像处理,交叉学科突出。历史学:
古代史、欧洲史,人文底蕴深厚。院校特点:
德国最古老的大学,57位诺贝尔奖得主,生命科学、医学、法学排名靠前。欧洲研究型大学联盟成员,与德国癌症研究中心(DKFZ)合作紧密。优势专业:申请时间
冬季学期(10月入学):大多数院校的截止日期为7月15日;慕尼黑工大等热门院校5月31日截止;部分英语授课硕士项目在3-6月截止。
夏季学期(4月入学):大多数院校的截止日期为1月15日,部分院校会提前。
重要提示:APS审核必做,耗时3-6个月,务必提前完成。跨专业申请对课程匹配度要求高,需提前核对课程描述。申请要求及学费
学历门槛:本科:
211大学完成1学期,或非211大学完成3学期,或高考成绩达到中国二本线可申请预科。硕士:
要求专业高度匹配,均分80+,申请名校建议85+。
必备审核:中国学生需通过APS审核(学历真实性核查),本科生申请TestAS,硕士生申请面谈审核。
语言要求:德语授课:
德福4X4或DSH-2。英语授课:
雅思6.5+,商科或部分理工科可能需要GRE/GMAT。
费用:公立大学本科/硕士免学费,仅收取每学期200-400欧元的注册费;生活费年均8-10万人民币。二、 法国留学:精英教育+艺术商科双巅峰,公立低费高商硬核
法国以其独特的精英教育体系、浪漫的艺术氛围和顶尖的商科教育闻名全球。留学优势
教育分层:公立大学学费低廉,高等商学院(高商)和工程师学院提供精英教育,商科、工科、艺术领域均处于世界领先水平。
专业强势:奢侈品管理、时尚设计、航空航天、酿酒、人文社科等专业世界知名。
双语言优势:英语授课项目丰富,同时掌握法语,能更好地适应欧盟多国职场。
福利完善:住房、交通、餐食补贴多,留学生可享受本地社保,留法就业通道顺畅。
打工优势:在校期间允许每周工作最多20小时,假期可全职工作。最低时薪约11欧元,企业实习普遍带薪。巴黎、里昂等商圈岗位多,奢侈品、文旅、商科领域匹配度高。
留签优势:毕业后可获得12个月的找工作签证(APS),可续签至24个月。获得正式工作后即可转为工作签证,满5年可申请永居。法语+英语双背景在欧盟及非洲法语区就业渠道广泛。推荐院校及王牌专业
巴黎文理研究大学(PSL)(2026QS21,法国第1):数学:
代数几何、应用数学,菲尔兹奖摇篮。物理学:
量子物理、天体物理,与欧洲核子研究中心合作。哲学:
现象学、政治哲学,全球顶尖。数据科学:
英语授课,AI伦理、金融科技方向。特点:
跨学科资源密集,奖学金丰富,适合学术与科研导向学生。院校特点:
在工学、文学、理学、经济学和医学等领域拥有崇高的学术地位和广泛影响力。由巴黎高师、巴黎天文台等20余所顶尖机构合并而成,学术处于金字塔尖,多位诺贝尔奖/菲尔兹奖得主,科研与人文双强。优势专业:
巴黎理工学院(IP Paris)(2026QS41,法国第2):航空航天工程:
飞行器设计、推进系统,与空客研发合作。电子工程:
5G、半导体,与法国电信Orange联合实验室。能源工程:
核能、可再生能源,与法国电力EDF实训。数据科学与人工智能:
算法优化、工业AI。特点:
工程师文凭欧盟认证,毕业生起薪约5.5万欧元/年,3个月内就业率87%。院校特点:
法国工程师教育标杆,由五所顶级工程学院合并,校企合作紧密。与CNRS、INRIA、CEA等法国国家研究机构及巴黎萨克雷大学紧密合作,提供前沿研究和培训计划。研究围绕能源与气候变化、安全、数字、技术与健康等五个优先领域。优势专业:
巴黎萨克雷大学(Paris-Saclay)(2026QS70,法国第3):电力工程:
智能电网、电力电子,与法国电力合作。计算机科学:
高性能计算、网络安全,参与欧洲超级计算项目。生命科学:
基因编辑、生物医药,与赛诺菲合作。材料科学:
纳米材料、新能源材料。特点:
理工学科欧洲前三,产学研结合紧密,就业覆盖科技巨头与科研机构。院校特点:
坐落于法国巴黎萨克雷高原,毗邻巴黎理工学院,是世界顶尖研究型大学,法国卓越大学计划高校,被誉为“法国科学跳动的心脏”。理工王牌,19位诺贝尔奖得主,整合了巴黎第十一大学与多所工程师学院。优势专业:
巴黎政治学院(Sciences Po):政治学:
比较政治、欧洲治理,法国总统母校。国际关系:
全球治理、外交政策,联合国实习机会。公共管理:
公共政策、城市治理,与世界银行合作。传播与媒体研究:
政治传播、数字媒体。特点:
国际化程度高,英语授课项目多,适合从政与国际组织方向学生。院校特点:
社会科学顶尖学府,专注于政治学、国际关系、公共管理,校友遍布全球政界与国际组织,被誉为“法国社会精英的摇篮”,培养出4位世界货币基金组织前总裁、顾拜旦等杰出校友。优势专业:
巴黎高等商学院(HEC Paris):管理学硕士(MIM):
连续10年全球第一。MBA:
金融、咨询方向,平均GMAT710。奢侈品管理:
与LVMH/迪奥等合作。金融硕士:
投资银行、资产管理,就业率100%。特点:
商科精英摇篮,毕业生平均起薪8.5万欧元/年,3个月内就业率95%。院校特点:
由巴黎工商会于1881年创立,法国最负盛名的商学院,世界最著名的商学院之一,被《金融时报》评为“欧洲第一商学院”。优势专业:申请时间
公立大学直入(秋季9月入学):基本上10月1日-12月15日开放申请,次年4-6月可能进行补录。
本科通过Parcoursup系统:一般在5月1日截止(非欧盟学生)。
高商(HEC/ESSEC/ESCP等):分4-5轮申请,首轮在9-10月(如五校联考首轮10月8日),末轮次年4月,早申请早录取优势大。
艺术院校:巴黎国立高等美院等在2-4月截止,需提前准备作品集。
重要提示:CampusFrance面签需提前3-6个月预约,高商申请重视GMAT成绩与实习经历。申请要求及学费
学历要求:本科:
高考成绩需达到本科线/一本线。硕士:
需本科相关专业背景,均分80+,名校建议85+。
语言要求:法语授课:
DELF B2+,文科专业可能要求C1。英语授课:
雅思6.5+,高商申请需GMAT 600+,顶尖高商建议700+。
申请系统:公立大学:
通过CampusFrance/Parcoursup系统。高商:
可通过SAI、Pass-World联盟或学校官网直接申请。工程师学院:
通常有单独的竞考。
费用:公立大学注册费年均2000-4000欧元;高商/私立艺术院校年均1-2万欧元;生活费巴黎年均10-12万人民币,外省6-8万人民币。三、 意大利留学:艺术圣地+综合强校,计划生通道友好
意大利作为文艺复兴的发源地,以其深厚的艺术底蕴和独特的专业优势,成为艺术类和设计类学生的热门选择。留学优势
艺术殿堂:美术、音乐、设计、建筑等专业在全球范围内享有顶级声誉,美术学院、音乐学院资源独一无二。
费用亲民:公立大学免收学费,仅收取注册费,年均生活成本约为8-10万人民币。
英语+小语种:提供英语授课课程,同时学习意大利语可培养稀缺小语种人才,增强就业竞争力。
生活宜居:文化氛围浓厚,美食丰富,生活品质高,申根区通行便利。
打工优势:在校期间每周最多可工作20小时,时薪约7-10欧元。旅游、设计、餐饮岗位充足,艺术生可接项目兼职,收入可覆盖大部分生活费。
留签优势:毕业后可获得12个月的找工作签证,可延期。设计、艺术、文旅行业本土需求稳定,工签审批友好。申根区通行,小语种人才在国内意企、跨境文旅行业具有优势。推荐院校及王牌专业
米兰理工大学(2026QS98,意大利第1):建筑学:
QS排名第7,绿色建筑、历史建筑修复。工业设计:
与Armani共建实验室,产品创新方向。机械工程:
全英语授课,就业率92%。数字交互设计:
服务设计、用户体验。特点:
设计与工程双强,实习覆盖Enel、法拉利等知名企业,毕业生受全球企业青睐。院校特点:
坐落于意大利米兰,仅专注于设计、建筑与工程技术领域,不设置文、法、医等学院。欧洲工程与设计顶尖院校,校企合作密集,国际学生奖学金丰富。优势专业:
罗马大学(2026QS128,意大利第2):临床医学:
附属医院实习顶尖,外科、神经科方向。计算机科学:
参与CERN项目,AI、高性能计算。航空航天工程:
与意大利航空合作,飞行器设计。古罗马史:
考古现场实践。特点:
医学与人文顶尖,科研实力强,性价比高。院校特点:
意大利规模最大的公立大学,科研资源雄厚,医学、工程、人文突出,部分专业英语授课,就业覆盖跨国企业与科研机构。优势专业:
佛罗伦萨美术学院:绘画:
油画、壁画修复。雕塑:
传统技法、当代材料。视觉艺术:
装置、行为艺术。艺术新技术:
数字艺术、VR创作。特点:
纯艺术殿堂,适合传统与当代艺术结合学习。院校特点:
世界最古老的美院之一,文艺复兴艺术底蕴深厚,藏有《大卫》等珍品。纯艺术教育顶尖,著名校友包括达芬奇、米开朗基罗、拉斐尔、提香等。与意大利马兰欧尼学院并称造型类和设计学的双雄。优势专业:
博科尼大学(Bocconi University):工商管理(MBA):
金融、咨询方向。经济学与计量经济学:
全球排名靠前。奢侈品管理:
与Prada/Gucci合作。数据科学与商业分析:
英语授课。特点:
商科精英摇篮,行业资源强,适合职业发展导向学生。院校特点:
位于意大利米兰的私立大学,世界著名的商学院之一,欧洲商科殿堂。校友网络遍布投行、咨询行业,课程国际化,就业薪资领跑意大利。被广泛认为是欧洲最顶尖的社会科学高等教育和研究机构之一。优势专业:申请时间
米兰理工大学(2026/27入学):工程类首轮申请10月1日-12月1日,第二轮1月13日-2月26日;建筑专业需在1月30日前提交作品集。
博洛尼亚大学:分四轮申请,首轮1月16日截止,末轮大约在6月。
国际生(秋季9月入学):大多数院校在3-6月截止申请,签证与预注册在7-8月完成。
计划生(马可波罗/图兰朵计划):国内语言学习通常在7-10月,境外语言班在11月开课,次年9月正式入学;预注册在7-8月。
重要提示:艺术/设计类专业需提前准备作品集,双认证材料办理需提前3个月。申请要求及学费
申请途径:普通生:
直申。计划生:
马可波罗计划(综合类)、图兰朵计划(艺术类),需赴意读10-11个月语言课程。
成绩要求:计划生:
高考成绩≥300分。图兰朵计划:
(高考成绩 + (艺考分数/艺考满分)×750)÷2 ≥ 400分。
语言要求:意大利语授课:
B2+,艺术生C1。英语授课:
雅思6.0+。
材料要求:学历文件需进行双认证,艺术类学生必备作品集。
费用:公立大学注册费年均1000-4000欧元;私立艺术/商科院校年均1-2万欧元;生活费年均7-9万人民币。四、 荷兰留学:全英文授课+高就业,研究型与应用型双轨
荷兰以其高水平的全英文授课环境、卓越的商科与理工教育以及友好的就业政策,成为非小语种背景学生的热门选择。留学优势
全英授课:欧洲英语授课项目最丰富的国家之一,无需小语种基础即可入学。
商科/理工强:物流、供应链、农业、环境科学、人工智能、商科等领域排名顶尖。
国际化程度高:高校全球交流机会多,校友网络遍布跨国企业,英语普及率在欧洲位居前列。
就业友好:众多跨国公司欧洲总部设于荷兰,毕业可获得SearchYear居留签证,方便求职。
打工优势:在校期间每周最多可工作16小时,假期可全职打工。英语普及率近100%,无需荷兰语即可找到兼职。时薪约10-12欧元,跨国企业实习资源极其丰富。
留签优势:毕业后可获得1年的SearchYear居留签证,允许自由求职或创业。欧盟蓝卡门槛较低,高技术岗位工作满5年可申请永居。鹿特丹、阿姆斯特丹等城市聚集大量跨国企业总部,就业选择多。推荐院校及王牌专业
代尔夫特理工大学(TU Delft)(2026QS48,荷兰第1):建筑学:
QS排名第3,RIBA认证,绿色建筑、参数化设计。航空航天工程:
风洞实验室,飞行器设计、推进系统。水利工程:
三角洲治理,与代尔夫特水力学研究所合作。计算机工程:
嵌入式系统、AI,ASML定向招聘。特点:
工程学科实力顶尖,科研与产业结合紧密,国际声誉与就业前景双优。院校特点:
欧洲理工标杆,有“欧洲麻省理工”之称。校企合作覆盖ASML、飞利浦、壳牌等,毕业生就业率超过95%。在微电子方面,拥有自己的芯片生产公司和研发中心。优势专业:
阿姆斯特丹大学(UvA)(2026QS58,荷兰第2):传播学:
数字媒体、政治传播,拥有全球最大研究中心之一。心理学:
认知神经科学、临床方向,与阿姆斯特丹医学中心合作。人工智能:
机器学习、自然语言处理(NLP),与CWI联合培养。金融工程:
ING、ABN AMRO等银行实习机会。特点:
社科与AI双强,英文授课比例高,国际学生占比35%,适合跨学科学习。院校特点:
荷兰规模最大的综合性大学,社会科学与AI强势。ILPS实验室与Google/Meta深度合作。获得EQUIS、AACSB、AMBA三项国际认证。优势专业:
乌得勒支大学(Utrecht University,UU)(2026QS104,荷兰第3):分子生命科学:
干细胞、发育生物学,科研经费4700万欧元。临床医学:
肿瘤学、神经科学,附属医院实习。地球与环境科学:
气候变化、可持续发展。法学:
欧盟法、国际法,与国际法院合作。特点:
生命科学与医学实力突出,科研导向,适合学术深造。院校特点:
荷兰科研经费第一,生命科学与医学顶尖。Hubrecht研究所干细胞研究领先,获得12项欧盟HORIZON项目支持。优势专业:
瓦格宁根大学(WUR)(2026QS115,荷兰第5):食品科学与工程:
食品创新、安全,与联合利华合作。环境科学:
生态修复、循环经济。植物科学:
基因编辑、精准农业。动物科学:
畜牧业可持续发展。特点:
农业与环境领域全球标杆,就业覆盖跨国企业与国际组织。院校特点:
全称荷兰瓦赫宁根大学及研究中心,位于荷兰瓦格宁根市,是一所世界著名研究型大学,荷兰U类大学。科研聚焦可持续发展,与联合国粮农组织合作紧密。优势专业:申请时间
U类大学(研究型):大多数院校在3月1日/4月1日/5月1日截止;代尔夫特理工热门专业在1月15日截止;阿姆斯特丹大学大多数专业在3月1日截止,部分4月1日。
H类大学(应用科学型):4-6月截止,部分在6月仍可申请。
奖学金申请:通常在前一年的12月至当年的2月截止,比专业申请提前3-5个月。
重要提示:申请通过Studielink统一提交,热门专业实行“早申早录”,名额满即停止招生。申请要求及学费
院校分类:荷兰大学分为U类研究型大学(学术深造导向)和H类应用科学大学(就业导向)。
学历要求:U类本科:
高考成绩达到中国一本线,或在国内大学完成大一课程。硕士:
需相关专业背景,均分75+,名校建议80+。
语言要求:雅思6.5(小分不低于6.0)或托福90+,商科/法学部分专业可能需要GMAT/GRE。
费用:学费年均8000-15000欧元;生活费年均9-11万人民币。工签政策友好,毕业后可在荷兰居留1年找工作。结语
欧洲四国——德国、法国、意大利、荷兰,各自拥有独特的教育优势和留学特色。无论是追求严谨的理工科教育,还是向往浪漫的艺术氛围,亦或是看重高性价比和国际化就业机会,都能在这些国家找到适合自己的留学路径。希望这份详细的攻略能帮助广大中国学子明晰目标,做好充分准备,开启精彩的欧洲留学之旅。
感谢关注 ⬇️
2026-03-02
📑 文章目录
Basic Information英文标题:GPCR drug discovery: new agents, targets and indications中文标题:G蛋白偶联受体药物发现:新型药物、靶点与适应症发表日期:03 March 2025文章类型:Review Article所属期刊:Nature Reviews Drug Discovery文章作者:Javier Sánchez Lorente | David E. Gloriam文章链接:https://www.nature.com/articles/s41573-025-01139-yAbstractPara_01G蛋白偶联受体(GPCRs)构成了最大的药物靶点家族之一,反映了它们在众多病理生理过程中的参与作用。在这篇综述中,我们分析了GPCR超家族的药物研发趋势,涵盖了已获得监管批准或正在临床试验中研究的化合物、靶点和适应症。我们发现有516种获批药物作用于GPCRs,占所有获批药物的36%。这些药物作用于121个GPCR靶点,占所有非感觉性GPCRs的三分之一。此外,目前有337种作用于133个GPCRs的药物正在进行临床试验,其中包括30个新靶点。值得注意的是,其中165种药物是已获批药物,正被测试用于新的适应症,而新型药物越来越多地成为变构调节剂和生物制剂。特别值得一提的是,2023年针对GPCRs的糖尿病和肥胖症药物销售额接近30亿美元,且代谢性疾病、肿瘤学和免疫学领域GPCR调节剂的临床试验数量正在显著增加。最后,我们强调了尚未开发的靶点-疾病关联以及通路偏向性信号传导的潜力。总体而言,这篇综述为已用药和潜在可药用GPCR组提供了最新的参考资料,以支持未来的GPCR药物发现与开发。IntroductionPara_01G蛋白偶联受体(GPCRs)构成了一个包含约800种膜蛋白的超家族,这些蛋白由胞外刺激物激活,共享由七个螺旋组成的典型跨膜结构域,并与胞内转导蛋白(主要是G蛋白和阻遏蛋白)偶联。大多数GPCR具有共同的进化起源1,它们共同参与调控复杂的信号传导系统,影响无数生理和病理生理过程。因此,GPCRs一直是各大主要治疗领域频繁作用的靶点2,而且目前所有获批药物中超过30%都是以GPCRs为靶点2,3。多种以GPCR为靶点的药物被列入了世界卫生组织(WHO)基本药物标准清单,或实现了重磅销售业绩,例如司美格鲁肽(semaglutide)和替尔泊肽(tirzepatide),它们均以胰高血糖素样肽-1受体(GLP-1R)为靶点,用于治疗糖尿病和肥胖症。Para_02在‘GPCR’这一术语被创造出来之前,甚至在受体概念被提出之前,有关GPCR的药物研发历史就已经开始了(图1)。最早有详细记录的关于作用于GPCR的药物研究可以追溯到十九世纪,当时描述了鸦片生物碱(如吗啡)于1805年被分离和医学应用(参考文献4),以及1875年毒扁豆碱的分离和医学应用(参考文献5)。二十世纪中叶,人们发现了由一种被称为‘肾上腺素受体’的假设实体介导的肾上腺素分子功能。大约用了40年的时间才揭示这种由G蛋白介导的信号传导机制(例如,参考文献7、8、9)。这些进展分别获得了1994年、2000年和2012年的诺贝尔奖(参考文献10)。这些科学进步支持了许多已获批的主要靶向GPCR药物的研发,包括首批开创性药物,如首个β受体阻滞剂普萘洛尔和首个抗精神病药物氯丙嗪。
Fig. 1: Timeline of GPCR drug discovery.
- 图片说明
◉ 研究G蛋白偶联受体(GPCRs)所选定的重要里程碑和药物批准(分别显示于箭头的右侧和左侧)。发现的日期基于相关研究项目的发表日期。◉ 药物批准的日期基于在试验环境之外首次大规模使用该药物的日期/首次监管批准,或者根据Drugs@FDA的批准日期(如果其他来源不明确的话)。◉ 对研究成果的选择主要限于一般的科研项目,并未专注于特定的受体家族。◉ 肾上腺素能受体的研究也被包括在内,因为这是同类研究中首个获得诺贝尔奖的研究。◉ 药物是根据其是否出现在世界卫生组织(WHO)基本药物标准清单(2023年版)中进行选择的,同时考虑了首次靶向特定GPCR的药物、具有活性成分新分子结构(如抗体)的药物或具有巨大市场潜力的药物。◉ 相关的关键药物靶点以括号形式表示。◉ 这些药物被标识为小分子(蓝色)或生物制剂(红色)。◉ 半圆表示某种药物来源于天然物质,或是天然配体的精确类似物。◉ 再摄取抑制剂和全身麻醉药物未被列入列表,因为GPCR很可能是这些药物的次要靶点。◉ 由于雷尼替丁已被广泛停用,因此也已从列表中移除。◉ 与时间线相关的完整研究项目列表见补充表5。◉ cryo-EM代表冷冻电子显微镜;XRC代表X射线晶体学。◉ 在本综述中,所有受体的命名均按照国际基础与临床药理学联盟(IUPHAR)命名委员会的命名规则进行命名,详见其数据库《药理学指南》。Para_03在20世纪80年代末至90年代,随着对药物-靶点相互作用的理解不断深入,人们逐渐认识到配体不仅可以选择性地激活特定受体,还可以选择性地触发不同的细胞内转导蛋白,从而为一种被称为‘偏向信号传导’的新范式铺平了道路。此外,研究还表明配体可以在远离生理配体结合位点(即‘正构位点’)的其他位置(即‘变构位点’)结合。这些机制为设计副作用更少的药物提供了新的可能性。Para_042000年(参考文献16)和2007年(参考文献17、18),人们首次通过X射线晶体学解析出两种主要的G蛋白偶联受体(GPCR)原型结构,分别是牛视紫红质和β2-肾上腺素受体,这些研究报告揭示了它们高分辨率的整体结构,提供了作用机制的见解,并使得基于结构的药物设计成为可能。此后,随着许多其他GPCR的X射线结构解析,以及冷冻电子显微镜(cryo-EM)和核磁共振(NMR)技术在小分子-受体相互作用及受体动态研究方面的进展,上述研究得到了进一步推动。此外,利用生物制剂如单克隆抗体(mAbs)靶向GPCR的研究也逐渐加速,并在2018年实现了一个重要里程碑:美国食品药品监督管理局(FDA)批准了首个靶向GPCR的单克隆抗体药物——用于预防偏头痛的erenumab。Para_05在这里,我们分析了针对G蛋白偶联受体(GPCR)超家族的药物研发趋势,涵盖了已获得监管批准以及正在进行临床试验的药物、靶点和适应症。与我们2017年的上一次分析(参考文献2)相比,我们整合了更多的数据资源,扩展到了美国食品药品监督管理局(FDA)以外的监管机构,并新增了对公司网站和新闻稿的注释(有关数据集和分析的详细信息,请参见附框1)。这是我们首次将重新定位药物和重新定向GPCR的临床试验与首次进入临床试验的全新药物和靶点分开进行分析。此外,我们在一个专门面向GPCR药物发现的新网络资源中提供了所有数据和一个靶点选择工具。我们通过讨论这些观察结果的局限性和药物研发潜力,并结合该领域在作用机制和治疗方式上的最新进展,为我们的分析提供了背景信息,同时进一步引用了专注于相关主题的专业综述。因此,本分析及时地概述了新的发展趋势,并提供了关于GPCR治疗靶向未来方向的数据和洞见。
[div_box]Drug and target overviewApproved drugs
已批准的药物Para_01我们确定了516种针对G蛋白偶联受体(GPCR)以发挥治疗作用的独立药物,这些药物目前在北美(美国和加拿大)、欧洲、亚洲(日本、韩国和印度)以及澳大利亚上市。这些靶向GPCR的药物约占所有获批药物的36%,这一比例略高于之前报道的30%-33%。在过去五年中(自2019年以来),有37种靶向GPCR的新药获得批准,其中包括7种首次获得批准的受体:葡萄糖依赖性促胰岛素多肽(GIP)受体(GIPR)、GPRC5D、C5A1、神经激肽-3(NK3)受体以及黑色素皮质素受体3、4和5(MC3/4/5)。最近获批的药物是KarXT(Cobenfy),它由昔诺美林(一种M1/M4型毒蕈碱型乙酰胆碱受体选择性激动剂)和曲司氯铵(一种外周毒蕈碱拮抗剂)组成,是首个用于治疗精神分裂症的同类疗法(详见下文)。
Table 1 New molecular entities targeting GPCRs approved in the last 5 years (since 2019) 表1 近5年(自2019年以来)获批的以G蛋白偶联受体(GPCRs)为靶点的新分子实体
Agents in clinical trials
临床试验中的药物Para_01利用来自ClinicalTrials.gov的数据(附表1),我们确定了目前正处于临床试验阶段的337种药物,其中172种为新药,165种为重新定位用途的现有药物(图2a)。在这些新药中,分别有51种、76种和45种已进入I期、II期和III期临床试验(图2b)。因此,预计在未来几年内,还将有相当数量的新药获得批准。
Fig. 2: GPCRs as targets of approved drugs and drug candidates and their therapeutic associations.
- 图片说明
◉ a,新型和已有药物作用的G蛋白偶联受体(GPCR)的概述。◉ b,处于最高临床阶段及所有临床阶段的新型和重新定位药物,以及新型和重新靶向的GPCR的分布情况。◉ c,根据各GPCR最先进化合物的状态对其进行分类。◉ 数据来自Open Targets、DrugBank和ClinicalTrials.gov(见附注1),经过收集、清洗和整理。◉ GPCR靶点依据其内源性配体被分为不同的类别和受体家族。◉ 如果某个靶点被至少一个已批准的药物作用,则被认为是已被药物靶向的。◉ 某个靶点被认为处于I期、II期或III期,是基于所有针对该靶点的药物所处的最高临床阶段来判断的。◉ 未被药物靶向的受体则依据来自Open Targets的疾病关联评分被归类为相关或无关。Map of clinically targeted GPCRs
临床靶向GPCR图谱Para_01总体而言,已有121种GPCR被‘药物作用’——即有批准的药物作为靶点(图2b),占全部362种非感官类人源GPCR的三分之一(33%)。此外,目前有133种GPCR正被处于临床试验阶段的药物所靶向,其中30种受体尚无获批的靶向药物(图2a)。值得注意的是,有51种受体目前涵盖了药物开发的所有4个阶段。总体而言,这使得在GPCR超家族中,受到治疗性靶向的受体数量增加至151种,占所有非感官类受体的41%。Para_02为了绘制跨GPCR超家族的治疗相关性,我们将所有获批药物与GPCR靶点进行了关联,这些靶点被分类为不同的类和受体家族,并由内源性配体定义(图2c;见补充图1)。151个临床GPCR靶点主要属于A类(130个靶点),其次是B1类(13个靶点)、C类(7个靶点)和F类(1个靶点)。目前尚无针对B2类/黏附型GPCR的治疗药物进入临床试验,该类别中包含多个潜在药物靶点。Top-selling drugs
最畅销的药物Para_01在2023年最畅销的50种药物中,有5种是以GPCR为靶点的产品(图3a)(见补充表1)。其中,产品Entresto(沙库必曲/缬沙坦)适用于治疗心力衰竭和高血压。该组合中较新的药物沙库必曲靶向的是中性内肽酶,而血管紧张素受体阻滞剂缬沙坦多年来已有单独的仿制药形式上市。另外四种产品(含三种独特化合物)用于代谢类疾病的适应症:2型糖尿病(Ozempic(司美格鲁肽)、Trulicity(度拉糖肽)和Mounjaro(替尔泊肽))以及肥胖(Wegovy(司美格鲁肽))。值得注意的是,这三种化合物均靶向GLP-1R,而替尔泊肽同时还作用于GIPR。司美格鲁肽、沙库必曲/缬沙坦和替尔泊肽的销售额正在迅速增长,并且预计这一趋势将持续下去(见相关链接)。Zepbound(替尔泊肽)也于2023年11月获批用于治疗肥胖。
Fig. 3: Top compounds and targets across the marketed, repurposed and novel spaces.
- 图片说明
◉ a,2023年销售额最高的G蛋白偶联受体(GPCR)药物。◉ b,目前在临床试验中适应症数量最多的十大重新定位药物。◉ c,在临床试验中首次测试的多种适应症药物。◉ d–f,在获批药物中靶点拥有最多药物的数量(d图),重新定位药物中靶点拥有最多药物的数量(e图),以及进入临床试验的非药物靶点(f图)。Top targets
首要目标Para_01为了确定哪些GPCR被‘药物干预’最多,我们识别出了拥有最多获批药物的前十大靶点(图3d)。排名前十的GPCR(下文各节中进行了总结)拥有令人印象深刻的41至65个获批药物。值得注意的是,它们全部属于胺能受体亚家族,这些受体可被多巴胺、组胺、肾上腺素、血清素或乙酰胆碱内源性激活。这些靶点的主要治疗应用总结于补充表2中,而它们在新适应症中的应用则在‘用于新适应症探索的胺能前十大靶点’部分中进行了描述。针对胺能受体的众多获批药物反映了它们是最早被发现、获得药理学检测方法并进行结构表征的受体(图1)。此外,胺能配体也较早被发现,并且共享一个适合设计小分子药物类似物的共同药效团。此外,胺能信号系统调节多种生理功能,并成为常见疾病如哮喘、过敏和高血压治疗药物的作用靶点。Novel agents and targets entering clinical trialsNew agents
新代理Para_01在这里,我们分析了临床试验中各类药物在选择性、作用方式和分子类型方面的趋势。与2017年我们的分析相比,此次我们更全面地捕捉了趋势,通过将进入临床试验的新药与正在被研究用于新适应症(重新定位)的已批准药物区分开来。所有已获批的药物都被保留作为现有治疗药物的基准参考。Target selectivity
目标选择性Para_01虽然多靶点活性可能对某些治疗具有益处,例如精神分裂症26或肥胖症27的治疗,但为了防止有害的不良反应,通常更倾向于单一靶点的选择性。在我们2017年的分析中发现,在较早阶段的药物研发中,选择性往往高于后续阶段(即,I期临床试验中的药物平均而言比II期临床试验中的药物更具选择性,且在每一对连续阶段之间也呈现出相同的趋势)。此外,作用于多个靶点的药物更常被终止临床试验。在这里,我们将首次进入临床试验的新药单独进行分析,发现选择性增强的趋势更加明显。令人惊讶的是,77%的新药仅具有单一靶点,20%具有两个靶点,只有3%的新药具有三个或更多的靶点(图4a)。相比之下,获批药物在临床试验中被重新用于新用途的比例分别为45%、18%和37%,这与整体获批药物的比例(48%、20%和32%)相似。
Fig. 4: Trends in GPCR-targeted agents and drugs.
- 图片说明
◉ a–c,新药和重新定位药物以及已批准药物的靶点数量(图a)、作用方式(图b)和分子类型(图c)。处于临床试验阶段的药物,如果尚未获批任何适应症则归类为新药,如果已经获批则归类为重新定位药物。已批准药物包括所有已获批的药物,无论其是否被重新定位。◉ GPCR,G蛋白偶联受体。Para_02对于旨在靶向一类受体中某个亚型的药物分子而言,实现选择性尤其具有挑战性,因为这些受体共享一个高度保守的正构结合位点,用于结合其内源性配体。最大的此类受体家族——5-羟色胺受体家族,共有12个亚型。此外,总体上有36种生物胺类受体亚型,它们都具有相似的结合位点和配体,包括乙酰胆碱、肾上腺素、多巴胺、组胺、5-羟色胺和酪胺。我们的数据显示,与靶向其他类型GPCR的药物相比,靶向生物胺类受体的药物平均作用靶点数量明显更高(分别为平均每种药物作用于2.8个靶点和1.6个靶点)。然而,最新的结构研究进展使得开发更具选择性的生物胺类受体配体成为可能,这一点最近已在α1-肾上腺素受体、D2受体、M3受体以及5-羟色胺受体的研究中得到证实。此外,在2023年,美国食品药品监督管理局(FDA)批准了吉吡罗酮上市,这是一种首个选择性作用于5-HT1A受体的激动剂药物,用于治疗重度抑郁症。Increasing proportion of allosteric modulators
变构调节剂的比例不断增加Para_01从药物作用机制的角度分析这些药物,具有抑制活性的药物所占比例出现了小幅下降(图4b)。然而,最新药物中最显著的趋势是变构调节剂的比例明显增加,新药中这一比例为8%,而所有已批准药物中仅为1%。此外,变构数据库(ASD)目前列出了约40,000种针对G蛋白偶联受体(GPCR)的变构配体,在过去7年中增加了约50%。总体而言,共有14种变构调节剂正在针对A类和C类GPCR进行I至III期临床研究,其中四种正在联合治疗方案中进行研究(见补充表3)。这些化合物均为小分子化合物,尼马西单抗(nimacimab)除外,后者是一种靶向大麻素受体CB1的抗体,用于治疗肥胖。Para_02在A类中,别构配体针对的是治疗精神分裂症和阿尔茨海默病的M4乙酰胆碱受体;治疗肥胖症的大麻素受体CB1;治疗痴呆和双相抑郁的多巴胺受体(D1/3);治疗狼疮、神经性疼痛和溃疡性结肠炎的鞘氨醇1-磷酸受体(S1P1);以及治疗1型糖尿病、新冠肺炎和急性呼吸窘迫综合征的趋化因子受体(CXCR1/2)。在C类中,代谢型谷氨酸受体mGlu2/3/5正被用于抑郁症、药物和酒精滥用、帕金森病、焦虑症、疼痛和癫痫的治疗靶点。该受体家族作为焦虑和应激障碍治疗的靶点已有超过二十年的历史,例如分别靶向mGlu1和mGlu5的别构调节剂LY367385和MPEP,但两者都在上市前被终止开发。目前有四种代谢型谷氨酸受体别构调节剂正在进行I/II期临床试验,用于多种神经精神疾病治疗。此外,还有一种针对酒精使用障碍的C类GABAB1/B2受体调节剂正在开展I期临床试验。Para_03值得注意的是,上述所有靶点都属于具有多个成员的受体家族,而变构调节为此类靶点提供了更高的亚型选择性优势,因为变构结合位点比正构结合位点的保守性更低。变构调节还具备其他额外的优势,包括对内源性配体的结合、效价、效能和(或)信号偏向进行微调,这种调节方式还可以通过提供时间选择性实现协同作用。它也可以调节一种正构药物的作用;例如,最近发现的一种μ受体调节剂能够增强阿片类解毒剂纳洛酮的效果。然而,与正构位点相比,变构位点在不同物种间的保守性也更低,因此动物模型可能无法很好地反映先前的体外实验结果,也无法准确预测随后在人体中进行的体内测试结果。Para_04在实验结构和模型中,跨膜结构域中的埋藏变构位点通常在配体结合位点没有配体时处于封闭状态,这种特性通过诱导契合机制塑造了结合位点。在跨膜结构域之外,灵活性可能会使基于结构的设计变得困难。然而,GPRC结构动力学方面的进展为揭示用于设计变构调节剂的隐秘口袋提供了潜在的机会。目前,已有27种变构配体与15种不同的受体形成了实验结构复合物(参见参考文献41中的‘结构’页面)。这些研究显示了许多分布在细胞外、细胞内以及膜界面处的变构位点,表明大多数(即使不是全部)GPCR都可能表现出变构效应。Growing popularity of antibodies and proteins/peptides
抗体以及蛋白质/肽类的日益普及Para_01我们分析了目前处于临床试验阶段的新药的分子类型(小分子、蛋白质/多肽或抗体)。与已获批的药物相比,新药中抗体所占比例更高(10% 对 1%),蛋白质/多肽的比例也更高(19% 对 12%),相应地,小分子的比例则较低(71% 对 87%)(图4c)。Para_02针对GPCR的新疗法正在拓展治疗的可能性。激动性抗体和纳米抗体有望特异性激活GPCR,与传统小分子相比,其具有更高的选择性、更长的半衰期,以及对中枢神经系统的暴露有限。例如,Maridebart cafraglutide(AMG 133)是一种双特异性分子,它将靶向GIPR的拮抗单克隆抗体与两个肽类GLP-1R激动剂结合,这种组合在减重方面显示出更强的效果。该药物已在肥胖症患者的I期临床试验中进行了测试,表现出可接受的安全性和耐受性。Volagidemab 是一种靶向胰高血糖素受体的拮抗单克隆抗体,目前正在进行II期临床试验,作为1型糖尿病胰岛素治疗的辅助疗法。尽管基于抗体的结合物的发现已经非常成熟,但筛选出具有功能活性的生物制剂(如激动剂或反向激动剂)更具挑战性,并且仅在少数靶点上取得成功。这些生物制剂可以对胞外区域有限的受体类别实现更具体构状态的控制,但也伴随着诸如免疫原性等挑战。肽模拟物结合了肽类和小分子的优点,提供了增强的稳定性和受体特异性,并已有多个主要针对A类受体的报道。环化可能有助于稳定肽模拟物的构象并提高其代谢稳定性,但实现足够的口服生物利用度和细胞通透性仍然是一个挑战。Agents being investigated for many indications
多名代理人因多项可疑迹象正接受调查Para_01尚未被批准为药物的药物研发分子平均每个分子有1.5个适应症。裸盖菇素是最引人注目的一个例子,目前正同时对其17个适应症进行研究(图3c)。裸盖菇素是一种由多种蘑菇产生的天然迷幻化合物,其作用靶点是5-HT2A受体,在包括强迫症(NCT05546658)、重度抑郁症(NCT04670081)、创伤后应激障碍(PTSD)(NCT05554094)和神经性厌食症(NCT05481736)等神经系统疾病的临床试验中受到广泛关注。在多个适应症中测试新研发分子是一种在肿瘤药物开发中的常见策略。例如,BMS-986340是一种处于二期临床阶段的抗体,其靶向趋化因子受体CCR8,正在用于治疗几种晚期实体瘤(NCT04895709)。腺苷受体拮抗剂etrumadenant、EP4拮抗剂ONO-4578、GRPR拮抗剂AAA603以及CXCR1/2抑制剂SX-682也正在多种癌症中单独或联合使用进行测试(NCT05886634、NCT05335941、NCT03821246、NCT06256328、NCT06247995、NCT04245397、NCT04599140、NCT05604560、NCT04574583)。Para_02自2017年我们的分析(参考文献2)以来,在多种条件下测试新药物的方法作为一种策略变得越来越流行,这可能反映出该方法与已批准药物的再利用具有共同的优势,包括降低完全失败的风险并提高成本效益。识别其他潜在适应症可以基于已有知识;例如,在相同疾病领域中的适应症,或者已经针对同一靶点进行过研究的适应症。此外,能够调节多个靶点的药物可能在更多样化的病理状况中具有应用潜力。Novel targets
新靶点Para_01值得注意的是,目前有30种GPCR尚无任何已批准的靶向药物,但正在临床试验中接受研究,其中5种GPCR拥有超过一种在研药物,这可能会提高最终获得批准的可能性(图3f;见补充表4)。新型靶点中数量最多的是A类GPCR,其中有9种趋化因子受体正被共计16种在研药物靶向作用。其他新的A类GPCR靶点包括胆囊收缩素受体CCK2、白三烯受体BTL1–2、血管紧张素受体AT2、阿片受体、脑胃肽受体BB2、溶血磷脂受体LPA1、蛋白酶激活受体PAR2、神经肽Y2受体、游离脂肪酸受体FFA1、NOP阿片受体以及孤儿受体GPR6、GPR52、GPR84、MAS1、MRGPRX2和MRGPRX4。最后四个新型GPCR靶点分别是血管活性肠肽1和2(VPAC1/2)受体以及mGlu2/3受体,它们分别属于B1类和C类GPCR。以下将讨论一些最受关注的新靶点。Chemokine receptors
趋化因子受体Para_01趋化因子是一类小分子信号蛋白,在免疫反应中参与炎症过程以及细胞(主要是白细胞)的迁移,并与癌症、炎症和自身免疫性疾病相关。目前已有针对多种趋化因子受体(包括CCR2、CCR6、CCR8、CXCR1、CXCR2、CXCR3、CXCR5、ACKR3和CX3CR1)的治疗药物正处于临床试验阶段。例如,reparixin是一种CXCR1和CXCR2的负变构调节剂,因其具有抗炎特性,正在用于治疗新冠肺炎(NCT05254990)和急性呼吸窘迫综合征(NCT05496868)的研究。同样针对这两个靶点的另一种变构抑制剂ladarixin,正在开展III期临床试验用于治疗1型糖尿病(NCT0462848)。Para_02其他趋化因子受体,包括CCR6、ACKR3、CXCR3和CXCR5,也正在被探索作为自身免疫性疾病的治疗靶点,相关候选药物包括PF-07054894(CCR6激动剂)、ACT-1004-1239(ACKR3拮抗剂)、ACT-777991(CXCR3拮抗剂)和PF-06835375(CXCR5抗体)。在这些药物中,只有PF-06835375已进入II期临床开发(NCT05070845),而其他药物仍处于更早期阶段,例如首次人体药代动力学评估。Para_03有趣的是,所有以 CCR8 为靶点的药物均为抗体(BAY3375968、BMS-986340、GS-1811、S-531011),这些药物正在开展针对实体瘤的 I 期或 II 期临床试验(NCT05537740、NCT04895709、NCT05007782、NCT05101070),单独使用或与免疫检查点阻断剂/化疗联合使用。Para_04趋化因子受体自30年前被发现参与HIV进入免疫细胞的过程后,便成为药物研发的重要靶点。以CCR5为靶点治疗HIV感染的马拉维罗(Maraviroc)和通过靶向CXCR4促进干细胞动员的普乐沙福(Plerixafor)分别于2007年和2008年获批上市。然而,许多针对这一受体家族的小分子药物候选物由于种种原因在临床试验中失败,例如在多个受体可能具有冗余作用的复杂疾病中仅靶向单一趋化因子受体存在局限性。开发可靶向多个受体的调节剂或多机制抗体,如利用抗体依赖性细胞介导的细胞毒作用(ADCC)进行癌症治疗的抗体,有望解决上述问题,这一点已通过靶向CCR4的抗体莫加珠单抗(Mogamulizumab)获批得到验证。有趣的是,在目前靶向趋化因子受体的22种药物中,有9种是抗体类药物。Lipid receptors
脂质受体Para_01许多脂质激活的G蛋白偶联受体(GPCR)可调节炎症以及心血管系统的稳态。白三烯BTL1–2和补体C5a受体可被同一种药物诺卡普单抗(nomacopan)靶向作用。该药物曾被研究用于治疗自身免疫性皮肤病大疱性类天疱疮,但进一步的研究因商业决策而被撤回(临床试验编号:NCT05061771)。目前该药物正在一项III期临床试验中用于移植相关血栓性微血管病的治疗(临床试验编号:NCT04784455)。NOP receptor
NOP受体Para_01目前尚无针对NOP受体的获批药物。然而,非选择性部分NOP受体激动剂Cebranopadol已在临床试验中用于疼痛管理,并且正在进入针对急性疼痛适应症的III期临床试验(NCT06545097,NCT06423703)。Class A orphan receptors
A类孤受体Para_01孤受体是对那些尚未确定其生理配体的G蛋白偶联受体(GPCR)的统称。我们发现该组中有六个受体目前正被作为临床试验的靶点:GPR6、GPR52、GPR84、MAS1、MRGPRX2和MRGPRX4。Para_02GPR6(参考文献71)和GPR52(参考文献72)是神经疗法的靶点,而GPR84则是神经病理性疼痛的靶点。处于I/II期临床试验阶段的药物包括:CVN424,其靶向GPR6用于治疗帕金森病(NCT04191577,NCT06006247);NXE0048149,其靶向GPR52用于治疗精神分裂症(ISRCTN17231793);以及BAY 3178275,其靶向GPR84用于治疗糖尿病性神经病理性疼痛。Para_03MAS1、MRGPRX2 和 MRGPRX4 属于同一个受体家族。MAS1 被认为可被血管紧张素代谢产物激活,而血管紧张素-(1–7)的一种合成类似物——塔尔法司肽(Talfirastide,TXA127)目前正处于II期临床试验阶段,用于治疗心血管疾病,包括缺血性卒中后状态(NCT06135103)和与杜氏肌营养不良症相关的心肌病(NCT06013839)。针对 MRGPRX2,EP262 正在被研究用于治疗荨麻疹(NCT06077773、NCT06050928)和特应性皮炎(NCT06144424)。对于 MRGPRX4,EP547 已被开发用于治疗瘙痒症(NCT05525520)。Para_04值得注意的是,这六种受体中有四种——GPR52(参考文献78,79)、GPR84(参考文献80)、MRGPRX2(参考文献81,82)和MRGPRX4(参考文献82)——已有晶体或冷冻电镜结构,这有助于基于结构设计新的药物化学类型,而GPR6和MAS1仍有待进行结构表征。Drug repurposing and GPCR retargetingDrug repurposing
药物再利用Para_01药物的再利用——这里定义为将已经获批的药物用于新的适应症——可能会缩短药物开发的时间,降低其成本和风险,因为可以利用已有的知识,例如关于药物安全性的特征。药物再利用一直是靶向GPCR(G蛋白偶联受体)的一种高度成功的策略。60%的靶向GPCR药物具有一个以上的适应症,所有获批的作用于该靶点家族的药物平均每个有2.5个适应症。而此前的研究估计,50%的所有获批药物具有附加适应症。目前,在I期(4种药物)、II期(51种药物)和III期(110种药物)临床试验中,共有165种获批的靶向GPCR药物正在测试新的适应症,平均每种药物有2.7个新适应症。在补充图2中,线条最粗的部分显示了当前药物再利用研究最为集中的疾病领域配对情况。在各临床试验阶段中,近一半(49%)的化合物属于再利用药物,这表明药物再利用是靶向GPCR药物研发的主要驱动力。Top repurposed drugs
顶级重新利用药物Para_01在临床试验中被重新利用的165种获批药物中,有6种药物正在被研究用于10种或更多适应症(图3b)。其中研究最为广泛的药物是大麻二酚,它被用于29种适应症的研究。该药物已被批准用于治疗与若干神经系统疾病相关的癫痫发作,并主要被研究用于神经发育障碍类疾病,如自闭症谱系障碍(NCT05015439)和脆性X综合征(NCT04977986)。此外,它也在其他神经系统疾病中进行研究,例如偏头痛(NCT05337033)和帕金森病(NCT05106504)。Para_02神经肽催产素已被批准用于产科适应症,目前正被研究用于包括精神分裂症(NCT06136390)、创伤后应激障碍(NCT04228289)和酒精使用障碍(NCT03878316)等多种疾病。普萘洛尔是一种β-肾上腺素受体拮抗剂,最初被批准用于心血管疾病的治疗。然而,在首次获批的60年后,它也被批准用于治疗其他罕见疾病,如婴儿血管瘤和沃尔夫-帕金森-怀特综合征,并正在被研究作为癌症以及如冯·希佩尔-林道病等罕见疾病的潜在疗法。Para_03己酮可可碱被批准用于治疗外周血管疾病,目前正用于研究治疗精神分裂症和抑郁症(NCT05324735),以及糖尿病肾病(NCT03625648)。纳曲酮被批准用于治疗阿片类药物依赖和酒精使用障碍,目前正在测试其在预防和治疗新冠肺炎引起的免疫性血栓(参考文献93)、疲劳症状、进食障碍和糖尿病神经病变(NCT04678895)中的效果。屈大麻酚是一种大麻素CB1/CB2受体激动剂,被批准用于治疗HIV引起的厌食症以及化疗引起的恶心和呕吐。它目前正在多项临床试验中作为辅助治疗药物,用于治疗多种类型的疼痛(NCT06454669、NCT03215940、NCT04992624)、创伤后应激障碍(NCT04448808)以及失眠和抑郁症(NCT05041647)。GPCR retargeting
GPR重新定位High retargeting of GPCRs
GPCR 的高再靶向性Para_01目前有337种以GPCR为靶点的药物正处于临床试验阶段,这些药物针对的是133种不同的GPCRs(图2a)。值得注意的是,重新定位用途的显著趋势也反映在靶点范围上,因为这133种GPCRs中有103种(77%)已经是已批准药物的作用靶点。应当指出的是,针对一个已有明确靶点的受体仍可能涉及新的策略,例如作用方式的改变、变构调节或组织特异性等。Aminergic top targets explored in new indications
在新适应症中探索的胺能作用靶点Para_01目前,已批准药物的十大靶点全部属于胺能受体(图3d),这些靶点正在被探索用于新的适应症。Para_02多巴胺D2受体靶向药物目前已开始应用于传统的精神病适应症之外的领域,例如正在临床研究中用于治疗糖尿病视网膜病变(左舒必利,一种处于II期试验的拮抗剂)、多发性硬化症(多潘立酮)以及无功能性垂体腺瘤(卡麦角林)。Para_03一些H1受体拮抗剂药物正在被重新用于非经典的过敏相关疾病之外的领域。例如,在针对多发性硬化症的II期临床试验中,富马酸克立咪唑显示出再髓鞘化的效果。然而,随后的临床试验(编号NCT03109288)由于治疗引发的细胞焦亡而被停止。同样,另一种H1受体拮抗剂非索非那定正在被研究用于类风湿关节炎的I/II期临床试验中(编号NCT05264025)。Para_04Dexmedetomidine 是一种获批的 α1/α2-激动剂,用于镇静作用,目前正被测试用于治疗精神分裂症和双相情感障碍的激越症状(NCT03708315, NCT05025605)。使用哌唑嗪进行 α1-拮抗治疗 PTSD 的方法在 15 多年前即被提出,而相关的药物多沙唑嗪目前正在开展 II 期临床试验,以评估其对 PTSD 患者改善睡眠的效果(NCT03339258, NCT05360953)。另一种 α1-拮抗剂特拉唑嗪正在被重新用于帕金森病的治疗,因其被认为具有神经保护作用(NCT03905811, NCT05109364)。Para_05目前有多项正在进行的研究正在不同领域中测试以β2-肾上腺素受体为靶点的药物,例如特布他林用于治疗免疫性血小板减少性紫癜(NCT04481282),或普萘洛尔用于肿瘤联合治疗。目前,部分选择性的β1-肾上腺素受体拮抗剂塞利普罗尔正在一项III期临床试验中被重新用于治疗血管型埃勒斯-当洛斯综合征(NCT05432466),这是一种以血管脆弱为特征的罕见疾病。Para_06临床试验正在研究以5-HT2A为靶点的药物在多种疾病中的应用,其中包括天然迷幻产物裸盖菇素用于治疗酒精使用障碍,非典型抗精神病药物用于治疗神经性厌食症,以及用于治疗谵妄或创伤后应激障碍的其他药物(注册号分别为NCT01949662、NCT05431595、NCT04750395)。其中一种引人注目的药物是裸盖菇素的氘代类似物CYB003,在一项II期试验中作为重度抑郁症的辅助疗法显示出良好的疗效,并于2024年获得了美国食品药品监督管理局(FDA)的突破性疗法认定。此外,BMB-101具有选择性的5-HT2C Gq蛋白偏向性激动特性,目前正在进行II期临床试验,用于治疗伴有眼睑肌阵挛的癫痫(注册号:NCT06401538)。Para_072024年9月,KarXT(Cobenfy)获得美国FDA批准,通过激活M1/M4型毒蕈碱型乙酰胆碱受体,为治疗精神分裂症提供了新的作用机制。这一批准强调了毒蕈碱型乙酰胆碱受体在神经系统疾病中的治疗重要性。M3受体拮抗剂奥昔布宁正在对接受抗雄激素治疗的女性进行II期临床试验(NCT04600336)。毒蕈碱受体拮抗剂也正在被研究用于精神疾病的适应症;例如,东莨菪碱正在进行II期临床试验,用于治疗双相情感障碍中的抑郁症状(NCT04211961)。Shift from aminergic to peptide/protein receptors
从胺能受体向肽/蛋白质受体的转变Para_01临床试验中针对的133种G蛋白偶联受体(GPCR)涵盖了A类、B1类、C类和F类(图2;见补充图1)。有趣的是,在拥有最多获批药物的10种GPCR中(图3d),只有两种受体——5-HT2A受体和β2-肾上腺素受体——也出现在当前临床试验中涉及配体数量最多的15个靶点之中(图3e,f)。此外,被重新研究最多的GPCR中仅包含了另外两种胺能受体,即多巴胺D1受体和M4型毒蕈碱型乙酰胆碱受体。相反,我们之前分析中观察到的从胺能受体向肽类和蛋白质受体转变的趋势已经进一步加强。Para_02这种转变可能归因于饱和现象,正如胺能受体只有一个未被开发的靶点–疾病关联(M3 和发育异常,如下文‘未被靶向的 GPCR–疾病配对’部分所述)。对肽/蛋白受体的靶向研究日益集中,也可能是因为具有蛋白质/肽配体的 GPCR 数量多于具有小分子配体的 GPCR 数量(分别为 131 个和 104 个)。过去这一趋势可能受到延迟,原因在于脂质和蛋白质受体与内源性配体的配对较晚(见相关链接),以及改进生物制剂递送方式所需的创新所需时间较长。GLP-1R, GLP-2R, GIPR and GCGR
GLP-1R、GLP-2R、GIPR 和 GCGRPara_01许多激素调节血糖浓度和能量代谢。胰高血糖素是由胰岛α细胞产生的一种由29个氨基酸组成的肽类激素,它通过胰高血糖素受体信号传导增加肝脏中的糖异生。反过来,胰高血糖素的作用及其分泌受到GLP-1和GLP-2肽的调控。这些肽主要在进食过程中由肠道内分泌细胞分泌,从而抑制胰高血糖素释放,增加胰岛素分泌,降低食欲以及其他生理变化。另一种相关的激素GIP同样通过肠道内分泌细胞分泌,并产生与GLPs类似的效果,包括增加胰岛素释放和减少胰高血糖素等。鉴于这些生理特性,针对这些受体的药物成为糖尿病和肥胖症治疗的目标也就不足为奇了。Para_02用于治疗糖尿病的药物,例如司美格鲁肽(semaglutide)和替泽帕肽(tirzepatide),是目前最畅销的GPCR类药物之一(参见上文及补充表1),其中司美格鲁肽在2023年位列所有药物销量排行榜的第三位。基于GLP-1的五大药物(Ozempic、Rybelsus、Wegovy、Mounjaro 和 Zepbound)预计将在2024年实现总计440亿美元的收入,并在2033年达到990亿美元。这些销售表现使胰高血糖素家族受体成为关注焦点,同时也突出了双重激动剂以及激动剂–拮抗剂组合针对GLP-1R/胰高血糖素受体(GCGR)或GLP-1/GIPR产生的多靶点/多模式作用,以及激活GLP-1R/GIPR/GCGR的三重激动剂的作用(参考文献116,117)。表2列出了1种已获批的药物、11种处于临床试验阶段的药物和1种处于临床前研究阶段的药物。替泽帕肽是首个于2022年获批用于治疗2型糖尿病的双GLP-1R/GIPR激动剂。值得注意的是,目前已有11种双GLP-1R/GCGR激动剂正处于I至III期临床试验的不同阶段。其中大多数药物正在测试用于治疗2型糖尿病或肥胖症,尽管也在探索其他代谢性疾病适应症。例如,pemvidutide和efinopegdutide分别正在研究用于治疗非酒精性脂肪性肝炎(NASH;现称为代谢功能障碍相关脂肪性肝炎(MASH))(NCT05989711)和非酒精性脂肪肝病。此外,还有两种三重激动剂正在评估用于治疗肥胖症或NASH。
Table 2 Dual and triple agonist ligands acting on GLP-1R, GCGR and GIPR 表2 作用于GLP-1R、GCGR和GIPR的双重及三重激动剂配体
Para_03有趣的是,这些受体也在其他疾病领域中被研究。例如,目前至少有三项正在进行的II/III期临床试验,正在评估艾塞那肽或其聚乙二醇化类似物(NLY01)作为帕金森病疾病修饰疗法的效果(NCT04154072, NCT04232969, NCT04305002)。Orexin receptors
食欲素受体Para_01主要在下丘脑外侧神经元中表达的食欲素受体OX1和OX2,参与了包括发作性睡病、失眠、抑郁症和成瘾等多种神经系统和精神疾病发病机制。食欲素受体家族位列重新靶向的G蛋白偶联受体(GPCR)前列,目前已有至少11种药物获批或处于临床开发阶段。Para_02获批的药物为双重OX1和OX2拮抗剂,例如苏沃雷生(suvorexant)、莱姆博雷生(lemborexant)和达瑞多雷生(daridorexant),用于治疗失眠症。其他适应症正在临床试验中进行测试。例如,苏沃雷生正在针对不同阶段的谵妄(NCT04092894、NCT05733286、NCT04571944)以及尼古丁依赖的II期试验(NCT04234997、NCT03999099)中进行测试。更具选择性的药物,如INDV-2000(OX1)和AZD4041(OX1),也正在II期临床试验(NCT06384157、NCT06406400)中用于探索阿片类药物使用障碍的治疗。Para_03选择性OX1拮抗剂可能对某些精神疾病(如精神分裂症)有益,CVN766目前正处于早期临床开发阶段。相反,选择性OX2拮抗剂可能对失眠和抑郁症有益。Seltorexant在一项III期试验中作为辅助疗法用于治疗这种合并症,并达到了其主要和次要终点(NCT04533529)。针对OX2,研究人员也开发了选择性激动剂,其中JZP441和danavorexton(TAK-925)已进入针对睡眠相关疾病的临床试验阶段(NCT05651152、NCT04091438、NCT05814016)。The indication landscapeMajor indications and disease areas
主要适应症和疾病领域Para_01为了绘制靶向GPCR的已批准药物的适应症空间,我们根据描述作用器官/系统的解剖学治疗学化学(ATC)代码及其机制对它们进行了分类。对于每个ATC代码(第二级),我们分别用蓝色柱形图和灰色方框可视化了已批准药物和靶点的数量(图5a)。值得注意的是,拥有20个或更多药物/靶点的主要适应症包括抗精神病药(58/35)、眼科用药(44/27)、全身用抗组胺药(43/8)、镇痛药(42/28)、阻塞性气道疾病(38/21)、功能性胃肠疾病(29/13)、心脏治疗药(23/23)、泌尿系统用药(21/20)、β受体阻滞剂(20/10)、中枢神经兴奋药(20/35)、垂体和下丘脑激素及类似物(20/13)以及其他妇科用药(14/21)。适应症的高数量和多样性强调了GPCR作为药物靶点的重要性。
Fig. 5: Trends in indications of GPCR-targeted drugs.
- 图片说明
◉ a,516种已批准的G蛋白偶联受体(GPCR)靶向药物在解剖学治疗化学(ATC)分类中59个药理学组的分布情况。数据来自世界卫生组织(WHO)药物统计方法学合作中心。◉ ATC分类系统使用七位数字代码将已批准的药物分为五个层级。第一级使用一个字母表示解剖或药理学组别,第二级使用两位数字定义治疗亚组。◉ 后续子级别则定义药理学和化学亚组。内部灰度渐变代表每个亚组药物所靶向的不同GPCR数量(颜色越深表示GPCR数量越多)。◉ 外部条形图表示每组中针对GPCR的已批准药物数量。每个条形内填充有渐变色表示药物的新颖性,其中较浅的蓝色代表最近批准的药物。◉ b,已批准药物、重新定位用途的药物以及临床试验中药物的疾病领域。适应症信息来源于Open Targets,并根据ClinicalTrials.gov手动整理,翻译为国际疾病分类(ICD11)标准。◉ 疾病领域按照从左到右试验中化合物/已批准药物的比例由低至高进行排序。Para_02ATC编码(如上所述)描述了一种药物的作用器官/系统及其作用机制,而疾病则由《国际疾病分类》(ICD11)进行描述。图5b展示了将683种独特疾病整合后分为22个领域的情况,这些领域的已批准药物与重新定位药物和试验中新药的相对比例有所不同。拥有最多已批准药物的主要疾病领域包括:未在其他地方归类的症状、体征或临床发现(132种药物)、循环系统疾病(86种药物)、精神、行为或神经发育障碍(81种药物)、神经系统疾病(72种药物)以及呼吸系统疾病(68种药物)(见图5b,灰框部分)。拥有最多已批准药物的具体疾病包括:原发性高血压(40种药物)、精神分裂症(38种药物)、疼痛(32种药物)、哮喘(28种药物)和过敏性鼻炎(27种药物),这突出了循环系统和呼吸系统以及症状和神经发育障碍领域的重要性。Recently increased indications for approved drugs
近期获批药物的适应症有所增加Para_01为了探索已批准药物适应症的趋势,我们在图5a中使用了渐变颜色来展示每种药物首次获批的年份。这表明,在过去20年内获批的药物占据了诸如糖尿病和便秘,以及免疫抑制剂和抗肿瘤药物等适应症整体获批药物数量的很大比例。与上个世纪相比,高血压等领域获批的药物有所减少,这种从这些领域转移的趋势在一定程度上可以用人们对G蛋白偶联受体(GPCR)在癌症中的作用有了更深入的理解来解释,同时也可归因于多发性硬化症新型疗法之间的竞争(见下文)。Diseases with higher proportions of agents in clinical trials relative to approved drugs
在临床试验中涉及比例较高的疾病,其药物相对于已批准的药物而言更多Para_01为了比较已批准药物与临床试验中药物在治疗疾病领域上的差异,我们使用了ICD11对其进行分类。图5b显示了这些疾病领域的排序方式,是按照处于临床试验中的化合物比例而非已上市药物的比例进行升序排列。目前没有针对性健康以及耳部和乳突疾病的GPCR靶向治疗药物处于临床试验中。与已批准药物的比例相比,循环系统疾病(20%)和免疫系统疾病(20%)的临床试验中化合物的比例较低。相反,发育性疾病;肌肉骨骼系统或结缔组织疾病,或血液及造血器官疾病;内分泌、营养或代谢疾病;某些传染病或寄生虫病;损伤、中毒或某些外部因素引起的后果;肿瘤;以及某些围产期时期起源的疾病和COVID-19的临床试验中,有超过50%的药物处于试验阶段,相对于已批准药物的比例而言较高。然而,如果考虑的是临床试验中化合物的绝对数量——而不是相对于已批准药物的比例——那么超过三分之一的临床试验化合物正被研究用于精神、行为或神经发育障碍(71种药物)、神经系统疾病(66种药物)、内分泌、营养或代谢疾病(52种药物)和肿瘤(50种药物)的治疗。Para_02不同疾病领域在临床试验中所研究药物的相对比例的变化受到多种因素的影响,包括商业策略、治疗手段的进步以及疾病的流行程度。在某些情况下,个别药物(尤其是同类首创药物)的近期成功可能为将药物重新用于相似适应症或针对相同机制开发新药提供机会,与针对特征尚不明确的药物靶点相比,这两种方式的风险都较低。例如,GLP-1R激动剂如司美格鲁肽(semaglutide)的成功促使了针对内分泌、营养或代谢疾病的新药物的研发。这一疾病领域共有36种新药物正在至少一个适应症上进行测试,是目前新型治疗化合物中最受关注的方向。其次,新的适应症可能由对更好治疗方法未满足的需求推动,例如在肿瘤学领域和精神病学领域。第三,人口老龄化增加了神经退行性疾病的患病率。这可能解释了为何胺能G蛋白偶联受体(aminergic GPCRs)仍然是热门的靶点,例如部分D1/D5受体激动剂塔瓦帕东(tavapadon)正被测试用于帕金森病(NCT04760769)等多项研究。有趣的是,GLP-1R激动剂如司美格鲁肽和艾塞那肽(exenatide)也正在该领域进行测试(NCT03659682, NCT04232969, NCT04154072)。Diabetes drugs
糖尿病药物Para_01抗糖尿病药物大致有七种类型,其中一种是GPCR激动剂。2005年,GLP-1类似物艾塞那肽(exenatide)和淀粉样多肽类似物普兰林肽(pramlintide)获批上市,标志着这类药物进入市场。自那时起,又有六种新的多肽类GPCR激动剂类糖尿病药物获得批准,这些药物的作用靶点来自胰高血糖素受体家族(GIPR和GLP-1R)或降钙素受体——所有这些受体均参与调节血糖水平。其中包括最畅销的两种药物:司美格鲁肽(semaglutide)和替尔泊肽(tirzepatide),它们在2023年用于治疗2型糖尿病的销售额分别约为140亿美元和50亿美元(详见补充表格1及相关链接)。目前,这两种药物在肥胖症治疗领域也实现了可观的销售业绩。因此,尽管针对糖尿病且作用于GPCR的药物数量较少(共八种),但它们在市场上具有重大影响力。Immunomodulators
免疫调节剂Para_01迄今为止,已有五种靶向GPCR的药物被批准作为免疫调节剂使用。其中第一个药物芬戈莫德于2010年获批,而其余四种则在2019年至2021年间获批。芬戈莫德以及奥扎莫德、西波莫德和波那莫德均以鞘氨醇-1-磷酸(S1P)受体为靶点,用于治疗复发性多发性硬化症,这基于这些受体在淋巴细胞迁移中的作用。尽管芬戈莫德取得了很大成功,但其在S1P受体亚型选择性方面的不足以及较长的消除时间意味着新一代S1P调节剂仍有改进空间。新一代S1P调节剂具有更高的S1P1和S1P5受体选择性、更好的安全性特征和/或更短的半衰期。另一种免疫调节剂GPCR药物阿瓦考普兰于2021年获批,成为首个靶向补体5a受体的药物。该受体拮抗剂用于治疗抗中性粒细胞胞浆自身抗体(ANCA)相关性血管炎——一种罕见的自身免疫性疾病。Antineoplastic agents
抗肿瘤药Para_01关于GPRCs在癌症中作用的首次描述可以追溯到1986年,当时发现了MAS癌基因。尽管肿瘤学领域的聚光灯主要集中在激酶作为靶点上,但随着2012年至2018年间针对SMO受体的抗肿瘤药物获批用于急性髓系白血病和基底细胞癌的治疗,靶向GPCRs的研究开始加速。SMO属于F类(卷曲)受体,是Hedgehog信号通路的一部分,据估计该通路的异常激活导致了超过25%的癌症相关死亡。目前还有两种针对SMO受体的抗肿瘤药物正在进行II期和III期临床试验。Para_02另一种近期被抗癌药物作用的靶点是CCR4,它是一种趋化因子受体,通过影响炎症和免疫反应而对癌症发挥作用此外,趋化因子受体在临床试验中受到广泛关注(见上文),并且已有积极的结果从将趋化因子受体抑制剂与化疗或抗体联合使用的临床试验中显现出来,以克服化疗耐药性例如,莫加穆单抗是一种单克隆抗体,可抑制CCR4受体,用于治疗蕈样肉芽肿或塞扎里综合征Para_03另一种获批作为抗肿瘤药物的有趣药物是talquetamab,这是一种双特异性GPRC5D–CD3 T细胞衔接器,于2023年获批用于治疗多发性骨髓瘤,属于该类别中的首个药物。这种药物的疗效可能部分归因于多发性骨髓瘤细胞上相比其他组织具有非常高的GPRC5D表达水平,这使得被重定向的T细胞能够在一定程度上特异性地杀伤多发性骨髓瘤肿瘤细胞。目前还有更多的临床试验正在探索该药物在B细胞成熟抗原(BCMA)CAR T细胞疗法之后用于相同适应症的治疗(NCT06066346)。Para_04其他涉及癌症的 GPCR 例子包括结肠癌中的 FPR2 和 LPA1/3,胰腺癌中的胆囊收缩素受体,以及黑色素瘤中的 GPR55 和 GPR56。开发针对这些受体的新化合物——此前在临床试验中尚未成为靶点——可能有助于改善目前治疗手段不足的癌症的治疗效果。最近,人们对 GPCR 信号传导与癌症之间关系的理解日益加深,表明还有许多其他的潜在靶点。First-in-class agents
首创新药Para_01值得注意的是,一些最新获批的药物是同类首创药物。例如,于2023年获批的fezolinetant是一种用于治疗更年期相关潮热的NK3受体拮抗剂。通过阻断NK3受体,该药物可减少正中视前核中涉及体温调节的神经元激活,从而减轻潮热症状。Para_02Mavorixafor 于2024年4月获批,成为首个针对WHIM综合征患者的特异性治疗药物。WHIM综合征是一种罕见的免疫缺陷疾病,其特征是中性粒细胞和淋巴细胞浓度偏低。通过阻断CXCR4,这种化合物能够提高绝对中性粒细胞和淋巴细胞计数,增强患者对抗反复和严重感染的能力。Para_032024年9月,KarXT(Cobenfy)获得美国食品药品监督管理局(FDA)批准,用于治疗精神分裂症,这是自20世纪50年代以来该疾病治疗领域的首个新作用机制(参考文献22、23)。如前所述,KarXT是xanomeline(一种M1/M4毒蕈碱型乙酰胆碱受体选择性激动剂)与trospium(一种外周毒蕈碱受体拮抗剂)的组合,能够在刺激毒蕈碱受体的同时限制胃肠道副作用(参考文献23)。通过中脑中的M4受体、纹状体中的M1/M4受体以及皮层区域的M1受体对胆碱能信号传导的调节,可以解释使用xanomeline治疗后精神分裂症患者的认知功能改善和精神症状减轻(参考文献22、169)。Para_04其他同类首个药物包括sparsentan,它是一种ETA和AT1拮抗剂,用于减少IgA肾病中的蛋白尿,这是首个非免疫抑制疗法;以及difelikefalin,它是一种阿片受体激动剂,用于治疗血液透析患者中的瘙痒症,是首个也是唯一一个用于该适应症的疗法。Para_05在肿瘤学领域,由靶向部分与放射性同位素连接组成的放射性配体疗法近年来因其临床成功而引起了广泛关注。例如,Lutetium Lu-177 dotatate 是首个获批用于治疗胃肠胰腺神经内分泌肿瘤(GEP-NETs)的放射性配体疗法药物,其靶向作用于生长抑素受体,而dotatate gallium Ga-68也是一种用于PET成像的放射性诊断剂,同样靶向该受体。Untapped targets and biased signallingLiterature, ligand and structural data aiding drug discovery
有助于药物发现的文献、配体和结构数据Para_01支持针对新型GPCR靶点进行药物发现的信息类型包括文献数据、配体数据和结构数据。为了评估这些数据的可获得性并识别可能成为新靶点的GPCR,我们将这些数据与不同GPCR靶点在药物开发中的状态进行了关联分析,其中包括已被批准药物靶向的GPCR、已有候选药物进入临床试验但尚未获批的GPCR,以及尚未有进入临床试验阶段的药物作用于其上的GPCR(图6a)。
Fig. 6: Untapped targets and their disease associations and available data.
- 图片说明
◉ a,在未靶向、临床试验中和已有药物的G蛋白偶联受体(GPCRs)中,文献、配体和结构数据的可用性。各图示从左至右分别显示了出版物数量(PubMed)、配体数量(GPCRdb41)和结构数量(GPCRdb225),这些GPCRs被归类为未靶向(尚未在临床试验中被靶向)、临床试验中和已有批准药物。每个箱形图上方显示的是中位数数值。◉ 点的大小表示GPCR的数量,并按照结构论文发表的第一年进行分布(x轴)。◉ b,每种受体-临床领域组合所关联的未靶向疾病数量。当某一特定疾病-受体组合没有批准的药物或处于试验阶段的治疗剂时,则认为该疾病是未靶向的。◉ 方块根据每种受体-治疗领域组合所关联的疾病数量按比例填充(每个方块中的数值)。未靶向和已靶向列包含每个临床领域中的独特疾病计数。◉ 受体根据其状态进行着色:未靶向(灰色),以及有或没有临床试验药物的受体(紫色和蓝色)。◉ 疾病关联信息来自Open Targets平台(方框1)。ICD11,国际疾病分类第11版。Para_02这显示出一些未被靶向的受体,其公开数据甚至超过了一些已有药物作用的靶点。例如,趋化因子受体CCR7拥有超过300篇出版物,可以在癌症治疗中成为靶点,类似于其他趋化因子受体。此外,尽管已知存在超过1,000种配体,其中许多是其生理配体的类似物,黑色素浓缩激素(MCH)1受体和神经肽S受体仍然未被靶向。这些受体与肥胖和帕金森病相关。Para_03由于冷冻电镜技术的进步,具有结构数据的G蛋白偶联受体(GPCR)数量迅速增加(参见相关链接)。新结构的确定,尤其是那些尚未成为药物靶点的受体结构,可能会促进针对这些受体的新化合物的设计。例如,胆囊收缩素受体CCK1和游离脂肪酸受体FFA4各自已有十个发表的结构,这些结构可以指导开发具有抗糖尿病活性的激动剂。Target database platforms
目标数据库平台Para_01合作性质的大型研究计划和开放获取数据库平台在完成绘制众多疾病关联和靶点这一艰巨任务中发挥着关键作用。其中规模最大的包括由美国国立卫生研究院(NIH)资助的“Illuminating the Druggable Genome”计划,以及由欧洲分子生物学实验室协调的公私合作项目Open Targets。此外,本综述中的数据已收录在一个基于网络的GPCR药物发现资源库中,该资源库包含专门的目标靶点筛选工具,以及对药物分子、适应症及相关靶点的整合、整理和独特数据。这有助于指导功能生物学研究,并推动针对许多尚未开发的GPCR疾病关联进行验证并实现临床概念验证(见图6b)。对于偏向性信号传导领域,偏向性信号图谱(Biased Signalling Atlas)这一最新的专用配体及疾病相关靶点通路数据库,将进一步加强科研社区的协同努力。Untargeted GPCR–disease pairs
未靶向的 GPCR-疾病对Para_01尽管G蛋白偶联受体(GPCR)超家族是最重要的药物靶点家族之一,且其大多数成员都有大量的公开数据,但其非感官受体中仅有三分之一在临床上被作为靶点加以利用,许多受体仍未被开发,包括整个黏附类受体家族、11个F类受体中的10个,以及代谢型谷氨酸受体家族的大多数成员。Disease associations
疾病关联Para_01为了绘制非靶向GPCRome图谱,我们整理了来自Open Targets的疾病关联评分数据,这些数据基于遗传关联、体细胞突变、已知药物、受影响通路以及文献等多方面的信息。与上述方法相同,疾病术语从实验因子本体(EFO)、人类表型本体(HPO)和Mondo疾病本体(Mondo)被转换为ICD11分类。这揭示了50种非感官类GPCR与84种疾病之间的关联(按照图6b中的靶点-疾病领域配对计数)。其中疾病数量最多的是发育异常类疾病(26种),其次是内分泌、营养或代谢类疾病(18种)。值得注意的是,公共数据必然低估了疾病相关的靶点数量,因为大量数据掌握在制药行业的手中。Para_02在这些未被靶向的关联疾病中,有六种GPCR(GPR20/50/137、GABAB1、ɑ2A、TP)与神经认知障碍相关,此外还有几种疾病与两种GPCR相关:2型糖尿病(MC4、MT2)、先天性静止性夜盲症(mGlu6、GPR179)和卡尔曼综合征(Kisspeptin、PKR2)。其中许多受体不仅在这些疾病中未被靶向,在整体上也仍未被靶向。Para_03尽管已经有92种G蛋白偶联受体(GPCR)被用于几乎所有相关的适应症(上图所示),但其数量众多且易于重新定位(通过重新利用或新药剂),因此它们往往仍是其他疾病的未开发靶点。事实上,在50种具有未开发疾病关联性的GPCR中,已有27种是已批准药物的作用靶点,其中14种目前也在临床试验中被作为靶点进行研究。在所有未被靶向的疾病关联性方面,钙敏感受体(CaS受体)与最多数量的未靶向疾病相关联,这些疾病包括三种内分泌系统疾病、两种神经系统疾病和一种皮肤疾病。此外,促甲状腺激素(TSH)受体则与五种未靶向疾病相关,涉及内分泌、营养或代谢领域。尽管这些受体已经被已批准的药物所靶向,但目前并未在临床试验中作为靶点使用,表明这些尚未靶向的疾病仍具有未被开发的潜力。另外,还有一些未被靶向的GPCR,例如FZD6和ADGRV1,它们各自与三种未靶向疾病相关。Para_04一些挑战阻碍了某些GPCR-疾病对的靶向治疗。在未被靶向的GPCR-疾病对中(图6b),只有四种疾病与多个GPCR相关,但有20种受体却与多种疾病有关。因此,最大的未开发潜力以及可能面临的挑战主要与靶点有关,而不是疾病本身。首先,许多受体的生物学特性描述不清,其生理配体未知和/或缺乏工具化合物。其次,具有相似结合位点或多种信号通路的受体给特异性药物的开发带来了挑战,尽管变构调节和偏向性信号传导分别在一定程度上缓解了这些问题(分别见上述和下文讨论)。尽管如此,某些疾病领域对于GPCR靶点来说商业价值较低或难以治疗,例如牙齿萌出障碍、卷曲发症或指甲疾病。Untargeted adhesion receptors
非靶向性黏附受体Para_01黏附类/ B2受体在G蛋白偶联受体(GPCR)药物开发中是一个挑战。尽管有六种B2类GPCR与癌症、发育障碍以及皮肤、神经系统、呼吸系统、泌尿生殖系统和视觉系统的疾病相关,但所有B2类GPCR仍未成为药物靶点。最近,对黏附类GPCR的结构-功能关系的理解已大大扩展(例如,参考文献184、185),并已发现几种分子可与这些受体结合186、187。然而,这些受体的药物开发可能受到阻碍,因为它们在功能和结构上与其他大多数GPCR差异很大。例如,它们在发育生物学中发挥作用,具有复杂的信号传导机制,以及带有调控细胞间相互作用结构域的长氨基末端。此外,它们的结构直到最近才被解析出来。Untargeted Frizzled receptors
非靶向的Frizzled受体Para_01在FZD1至FZD10这十个受体中,有四个与疾病相关,要么是发育异常,要么是皮肤疾病,但这些受体目前仍未被作为药物靶点。FZD受体可与WNT蛋白结合,激活WNT信号通路,该通路在胚胎发育、细胞特化、增殖和迁移以及骨骼形成中发挥作用,因此也与多种疾病有关,包括某些癌症、2型糖尿病和神经性疾病。尽管所有这些受体目前仍未被直接靶向,主要由于其激活和信号传导机制较为复杂,但最近已有几项研究描述了作用于这些受体的分子,表明它们最终可能成为药物靶点。以靶向Frizzled受体的药物为例,SMO受体(见上文)就提供了这种潜在影响的例证,它同样属于F类受体。Untargeted metabotropic glutamate receptors
非靶向代谢型谷氨酸受体Para_01这类受体家族由八种受体组成,它们会对主要的神经递质谷氨酸产生反应,这些受体可能是治疗神经精神疾病(如帕金森病、抑郁症或精神分裂症)的潜在靶点。该家族中只有一种受体被已获批的药物所靶向(mGlu5,它被认为是acamprosate的作用靶点之一),另有两种受体有处于临床试验阶段的药物(mGlu2, mGlu3)。此外,还可以开发用于靶向其他代谢型谷氨酸受体的化合物。mGlu1与神经系统中的两种疾病相关,涉及小脑共济失调。尽管一些研究尝试通过抗体和重新利用其他化合物来靶向此受体,但该受体仍未实现有效靶向。此外,分别与视觉系统疾病和神经发育障碍相关的mGlu6和mGlu7也尚未被靶向。针对此类受体家族的变构调节剂的开发可能有助于克服家族内部靶点选择性有限的问题,这一问题可能阻碍了之前候选药物的研发进展。Biased signalling
有偏信号传导Para_01能够差异性激活G蛋白偶联受体(GPCR)信号传导的细胞内转导分子(如G蛋白和β-抑制蛋白)的配体被称为“偏向性配体”。此类配体的偏向性信号传导在药物设计中具有显著且尚未充分开发的潜力,因为它们可以仅(或优先)激活治疗有益的信号通路,同时避免引发不良反应的通路,从而带来更好的疗效和安全性。因此,这种机制可能解锁那些由于非目标通路效应而此前难以处理的靶点。偏向性信号传导还可能将单一受体靶点扩展到涵盖其所有下游信号通路,而这些通路可能与不同的治疗作用相关。例如,BnOCPA通过腺苷A1受体,在所有其他G蛋白中优先激活Gob蛋白,并且与其他A1受体激动剂不同,它在不引起心肺抑制的情况下产生镇痛作用。Para_02文献中有关偏倚配体和治疗相关通路的信息已被收录在《Biased Signalling Atlas》数据库中。其中,具有最多偏倚配体的受体包括β2受体、δ-阿片受体、μ-阿片受体、A3受体、AT1受体、CB2受体、CCR1、D2受体和GPR84。至少已有30个GPCR靶点被认为具有利用偏倚信号传导的潜力。Biased drugs
有偏性的药物Para_01已有多种药物被发现表现出偏向性信号传导。GLP-1R激动剂如替泽帕肽(tirzepatide)和CT388偏向于激活G蛋白而非β-抑制蛋白。阿托西班通过催产素受体作为Gq拮抗剂,已被批准用于阻止早产,并且最近发现其为Gi信号通路的偏向性激动剂,可抑制细胞生长并激活炎症通路。最近还发现普乐沙福(plerixafor)对CXCR4受体产生β-抑制蛋白偏向性激动作用,在干细胞动员中具有有益效果。许多其他药物也发现了偏向性信号传导现象,包括卡维地洛、普萘洛尔、奈必洛尔、阿普洛尔、左吗喃、羟考酮、对乙酰氨基酚/氢可酮、氢吗啡酮、卡帕adenoson和非诺特罗,尽管目前尚不清楚这种现象在多大程度上贡献了它们的治疗特性。更多偏向性配体正在研发之中,例如,一项II期临床试验正在研究针对伴有眼睑肌阵挛癫痫的5-HT2C Gq蛋白偏向性激动剂BMB-101(NCT06401538)。Para_02首个获批的、被设计为偏向性激动剂的药物是oliceridine,这是一种μ-阿片受体配体,据称更倾向于激活G蛋白而非β-抑制蛋白(β-arrestins)。然而,其改善的安全性特征后来被发现主要归因于对所有信号通路的内在功效较低。最近,虚拟筛选在识别具有偏向性的药物先导物方面提供了概念验证。一项研究识别出针对5-HT2A受体的通路偏向性配体(优先激活Gq蛋白而非β-抑制蛋白),而该受体已知的药物,包括LSD,则优先激活β-抑制蛋白而非G蛋白。这些配体显示出强效的抗抑郁效果,同时避免了致幻作用,并实现了大脑通透性。第二项研究识别出针对α2A受体的通路偏向性配体(优先激活Gi/o/z蛋白,而非其他G蛋白和β-抑制蛋白),而该受体已知的药物右旋美托咪定(dexmedetomidine)和溴莫尼定(brimonidine)则会激活多个其他G蛋白和β-抑制蛋白。这些配体是非阿片类止痛药,不具有传统α2A受体靶向药物的镇静副作用。Challenges
挑战Para_01一些障碍阻碍了偏向性信号转导在临床上更广泛的应用,尤其是体外实验结果难以转化为改进的临床特征。大多数体外药理学实验与治疗相关的系统存在差异,因为它们使用非原生细胞(例如CHO细胞),并且使用重组和/或过表达的受体或转导蛋白。此外,测量通路水平和时间点的选择可能改变配体的偏向性。当推进到模式生物时,由于配体结合和受体信号传导方面存在的物种差异,可能导致转化失败。Para_02通过使用天然组织和受体表达,并测量基于'功效'而非基于'亲和力'的偏向性,以及单个通路中的内在功效、不同细胞类型间的偏向性变化、时间依赖性和配体解离速率,可以改进偏向性翻译。此外,最近的行业指南为实验设计、解释和描述提供了建议。一个关键点是,偏向性不仅仅是配体本身的属性,也是系统(如细胞、组织和生物传感器)的属性。另一个主要观点是,偏向性总是相对于参考配体而言的,而参考配体本身在定义上是没有偏向性的。若要对通路选择性、与生理信号传导的差异或潜在临床优势做出判断,则应分别选用通路平衡的、生理性的或临床上适用的配体作为参考配体。通路平衡的参考配体也取决于系统,可以通过绘制配体在两个比较通路间活性的相关性图谱来定义。最后,偏向信号图谱(Biased Signalling Atlas)提供了一系列参考配体和交流平台,以推动偏向工具化合物和可药用通路的深入表征,促进偏向信号在临床领域的广泛应用。Signalling mechanisms beyond bias
超越偏差的信号机制Para_01最近的研究进展揭示了G蛋白偶联受体(GPCR)信号传导的复杂性,这些复杂性突显了在药物发现中进行更深入表征的必要性,例如不同类别受体的多样化激活机制214、出乎意料的RAMP–GPCR相互作用215、此前未被观察到的相互作用网络组分216、区室化的受体信号传导217、亚型特异性信号传导218、质膜中的空间组织219以及遗传变异性220。在这种背景下,设计能够将在体外和结构研究中获得的见解转化为体内模型的实验极具挑战性。然而,诸如OneGo221等新型生物传感器的出现为这一问题提供了潜在的解决方案,该传感器能够在原代组织中检测依赖于上下文的GPCR活性。Conclusion and future perspectivesPara_01这一分析强调了GPCR是药物开发领域最受关注的蛋白家族之一。鉴于目前有众多相关药物处于临床试验阶段(图2)、适应症领域的不断扩展(图5)、尚未被开发的疾病关联性(图6b)以及最近披露的公司合作(方框2),GPCR预计将在未来继续发挥重要作用。与已批准的药物相比,生物制剂在临床试验中的比例几乎翻了一番(从13%增长到29%),变构调节剂更是增加了八倍(从1%增长到8%)(图4b,c),这些因素将对下一代靶向GPCR药物的发展产生重大贡献。然而,许多未来的GPCR靶向疗法可能将是已经获批的药物用于新的适应症,因为重新定位用途的药物占到了所有临床试验阶段化合物的近一半(48%)。以无假设方式对已知药物进行筛选以寻找新适应症的方法已被证明效果甚微,因此人们可能更倾向于采用更有理论依据的方法作为来源,例如基于此前观察到的副作用进行再优化,或利用对GPCR其他疾病相关功能的新认识来寻找新的治疗用途。
[div_box]
细胞疗法
100 项与 The European Molecular Biology Laboratory 相关的药物交易
登录后查看更多信息
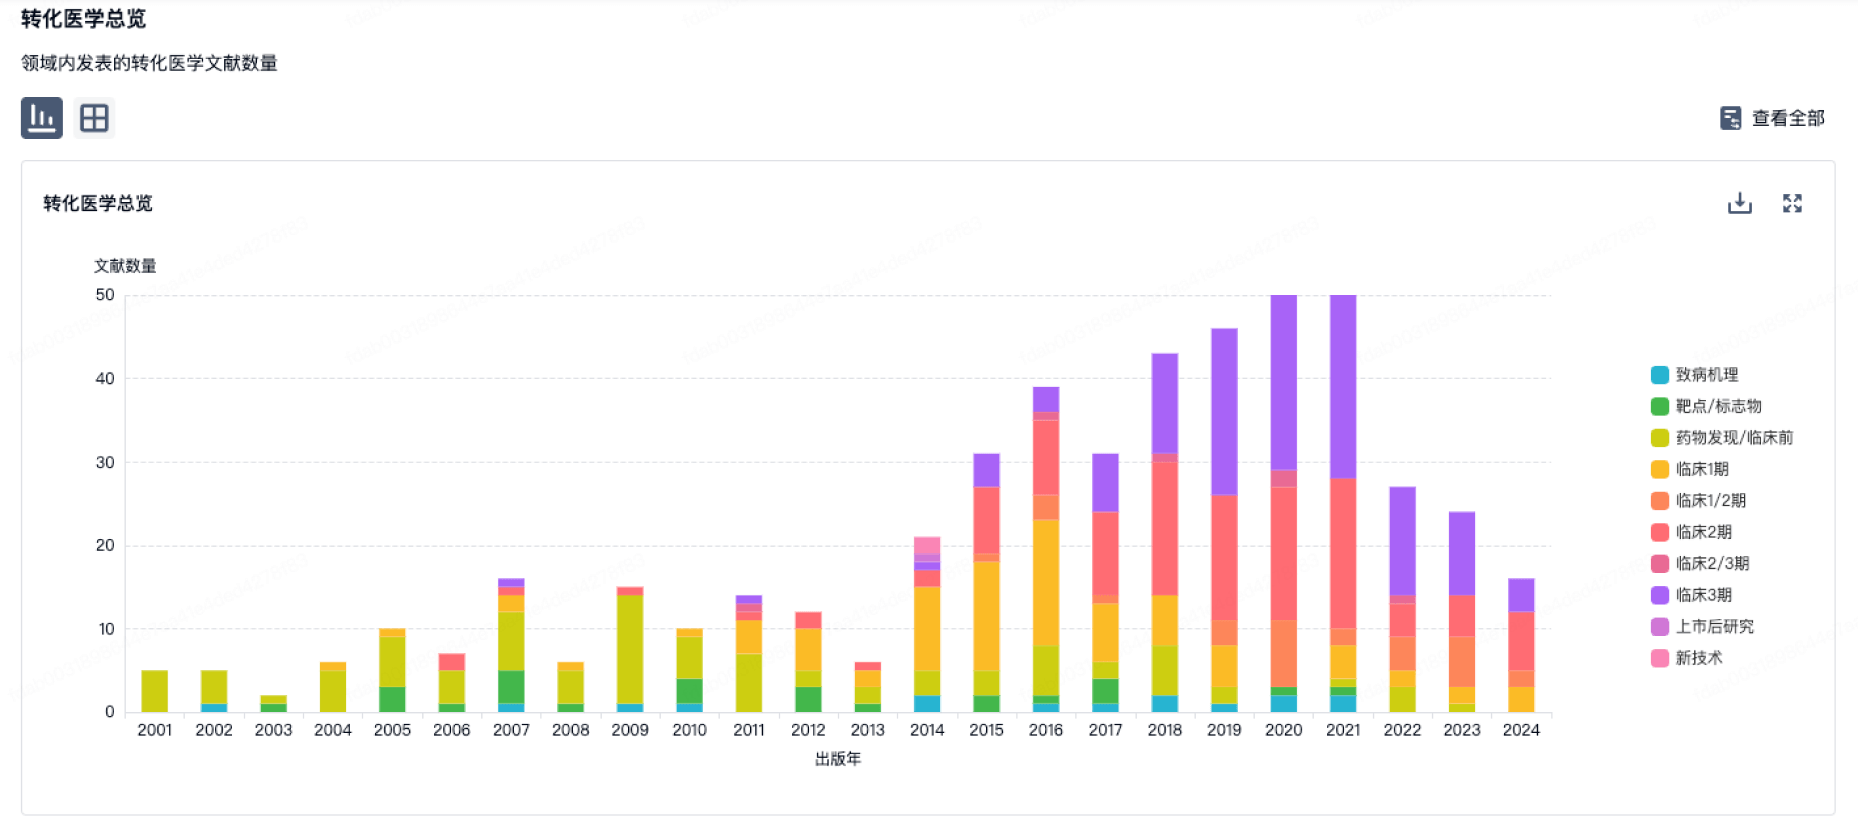
100 项与 The European Molecular Biology Laboratory 相关的转化医学
登录后查看更多信息
组织架构
使用我们的机构树数据加速您的研究。
登录
或
管线布局
2026年07月22日管线快照
管线布局中药物为当前组织机构及其子机构作为药物机构进行统计,早期临床1期并入临床1期,临床1/2期并入临床2期,临床2/3期并入临床3期
药物发现
2
1
其他
登录后查看更多信息
当前项目
| 药物(靶点) | 适应症 | 全球最高研发状态 |
|---|---|---|
WO2024133360 ( autotaxin )专利挖掘 | 神经系统疾病 更多 | 药物发现 |
WO2024102811 ( RBM20 )专利挖掘 | 心脏病 更多 | 药物发现 |
Sb23 ( SARS-CoV-2 S protein ) | 新型冠状病毒感染 更多 | 无进展 |
登录后查看更多信息
药物交易
使用我们的药物交易数据加速您的研究。
登录
或
转化医学
使用我们的转化医学数据加速您的研究。
登录
或
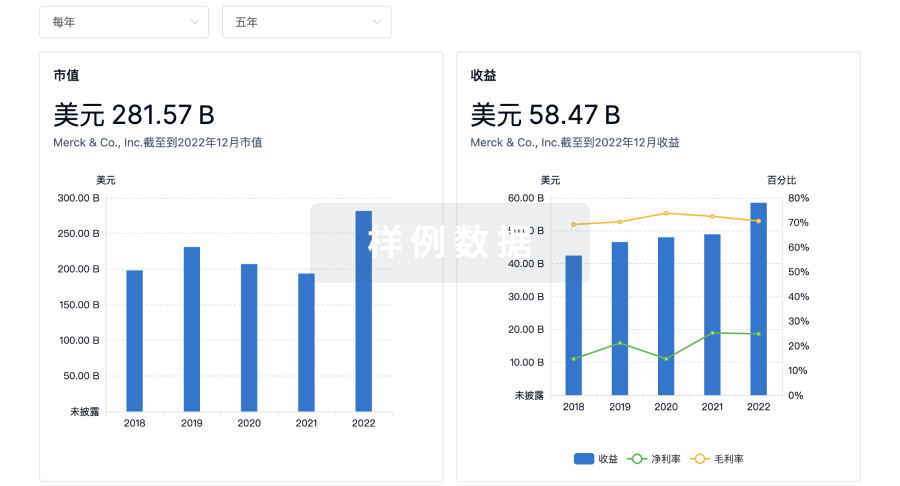
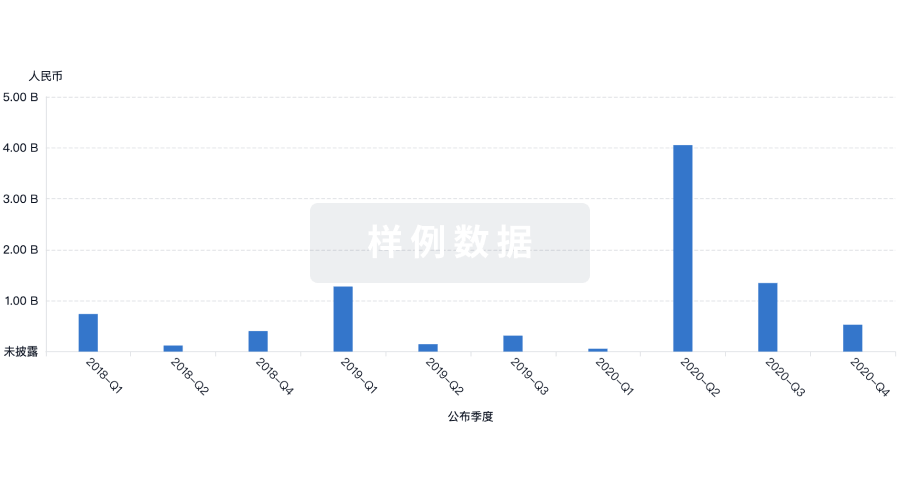
营收
使用 Synapse 探索超过 36 万个组织的财务状况。
登录
或
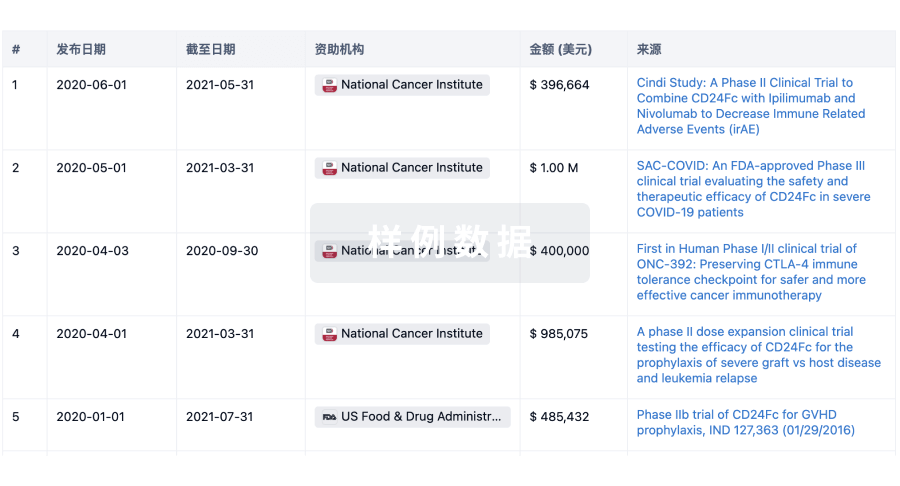
科研基金(NIH)
访问超过 200 万项资助和基金信息,以提升您的研究之旅。
登录
或
投资
深入了解从初创企业到成熟企业的最新公司投资动态。
登录
或
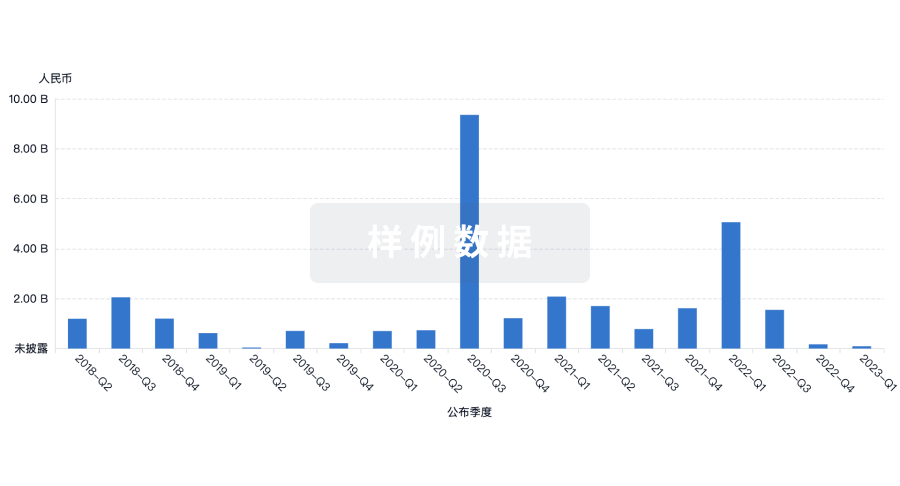
融资
发掘融资趋势以验证和推进您的投资机会。
登录
或
芽仔
全新生物医药AI Agent 覆盖科研全链路,让突破性发现快人一步
立即开始免费试用!
智慧芽新药情报库是智慧芽专为生命科学人士构建的基于AI的创新药情报平台,助您全方位提升您的研发与决策效率。
立即开始数据试用!
智慧芽新药库数据也通过智慧芽数据服务平台,以API或者数据包形式对外开放,助您更加充分利用智慧芽新药情报信息。
生物序列数据库
生物药研发创新
免费使用
化学结构数据库
小分子化药研发创新
免费使用