预约演示
更新于:2025-05-07

Cerveau Technologies, Inc.
更新于:2025-05-07
概览
标签
神经系统疾病
其他疾病
诊断用放射药物
小分子化药
疾病领域得分
一眼洞穿机构专注的疾病领域
暂无数据
技术平台
公司药物应用最多的技术
暂无数据
靶点
公司最常开发的靶点
暂无数据
| 疾病领域 | 数量 |
|---|---|
| 神经系统疾病 | 1 |
| 排名前五的药物类型 | 数量 |
|---|---|
| 诊断用放射药物 | 1 |
| 小分子化药 | 1 |
| 排名前五的靶点 | 数量 |
|---|---|
| APP(β-淀粉状蛋白A4) | 1 |
关联
1
项与 Cerveau Technologies, Inc. 相关的药物靶点 |
作用机制 APP调节剂 |
在研机构 |
原研机构 |
非在研适应症 |
最高研发阶段临床3期 |
首次获批国家/地区- |
首次获批日期- |
5
项与 Cerveau Technologies, Inc. 相关的临床试验JPRN-jRCT2080224887
A phase 1 evaluation of [18F]MK-6240 as a potential PET radioligand for imaging tau protein in the brain of cognitively normal elderly Japanese participants, Japanese patients with mild cognitive impairment and probable mild to moderate Alzheimer's disease
开始日期2019-10-07 |
申办/合作机构 |
JPRN-JapicCTI-194985
A phase 1 evaluation of [18F]MK-6240 as a potential PET radioligand for imaging tau protein in the brain of cognitively normal elderly Japanese participants, Japanese patients with mild cognitive impairment and probable mild to moderate Alzheimer's disease
开始日期2019-10-07 |
申办/合作机构 |
JPRN-jRCT1080224900
A phase 1 evaluation of [18F]MK-6240 as a potential PET radioligand for imaging tau protein in the brain of cognitively normal elderly Japanese participants, Japanese patients with mild cognitive impairment and probable mild to moderate Alzheimer's disease
开始日期2019-10-07 |
申办/合作机构 |
100 项与 Cerveau Technologies, Inc. 相关的临床结果
登录后查看更多信息
0 项与 Cerveau Technologies, Inc. 相关的专利(医药)
登录后查看更多信息
4
项与 Cerveau Technologies, Inc. 相关的文献(医药)2023-12-01·Alzheimer's & Dementia
Towards a standardized pipeline for tau PET analysis under a GAAIN/LONI and CPAD collaborative framework
作者: Toga, Arthur W. ; Weber, Christopher J. ; Pappas, Ioannis ; Leuzy, Antoine ; Romero, Klaus ; Karten, Yashmin ; Sivakumaran, Sudhir
2023-12-01·Alzheimer's & Dementia
A CenTauR scale based on 18F‐MK6240
作者: Fripp, Jurgen ; Feizpour, Azadeh ; Huang, Kun ; Bourgeat, Pierrick ; Leuzy, Antoine ; Villemagne, Victor L ; Dore, Vincent ; Rowe, Christopher C ; Krishnadas, Natasha
2023-12-01·Alzheimer's & Dementia
Harmonization of tau‐PET in Alzheimer’s disease: comparison of methods to derive CenTauR units for [18F]RO948, [18F]Flortaucipir, and [18F]MK‐6240
作者: Collins, Jessica A. ; Haeberlein, Samantha Budd ; Charil, Arnaud ; Sivakumaran, Sudhir ; Rosa‐Neto, Pedro ; Higuchi, Makoto ; Collins, Emily C. ; Mathotaarachchi, Sulantha ; Pontecorvo, Michael J. ; Carrillo, Maria C. ; Lopresti, Brian J. ; Bohorquez, Sandra Sanabria ; Leuzy, Antoine ; Pascoal, Tharick A. ; Karten, Yashmin ; Pappas, Ioannis ; Saad, Ziad S. ; Baker, Suzanne L. ; Rowe, Christopher C ; Jagust, William J. ; Klein, Gregory ; Raket, Lars Lau ; Stephens, Andrew W. ; Kolb, Hartmuth C. ; Mintun, Mark A. ; Hansson, Oskar ; Smith, Ruben ; Hutchison, R. Matthew ; Villemagne, Victor L ; Dore, Vincent ; Tonietto, Matteo ; Iaccarino, Leonardo ; Johnson, Keith A. ; Hostetler, Eric D. ; Rabinovici, Gil D. ; Irizarry, Michael C. ; Ossenkoppele, Rik
12
项与 Cerveau Technologies, Inc. 相关的新闻(医药)2025-01-13
Radiopharmaceutical maker Lantheus Holdings plans to acquire Life Molecular Imaging for $350 million in a bid to build up its commercial Alzheimer’s diagnostics business.
In addition to the $350 million upfront payment, the deal includes up to $400 million in potential earnout and milestone payments.
Six months ago, Lantheus made a deal with Life Molecular Imaging to license a diagnostic and therapeutics pair of radiopharmaceuticals, both of which target a protein called gastrin-releasing peptide receptor that’s highly expressed in breast and prostate cancer.
Lantheus’ top-selling drug is a radioactive agent used to diagnose prostate cancer called Pylarify.
Lantheus is gaining five assets from the buyout, namely a commercial Alzheimer’s diagnostic agent called Neuraceq. It’s an area that Lantheus has been investing in, though previous acquisitions were for experimental agents. In July, Lantheus
bought
Meilleur Technologies and its experimental beta amyloid PET imaging agent called NAV-4694. In 2023, Lantheus bought Cerveau Technologies for its experimental tau-targeted PET imaging agent known as MK-6240.
“This puts us squarely in the Alzheimer’s space a whole lot earlier — at least a year earlier — than we were planning with the launch of [MK-6240], and we’ve got a ready-[to]-go franchise,” CEO Brian Markison said.
并购诊断试剂
2024-07-23
·先通医药
近日,先通医药海外参股公司Meilleur及其用于治疗阿尔茨海默病的新一代Aβ-PET显像剂NAV-4694被纳斯达克上市公司Lantheus收购。
美国国家老龄化研究所和阿尔茨海默病协会(NIA-AA)工作组最新发布的修订版指南指出,阿尔茨海默病应使用基于蛋白质的生物标志物进行生物学定义,包括Aβ和Tau在内的生物标志物可用于诊断阿尔茨海默病并提供其严重程度的指标。1
NAV-4694目前正处于临床Ⅲ期开发阶段,已被广泛用于学术和行业的研究性治疗试验。NAV-4694与Lantheus的下一代18F 标记Tau-PET显像剂MK-6240(florquinitau)形成互补,扩大了Lantheus的阿尔茨海默病诊断产品组合。
MK-6240是一款18F标记的高亲和力Tau蛋白PET显像剂。该药物对Tau蛋白的探测显像对比度高,可无创、精准、定位、定量地呈现阿尔兹海默病患者脑部Tau蛋白沉积的病理变化。此前,Lantheus通过收购Cerveau公司获得了MK-6240的全球权益,而先通医药是Cerveau的股东之一。根据现有的再许可协议,先通医药保留了MK-6240在中国的权益。
Aβ-PET阳性显像能够提示存在AD病理改变,结合Tau-PET检测结果,对AD早期诊断、鉴别诊断、抗Aβ治疗后疗效评价、AD药物临床试验患者筛选具有显著价值。
根据协议条款,Lantheus 将支付预付款及潜在的额外开发和商业里程碑付款。此外,Lantheus 还将为研究收入和商业销售支付特许权使用费。该协议以股票购买的形式签订,规定Meilleur将在交易完成后的规定时间内提供过渡和临床开发服务。
先通医药CEO唐艳旻表示:“这是一次激动人心的收购,我们非常看好Aβ-PET和Tau-PE在阿尔茨海默病早期诊断,临床分期及治疗前后疗效评估等方面的应用潜力,它们的联合使用将为阿尔茨海默病的诊疗决策提供有力的证据。”
在中国,先通医药则通过Aβ-PET显像剂欧韦宁®氟[18F]贝他苯注射液与Tau-PET显像剂MK-6240的组合,助力阿尔茨海默病患者实现早诊早治。
参考文献
1.Jack CR, et.al. Revised criteria for diagnosis and staging of Alzheimer's disease: Alzheimer's Association Workgroup. Alzheimer’s Dement 2024;1-27. https://doi.org/10.1002/alz.13859
先通医药是中国创新放射性药物领域的领先企业,专注于放射性药物的研发创新及落地应用以改善患者的健康水平。先通医药于2014年正式开展新一代放射性药物的研发,总部位于北京,在上海设有研发中心,在江苏、广东、四川建设有现代化放射性药物智能生产基地;同时,在美国设有分支机构,并与十几家跨国药企达成战略合作。全球放射性药物主要应用于神经、心血管、肿瘤三大疾病领域,先通医药已实现全面布局,并拥有20+精准诊断和靶向治疗放射性药物研发管线。凭借自身的研发优势,先通医药获得了投资机构的青睐,2020年4月至今,已成功募资超20亿元人民币,未来不久将登陆主要资本市场,成为中国放射性药物领域的创新力量。
内容来源于网络,如有侵权,请联系删除。
并购放射疗法
2024-07-15
Lantheus pitched Meilleur’s amyloid-targeting NAV-4694 as a complement to its PET agent MK-6240, which is aimed at Alzheimer’s tau tangles.
Lantheus is expanding its holdings of PET imaging agents for Alzheimer’s disease, with the acquisition of Meilleur Technologies.
The deal grants Lantheus exclusive worldwide rights to Meilleur’s radiopharmaceutical diagnostic that highlights beta amyloid plaques in the brain. The injectable agent—known as NAV-4694, or F18-flutafuranol—is currently in phase 3 development.
The acquisition comes just days after the Centers for Medicare and Medicaid Services proposed a separate payment pathway for certain diagnostic radiopharmaceuticals and nuclear medicine imaging agents—instead of bundling them as part of the procedure, as it had in the past.
The change was put forward in CMS’ proposal for payment systems among hospital outpatient services and ambulatory surgical centers, set for the 2025 calendar year. Lantheus’ stock price jumped nearly 60% on the news.
The deal also follows the FDA’s approval earlier this month of Eli Lilly’s Kisunla (donanemab-abzt) treatment for Alzheimer’s, seen as a challenger to Biogen and Eisai’s Leqembi in a newly burgeoning area of anti-amyloid therapies.
“This acquisition solidifies our commitment to neurology, specifically for Alzheimer’s disease management, and reinforces our radiopharmaceutical leadership,” Lantheus CEO Brian Markison said in a statement, which pitched Meilleur’s NAV-4694 as a complement to the company’s PET agent MK-6240, aimed at Alzheimer’s tau tangles.
The companies estimate that nearly 12 million people are living with mild cognitive impairment or Alzheimer’s disease in the U.S. today, a number that may pass 20 million by 2050.
“With the combination of MK-6240 and NAV-4694, we are poised to provide important insights for guiding the use and assessing the impact of novel disease-modifying Alzheimer’s treatments,” Markison said. Lantheus previously acquired MK-6240, an F18-labeled agent also known as florquinitau, in February 2023 through its buyout of Cerveau Technologies.
While the exact financial terms of Lantheus’ deal with Meilleur were not disclosed, the companies said the stock purchase agreement includes an upfront payment as well as additional R&D and commercial milestones, plus royalties. Meilleur will also provide transitional clinical development services for a set time.
“We are excited by the potential of NAV-4694 for earlier identification of Alzheimer’s patients, empowering clinicians to select suitable candidates for timely therapeutic interventions,” said Meilleur CEO Rick Hiatt. “With Lantheus’ expertise in radiopharmaceutical diagnostics and ability to scale operations, I am confident that Lantheus is the ideal company to bring this late-stage biomarker through pivotal trials and into commercialization to one day benefit patients at risk of Alzheimer’s disease.”

并购临床3期诊断试剂
100 项与 Cerveau Technologies, Inc. 相关的药物交易
登录后查看更多信息
100 项与 Cerveau Technologies, Inc. 相关的转化医学
登录后查看更多信息
组织架构
使用我们的机构树数据加速您的研究。
登录
或
管线布局
2026年02月07日管线快照
管线布局中药物为当前组织机构及其子机构作为药物机构进行统计,早期临床1期并入临床1期,临床1/2期并入临床2期,临床2/3期并入临床3期
临床3期
1
登录后查看更多信息
当前项目
| 药物(靶点) | 适应症 | 全球最高研发状态 |
|---|---|---|
Flutafuranol F-18 ( APP ) | 阿尔茨海默症 更多 | 临床3期 |
登录后查看更多信息
药物交易
使用我们的药物交易数据加速您的研究。
登录
或
转化医学
使用我们的转化医学数据加速您的研究。
登录
或
营收
使用 Synapse 探索超过 36 万个组织的财务状况。
登录
或
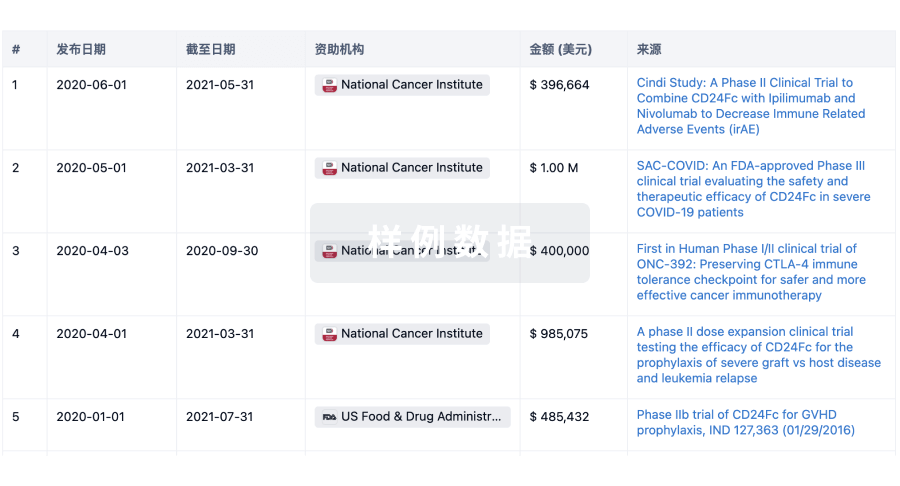
科研基金(NIH)
访问超过 200 万项资助和基金信息,以提升您的研究之旅。
登录
或
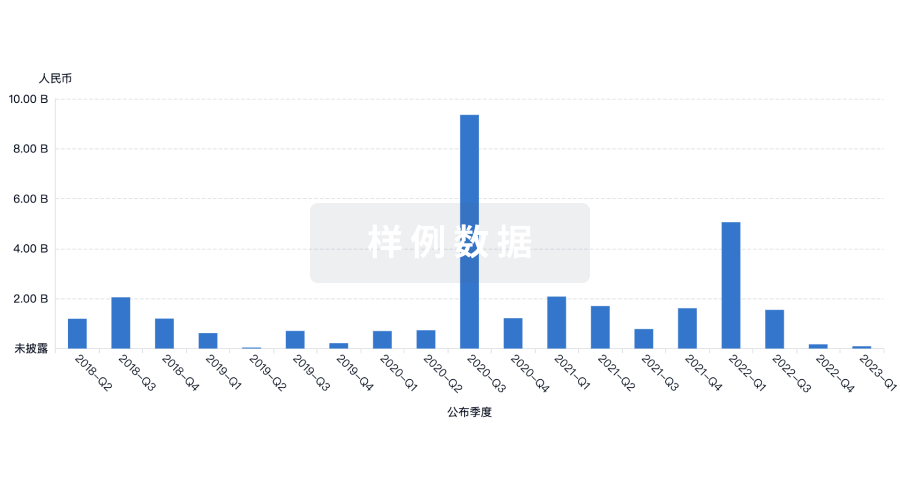
投资
深入了解从初创企业到成熟企业的最新公司投资动态。
登录
或
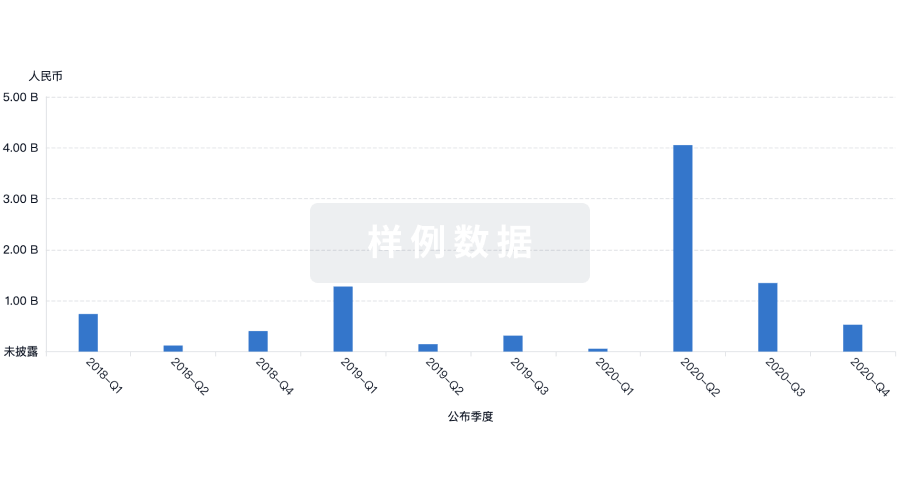
融资
发掘融资趋势以验证和推进您的投资机会。
登录
或
生物医药百科问答
全新生物医药AI Agent 覆盖科研全链路,让突破性发现快人一步
立即开始免费试用!
智慧芽新药情报库是智慧芽专为生命科学人士构建的基于AI的创新药情报平台,助您全方位提升您的研发与决策效率。
立即开始数据试用!
智慧芽新药库数据也通过智慧芽数据服务平台,以API或者数据包形式对外开放,助您更加充分利用智慧芽新药情报信息。
生物序列数据库
生物药研发创新
免费使用
化学结构数据库
小分子化药研发创新
免费使用
