预约演示
The Mass Spectrometry Market to grow by USD 2,520.16 million from 2022 to 2027|Increasing demand for portable mass spectrometers is a major trend - Technavio
2023-08-01
NEW YORK, Aug. 1, 2023 /PRNewswire/ -- The
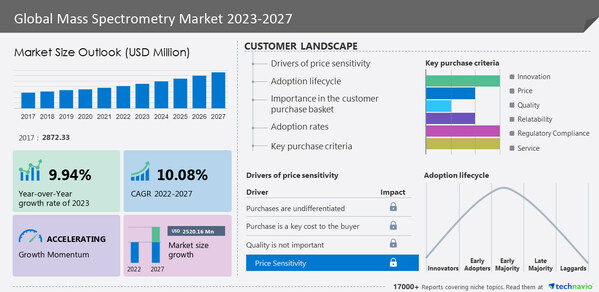
mass spectrometry market is estimated to grow by
USD 2,520.16 million at a
CAGR of 10.08% between 2022 and 2027.
Discover some insights on market size historic period (2017 to 2021) and Forecast (2023 to 2027) before buying the full report -Request a sample report
Continue Reading
Preview
来源: PRNewswire
Technavio has announced its latest market research report titled Global Mass Spectrometry Market
Mass spectrometry market – Vendor Analysis
Vendor Landscape - The mass spectrometry market is fragmented, with the presence of several global as well as regional vendors. A few prominent vendors that offer mass spectrometry in the market are 908 Devices Inc., ABB Ltd., Agilent Technologies Inc., Bruker Corp., Endress Hauser Group Services AG, European Virtual Institute for Speciation Analysis, JEOL Ltd., Kore Technology Ltd., LECO Corp., Perkin Elmer Inc., Rigaku Corp., Shimadzu Corp., Teledyne Technologies Inc., Thermo Fisher Scientific Inc., and Waters Corp. and others.
What's New? -
Special coverage on the Russia-Ukraine war; global inflation; recovery analysis from COVID-19; supply chain disruptions, global trade tensions; and risk of recession
Global competitiveness and key competitor positions
Market presence across multiple geographical footprints - Strong/Active/Niche/Trivial -
Buy the report!
Vendor Offerings -
Agilent Technologies Inc - The company offers mass spectrometry such as triple quadrupole LC-MS, quadrupole time of flight LC-MS, and high throughput LC-MS.
ABB Ltd. - The company offers mass spectrometry such as ABB measurement and analytics.
Perkin Elmer Inc. - The company offers mass spectrometry such as GC MS, LC-MS-MS, and ICP MS.
For details on the vendor and its offerings –
Request a sample report
Mass Spectrometry Market - Segmentation Assessment
Segment Overview
Technavio has segmented the market based on end-user (pharmaceutical and biotechnology industries, chemical and petrochemical industries, and others), and products (instruments, consumables, and services)
The market share growth by the
pharmaceutical and biotechnology industries segment will be significant during the forecast period. This growth is due to the adoption of a unique mass-to-charge ratio of a given molecule that is used to reveal the structure, concentration, identity, and behavior of molecules in solid and liquid samples, thus assisting in the development of new drugs. Determining the molecular structure and purity of samples and rapidly screening and mapping small molecule binding sites of various protein targets are considered some of the important applications of mass spectrometry in the pharmaceutical and biotechnology industries.
Geography Overview
By geography, the global mass spectrometry market is segmented into North America, Europe, Asia, and the Rest of the World (ROW). The report provides actionable insights and estimates the contribution of all regions to the growth of the global mass spectrometry market.
North America is estimated to contribute
42% to the growth of the global market during the forecast period. This is because several pharmaceutical companies are increasingly focusing on drug discovery and development. Some large pharmaceutical companies, such as Novartis International AG and Pfizer, have invested in numerous research activities related to drug development and vaccine manufacturing. For example, PhRMA has invested approximately US$102.38 billion in its 2022 research and development activities.
For insights on global, regional, and country-level parameters with growth opportunities from 2017 to 2027 - Download a Sample Report
Mass Spectrometry Market –
Market Dynamics
Key Drivers
The rise in the geriatric population is a key factor driving the market growth. Skin infections, bacterial pneumonia, influenza, urinary tract infections, and gastrointestinal infections are some of the most frequent microbial diseases impacting aging populations. Furthermore, the elderly population is subjected to diagnostic tests, such as microbial testing, on a regular basis due to their low immunity and metabolism. Hence, the growing geriatric population is expected to drive market growth during the forecast period.
Major Trends
Increasing demand for portable mass spectrometers is a major trend in the market. With the advent of this technology, several vendors on the market offer small permanent magnets that make mass spectrometers easier to carry, as opposed to traditional mass spectrometer systems that are very large and bulky. For example, The Thermo Fisher Scientific Prima BT Benchtop Mass Spectrometer offers several advantages, which include easy sample introduction, automated sampling, and best-in-class resolution. Thus, the benefits are expected to drive market growth during the forecast period.
Significant Challenges
The lack of imaging capabilities is a significant challenge restraining market growth. Molecular imaging techniques are a widely used technique in pharmaceutical research and biomarker discovery and identification because they allow researchers to see the biological and anatomical features of these molecules. However, one of the limitations of these spectrometers is their inability to perform such imaging functions. Hence, these limitations are expected to restrict the mass spectrometry market growth during the forecast period.
Drivers, Trends, and challenges have an impact on market dynamics, which can impact businesses. Find more insights in a sample report!
What are the key data covered in this Mass Spectrometry Market report?
CAGR of the market during the forecast period
Detailed information on factors that will drive the growth of the mass spectrometry market between 2023 and 2027
Precise estimation of the size of the mass spectrometry market and its contribution to the market in focus on the parent market
Accurate predictions about upcoming trends and changes in consumer behavior
Growth of the mass spectrometry market across North America, Europe, Asia, and the Rest of the World (ROW)
A thorough analysis of the market's competitive landscape and detailed information about vendors
Comprehensive analysis of factors that will challenge the growth of mass spectrometry market vendors
Gain instant access to 17,000+ market research reports.
Technavio's SUBSCRIPTION platform
Related Reports
The
direct-to-consumer (DTC) laboratory testing market is estimated to grow by USD 9,703.47 million at a CAGR of 31.59% between 2022 and 2027. Furthermore, this report extensively covers market segmentation by type (blood, urine, saliva, and others), Application (routine clinical testing, diabetes testing, genetic testing, thyroid-stimulating hormone testing, and others), and geography (North America, Europe, Asia, and Rest of World (ROW)). Increased Internet penetration is a major trend in the market.
The
oncology molecular diagnostics market is estimated to grow by USD 2,980.87 million at a CAGR of 11.82% between 2022 and 2027. The product (reagents, kits, and instruments), type (breast cancer, colorectal cancer, prostate cancer, liver cancer, and others), and geography (North America, Europe, Asia, and the Rest of the World (ROW)). Integration of next-generation sequencing in oncology molecular diagnostics is a major trend in the market.
Table of Contents
1 Executive Summary
1.1 Market Overview
Exhibit 01: Executive Summary – Chart on Market Overview
Exhibit 02: Executive Summary – Data Table on Market Overview
Exhibit 03: Executive Summary – Chart on Global Market Characteristics
Exhibit 04: Executive Summary – Chart on Market by Geography
Exhibit 05: Executive Summary – Chart on Market Segmentation by End-user
Exhibit 06: Executive Summary – Chart on Market Segmentation by Product
Exhibit 07: Executive Summary – Chart on Incremental Growth
Exhibit 08: Executive Summary – Data Table on Incremental Growth
Exhibit 09: Executive Summary – Chart on Vendor Market Positioning
2 Market Landscape
2.1 Market ecosystem
Exhibit 10: Parent market
Exhibit 11: Market Characteristics
3 Market Sizing
3.1 Market definition
Exhibit 12: Offerings of vendors included in the market definition
3.2 Market segment analysis
Exhibit 13: Market segments
3.3 Market size 2022
3.4 Market outlook: Forecast for 2022-2027
Exhibit 14: Chart on Global - Market size and forecast 2022-2027 ($ million)
Exhibit 15: Data Table on Global - Market size and forecast 2022-2027 ($ million)
Exhibit 16: Chart on Global Market: Year-over-year growth 2022-2027 (%)
Exhibit 17: Data Table on Global Market: Year-over-year growth 2022-2027 (%)
4 Historic Market Size
4.1 Global mass spectrometry market 2017 - 2021
Exhibit 18: Historic Market Size – Data Table on global mass spectrometry market 2017 - 2021 ($ million)
4.2 End-user Segment Analysis 2017 - 2021
Exhibit 19: Historic Market Size – End-user Segment 2017 - 2021 ($ million)
4.3 Product Segment Analysis 2017 - 2021
Exhibit 20: Historic Market Size – Product Segment 2017 - 2021 ($ million)
4.4 Geography Segment Analysis 2017 - 2021
Exhibit 21: Historic Market Size – Geography Segment 2017 - 2021 ($ million)
4.5 Country Segment Analysis 2017 - 2021
Exhibit 22: Historic Market Size – Country Segment 2017 - 2021 ($ million)
5 Five Forces Analysis
5.1 Five forces summary
Exhibit 23: Five forces analysis - Comparison between 2022 and 2027
5.2 Bargaining power of buyers
Exhibit 24: Chart on Bargaining power of buyers – Impact of key factors 2022 and 2027
5.3 Bargaining power of suppliers
Exhibit 25: Bargaining power of suppliers – Impact of key factors in 2022 and 2027
5.4 Threat of new entrants
Exhibit 26: Threat of new entrants – Impact of key factors in 2022 and 2027
5.5 Threat of substitutes
Exhibit 27: Threat of substitutes – Impact of key factors in 2022 and 2027
5.6 Threat of rivalry
Exhibit 28: Threat of rivalry – Impact of key factors in 2022 and 2027
5.7 Market condition
Exhibit 29: Chart on Market condition - Five forces 2022 and 2027
6 Market Segmentation by End-user
6.1 Market segments
Exhibit 30: Chart on End-user - Market share 2022-2027 (%)
Exhibit 31: Data Table on End-user - Market share 2022-2027 (%)
6.2 Comparison by End-user
Exhibit 32: Chart on Comparison by End-user
Exhibit 33: Data Table on Comparison by End-user
6.3 Pharmaceutical and biotechnology industries - Market size and forecast 2022-2027
Exhibit 34: Chart on Pharmaceutical and biotechnology industries - Market size and forecast 2022-2027 ($ million)
Exhibit 35: Data Table on Pharmaceutical and biotechnology industries - Market size and forecast 2022-2027 ($ million)
Exhibit 36: Chart on Pharmaceutical and biotechnology industries - Year-over-year growth 2022-2027 (%)
Exhibit 37: Data Table on Pharmaceutical and biotechnology industries - Year-over-year growth 2022-2027 (%)
6.4 Chemical and petrochemical industries - Market size and forecast 2022-2027
Exhibit 38: Chart on Chemical and petrochemical industries - Market size and forecast 2022-2027 ($ million)
Exhibit 39: Data Table on Chemical and petrochemical industries - Market size and forecast 2022-2027 ($ million)
Exhibit 40: Chart on Chemical and petrochemical industries - Year-over-year growth 2022-2027 (%)
Exhibit 41: Data Table on Chemical and petrochemical industries - Year-over-year growth 2022-2027 (%)
6.5 Others - Market size and forecast 2022-2027
Exhibit 42: Chart on Others - Market size and forecast 2022-2027 ($ million)
Exhibit 43: Data Table on Others - Market size and forecast 2022-2027 ($ million)
Exhibit 44: Chart on Others - Year-over-year growth 2022-2027 (%)
Exhibit 45: Data Table on Others - Year-over-year growth 2022-2027 (%)
6.6 Market opportunity by End-user
Exhibit 46: Market opportunity by End-user ($ million)
Exhibit 47: Data Table on Market opportunity by End-user ($ million)
7 Market Segmentation by Product
7.1 Market segments
Exhibit 48: Chart on Product - Market share 2022-2027 (%)
Exhibit 49: Data Table on Product - Market share 2022-2027 (%)
7.2 Comparison by Product
Exhibit 50: Chart on Comparison by Product
Exhibit 51: Data Table on Comparison by Product
7.3 Instruments - Market size and forecast 2022-2027
Exhibit 52: Chart on Instruments - Market size and forecast 2022-2027 ($ million)
Exhibit 53: Data Table on Instruments - Market size and forecast 2022-2027 ($ million)
Exhibit 54: Chart on Instruments - Year-over-year growth 2022-2027 (%)
Exhibit 55: Data Table on Instruments - Year-over-year growth 2022-2027 (%)
7.4 Consumables and services - Market size and forecast 2022-2027
Exhibit 56: Chart on Consumables and services - Market size and forecast 2022-2027 ($ million)
Exhibit 57: Data Table on Consumables and services - Market size and forecast 2022-2027 ($ million)
Exhibit 58: Chart on Consumables and services - Year-over-year growth 2022-2027 (%)
Exhibit 59: Data Table on Consumables and services - Year-over-year growth 2022-2027 (%)
7.5 Market opportunity by Product
Exhibit 60: Market opportunity by Product ($ million)
Exhibit 61: Data Table on Market opportunity by Product ($ million)
8 Customer Landscape
8.1 Customer landscape overview
Exhibit 62: Analysis of price sensitivity, lifecycle, customer purchase basket, adoption rates, and purchase criteria
9 Geographic Landscape
9.1 Geographic segmentation
Exhibit 63: Chart on Market share by geography 2022-2027 (%)
Exhibit 64: Data Table on Market share by geography 2022-2027 (%)
9.2 Geographic comparison
Exhibit 65: Chart on Geographic comparison
Exhibit 66: Data Table on Geographic comparison
9.3 North America - Market size and forecast 2022-2027
Exhibit 67: Chart on North America - Market size and forecast 2022-2027 ($ million)
Exhibit 68: Data Table on North America - Market size and forecast 2022-2027 ($ million)
Exhibit 69: Chart on North America - Year-over-year growth 2022-2027 (%)
Exhibit 70: Data Table on North America - Year-over-year growth 2022-2027 (%)
9.4 Europe - Market size and forecast 2022-2027
Exhibit 71: Chart on Europe - Market size and forecast 2022-2027 ($ million)
Exhibit 72: Data Table on Europe - Market size and forecast 2022-2027 ($ million)
Exhibit 73: Chart on Europe - Year-over-year growth 2022-2027 (%)
Exhibit 74: Data Table on Europe - Year-over-year growth 2022-2027 (%)
9.5 Asia - Market size and forecast 2022-2027
Exhibit 75: Chart on Asia - Market size and forecast 2022-2027 ($ million)
Exhibit 76: Data Table on Asia - Market size and forecast 2022-2027 ($ million)
Exhibit 77: Chart on Asia - Year-over-year growth 2022-2027 (%)
Exhibit 78: Data Table on Asia - Year-over-year growth 2022-2027 (%)
9.6 Rest of World (ROW) - Market size and forecast 2022-2027
Exhibit 79: Chart on Rest of World (ROW) - Market size and forecast 2022-2027 ($ million)
Exhibit 80: Data Table on Rest of World (ROW) - Market size and forecast 2022-2027 ($ million)
Exhibit 81: Chart on Rest of World (ROW) - Year-over-year growth 2022-2027 (%)
Exhibit 82: Data Table on Rest of World (ROW) - Year-over-year growth 2022-2027 (%)
9.7 US - Market size and forecast 2022-2027
Exhibit 83: Chart on US - Market size and forecast 2022-2027 ($ million)
Exhibit 84: Data Table on US - Market size and forecast 2022-2027 ($ million)
Exhibit 85: Chart on US - Year-over-year growth 2022-2027 (%)
Exhibit 86: Data Table on US - Year-over-year growth 2022-2027 (%)
9.8 Canada - Market size and forecast 2022-2027
Exhibit 87: Chart on Canada - Market size and forecast 2022-2027 ($ million)
Exhibit 88: Data Table on Canada - Market size and forecast 2022-2027 ($ million)
Exhibit 89: Chart on Canada - Year-over-year growth 2022-2027 (%)
Exhibit 90: Data Table on Canada - Year-over-year growth 2022-2027 (%)
9.9 Germany - Market size and forecast 2022-2027
Exhibit 91: Chart on Germany - Market size and forecast 2022-2027 ($ million)
Exhibit 92: Data Table on Germany - Market size and forecast 2022-2027 ($ million)
Exhibit 93: Chart on Germany - Year-over-year growth 2022-2027 (%)
Exhibit 94: Data Table on Germany - Year-over-year growth 2022-2027 (%)
9.10 China - Market size and forecast 2022-2027
Exhibit 95: Chart on China - Market size and forecast 2022-2027 ($ million)
Exhibit 96: Data Table on China - Market size and forecast 2022-2027 ($ million)
Exhibit 97: Chart on China - Year-over-year growth 2022-2027 (%)
Exhibit 98: Data Table on China - Year-over-year growth 2022-2027 (%)
9.11 UK - Market size and forecast 2022-2027
Exhibit 99: Chart on UK - Market size and forecast 2022-2027 ($ million)
Exhibit 100: Data Table on UK - Market size and forecast 2022-2027 ($ million)
Exhibit 101: Chart on UK - Year-over-year growth 2022-2027 (%)
Exhibit 102: Data Table on UK - Year-over-year growth 2022-2027 (%)
9.12 Market opportunity by geography
Exhibit 103: Market opportunity by geography ($ million)
Exhibit 104: Data Tables on Market opportunity by geography ($ million)
10 Drivers, Challenges, and Trends
10.1 Market drivers
10.2 Market challenges
10.3 Impact of drivers and challenges
Exhibit 105: Impact of drivers and challenges in 2022 and 2027
10.4 Market trends
11 Vendor Landscape
11.1 Overview
11.2 Vendor landscape
Exhibit 106: Overview on Criticality of inputs and Factors of differentiation
11.3 Landscape disruption
Exhibit 107: Overview on factors of disruption
11.4 Industry risks
Exhibit 108: Impact of key risks on business
12 Vendor Analysis
12.1 Vendors covered
Exhibit 109: Vendors covered
12.2 Market positioning of vendors
Exhibit 110: Matrix on vendor position and classification
12.3 908 Devices Inc.
Exhibit 111: 908 Devices Inc. - Overview
Exhibit 112: 908 Devices Inc. - Product / Service
Exhibit 113: 908 Devices Inc. - Key offerings
12.4 ABB Ltd.
Exhibit 114: ABB Ltd. - Overview
Exhibit 115: ABB Ltd. - Business segments
Exhibit 116: ABB Ltd. - Key offerings
Exhibit 117: ABB Ltd. - Segment focus
Exhibit 118: Agilent Technologies Inc. - Overview
Exhibit 119: Agilent Technologies Inc. - Business segments
Exhibit 120: Agilent Technologies Inc. - Key offerings
Exhibit 121: Agilent Technologies Inc. - Segment focus
12.6 Bruker Corp.
Exhibit 122: Bruker Corp. - Overview
Exhibit 123: Bruker Corp. - Business segments
Exhibit 124: Bruker Corp. - Key news
Exhibit 125: Bruker Corp. - Key offerings
Exhibit 126: Bruker Corp. - Segment focus
12.7 Endress Hauser Group Services AG
Exhibit 127: Endress Hauser Group Services AG - Overview
Exhibit 128: Endress Hauser Group Services AG - Product / Service
Exhibit 129: Endress Hauser Group Services AG - Key news
Exhibit 130: Endress Hauser Group Services AG - Key offerings
12.8 European Virtual Institute for Speciation Analysis
Exhibit 131: European Virtual Institute for Speciation Analysis - Overview
Exhibit 132: European Virtual Institute for Speciation Analysis - Product / Service
Exhibit 133: European Virtual Institute for Speciation Analysis - Key offerings
12.9 JEOL Ltd.
Exhibit 134: JEOL Ltd. - Overview
Exhibit 135: JEOL Ltd. - Business segments
Exhibit 136: JEOL Ltd. - Key offerings
Exhibit 137: JEOL Ltd. - Segment focus
12.10 Kore Technology Ltd.
Exhibit 138: Kore Technology Ltd. - Overview
Exhibit 139: Kore Technology Ltd. - Product / Service
Exhibit 140: Kore Technology Ltd. - Key offerings
12.11 LECO Corp.
Exhibit 141: LECO Corp. - Overview
Exhibit 142: LECO Corp. - Product / Service
Exhibit 143: LECO Corp. - Key offerings
12.12 Perkin Elmer Inc.
Exhibit 144: Perkin Elmer Inc. - Overview
Exhibit 145: Perkin Elmer Inc. - Business segments
Exhibit 146: Perkin Elmer Inc. - Key news
Exhibit 147: Perkin Elmer Inc. - Key offerings
Exhibit 148: Perkin Elmer Inc. - Segment focus
12.13 Rigaku Corp.
Exhibit 149: Rigaku Corp. - Overview
Exhibit 150: Rigaku Corp. - Product / Service
Exhibit 151: Rigaku Corp. - Key offerings
12.14 Shimadzu Corp.
Exhibit 152: Shimadzu Corp. - Overview
Exhibit 153: Shimadzu Corp. - Business segments
Exhibit 154: Shimadzu Corp. - Key news
Exhibit 155: Shimadzu Corp. - Key offerings
Exhibit 156: Shimadzu Corp. - Segment focus
12.15 Teledyne Technologies Inc.
Exhibit 157: Teledyne Technologies Inc. - Overview
Exhibit 158: Teledyne Technologies Inc. - Business segments
Exhibit 159: Teledyne Technologies Inc. - Key news
Exhibit 160: Teledyne Technologies Inc. - Key offerings
Exhibit 161: Teledyne Technologies Inc. - Segment focus
Exhibit 162: Thermo Fisher Scientific Inc. - Overview
Exhibit 163: Thermo Fisher Scientific Inc. - Business segments
Exhibit 164: Thermo Fisher Scientific Inc. - Key news
Exhibit 165: Thermo Fisher Scientific Inc. - Key offerings
Exhibit 166: Thermo Fisher Scientific Inc. - Segment focus
12.17 Waters Corp.
Exhibit 167: Waters Corp. - Overview
Exhibit 168: Waters Corp. - Business segments
Exhibit 169: Waters Corp. - Key news
Exhibit 170: Waters Corp. - Key offerings
Exhibit 171: Waters Corp. - Segment focus
13 Appendix
13.1 Scope of the report
13.2 Inclusions and exclusions checklist
Exhibit 172: Inclusions checklist
Exhibit 173: Exclusions checklist
13.3 Currency conversion rates for US$
Exhibit 174: Currency conversion rates for US$
13.4 Research methodology
Exhibit 175: Research methodology
Exhibit 176: Validation techniques employed for market sizing
Exhibit 177: Information sources
13.5 List of abbreviations
Exhibit 178: List of abbreviations
About Us
Technavio is a leading global technology research and advisory company. Their research and analysis focus on emerging market trends and provide actionable insights to help businesses identify market opportunities and develop effective strategies to optimize their market positions. With over 500 specialized analysts, Technavio's report library consists of more than 17,000 reports and counting, covering 800 technologies, spanning 50 countries. Their client base consists of enterprises of all sizes, including more than 100 Fortune 500 companies. This growing client base relies on Technavio's comprehensive coverage, extensive research, and actionable market insights to identify opportunities in existing and potential markets and assess their competitive positions within changing market scenarios.
Contact
Technavio Research
Jesse Maida
Media & Marketing Executive
US: +1 844 364 1100
UK: +44 203 893 3200
Email: [email protected]
Website: www.technavio.com
SOURCE Technavio
更多内容,请访问原始网站
文中所述内容并不反映新药情报库及其所属公司任何意见及观点,如有版权侵扰或错误之处,请及时联系我们,我们会在24小时内配合处理。
靶点
-药物
-生物医药百科问答
全新生物医药AI Agent 覆盖科研全链路,让突破性发现快人一步


立即开始免费试用!
智慧芽新药情报库是智慧芽专为生命科学人士构建的基于AI的创新药情报平台,助您全方位提升您的研发与决策效率。
立即开始数据试用!
智慧芽新药库数据也通过智慧芽数据服务平台,以API或者数据包形式对外开放,助您更加充分利用智慧芽新药情报信息。