预约演示
更新于:2025-12-10

Friedrich Schiller University of Jena
更新于:2025-12-10
概览
标签
其他疾病
感染
肿瘤
小分子化药
病毒样颗粒疫苗
治疗性疫苗
疾病领域得分
一眼洞穿机构专注的疾病领域
暂无数据
技术平台
公司药物应用最多的技术
暂无数据
靶点
公司最常开发的靶点
暂无数据
| 排名前五的药物类型 | 数量 |
|---|---|
| 小分子化药 | 8 |
| 病毒样颗粒疫苗 | 1 |
| 治疗性疫苗 | 1 |
关联
9
项与 Friedrich Schiller University of Jena 相关的药物靶点- |
作用机制- |
在研适应症 |
非在研适应症- |
最高研发阶段临床前 |
首次获批国家/地区- |
首次获批日期- |
作用机制 5-LOX抑制剂 [+1] |
非在研适应症- |
最高研发阶段临床前 |
首次获批国家/地区- |
首次获批日期- |
靶点 |
作用机制 E7调节剂 |
非在研适应症- |
最高研发阶段临床前 |
首次获批国家/地区- |
首次获批日期- |
139
项与 Friedrich Schiller University of Jena 相关的临床试验NCT06749483
The Gut Microbiome - Source of Sepsis and Novel Target in Intensive Care Units? Research on Human Tissue, Body Fluids, Neuropsychological Assessment and Brain Imaging
Here, the investigators propose to study host responses to reduced microbiome complexity driven by treatment with broad spectrum antibiotics in patients with severe infections or sepsis. The proposal aims to combine holistic approaches with emerging experimental technologies to investigate the complex interactions between the gut microbiota and its host and assess the impact of specific bacterial communities on longevity and stress responses. A strong focus of this study will also be placed on microbiome dysbiosis and secondary impacts on short- and long-term brain dysfunction using clinical, laboratory and imaging procedures.
开始日期2024-12-27 |
申办/合作机构 |
NCT07189481
Evaluation Einer Team Time-out Checkliste im OP
In this study, we designed and evaluated a team timeout checklist (TTOC) which aimed at improving team communication and information exchange before skin incision. The WHO surgical safety checklist was used as a basis with the following changes: we clarified the wording of specific items (e.g., surgical site), we clarified checks by denoting separate items involved for each check, and we denoted circulating nurses as responsible for checklist readout and adherence.
开始日期2024-08-01 |
申办/合作机构 |
NCT06137378
ELOS - Induction Chemotherapy With Docetaxel and Cisplatin Followed by Radiation Compared to Additional PD-1 Inhibition in CPS ≥1 Advanced Laryngeal/Hypopharyngeal Cancer Suitable for Laryngectomy Selected After Early Response Evaluation
ELOS is a prospective, randomized, open-label, controlled, two-armed parallel group, phase II multicentre trial in local advanced stage III, IVA/B head and neck squamous cell carcinoma of the larynx or hypopharynx (LHNSCC) with PD-L1-expression within tumor tissue biopsy, calculated as CPS ≥ 1 curable by total laryngectomy. Induction chemotherapy (IC) with Docetaxel and Cisplatin (TP) followed by radiation will be compared to additional PD-1 inhibition. Patients will be selected after short induction early response evaluation after the first cycle IC (IC-1) aiming on larynx organ-preservation by additional 2 cycles IC followed by radiotherapy (69.6 Gy) for responders achieving endoscopic estimated tumor surface shrinkage (ETSS) ≥ 30%. Nonresponders (ETSS < 30% or progressing disease) will receive total laryngectomy and selective neck dissection followed by postoperative radiation or chemoradiation according to the recommendation of the clinics multidisciplinary tumor board. However, Patients randomized into the intervention arm starting day 1 will receive 200 mg Pembrolizumab (MK-3475) i.v. in 3-week cycle (q3w) for 17 cycles (12 months). Treatment with pembrolizumab will continue in the experimental arm regardless of ETSS status after IC-1 in both responders and laryngectomized nonresponders, independent from subsequent decision on adjuvant therapy after TL.
开始日期2024-04-17 |
申办/合作机构  Universität Leipzig Universität Leipzig [+9] |
100 项与 Friedrich Schiller University of Jena 相关的临床结果
登录后查看更多信息
0 项与 Friedrich Schiller University of Jena 相关的专利(医药)
登录后查看更多信息
19,779
项与 Friedrich Schiller University of Jena 相关的文献(医药)2026-03-01·PSYCHOLOGY OF SPORT AND EXERCISE
The role of personal identity for sports and exercise across the life span: Mediating processes and determinants
Article
作者: Rothermund, Klaus
In this article, I discuss the role of personal identity for engagement in physical exercise. While being a most powerful determinant of an individual's level of physical exercise, the identity of a person is still a distal predictor that does not immediately translate into specific behaviours. Important questions thus relate to the processes that mediate effects of personal identity on behaviour and developmental outcomes. Cybernetic models focusing on negative feedback loops (discrepancy detection and corrective processes) provide only a limited understanding of these processes, and have to be complemented with other motivational accounts that specify a more proactive role for identity in the selection of goals and in seeking and engaging in opportunities to become physically active. Furthermore, to increase the potential of identity-related theories for the development of interventions, it is necessary to reflect on the determinants of identity in the domain of physical activity. Processes of accommodation and internalization figure prominently in explaining differences in activity-related identities, especially in later phases of life where many individuals internalize negative age stereotypes of being incapable of physical activity.
2026-01-01·COGNITION
Learn what is detectable, detect what is useful: acquisition of German plural as a classification problem
Article
作者: Monakhov, Sergei ; Balthes, Brisca ; Diessel, Holger
Many computational models of morphology that do not presuppose hand-coding of input data (i.e., do not draw on model-external linguistic knowledge) use character-based formal representations to account for lexical processing and acquisition. While such models are simple and efficient, they are not without problems. From a cognitive perspective, it remains unclear exactly what, according to these models, is represented in the mental lexicon and how speakers learn sublexical units of linguistic form that do not correspond to traditional morphemes (e.g., English -ceive- or German -tor). From a computational perspective, these models are problematic because their methods of identifying formal units make very limited use of distributional information and neglect the role of task-specificity in language processing. In this paper, we present a new computational model of morphology implementing task-specific linear processing guided by the principles of efficiency and reliability. By analysing data from the nominal number system in German, we show that our model not only outperforms state-of-the-art models but also makes predictions about the emergence of words' internal structure that are consistent with the judgments of German native speakers in a psycholinguistic experiment.
2026-01-01·JOURNAL OF ETHNOPHARMACOLOGY
EuroKhat: A pilot study on Khat consumption among Yemeni migrants in Germany
Article
作者: Opel, Nils ; Shabalah, Abdullah ; Refisch, Alexander
ETHNOPHARMACOLOGICAL RELEVANCE:
Khat (Catha edulis), an amphetamine-like stimulant, is deeply rooted in the sociocultural traditions of the Arabian Peninsula and the Horn of Africa, with regular consumption reported by 90 % of men and 50 % of women in Yemen. Beyond its sociocultural role, khat use has been associated with adverse mental health outcomes, including anxiety, insomnia, stress, dysphoric mood, and, in cases of frequent high-dose use, psychosis. Migration to non-khat-producing countries in Europe may alter consumption patterns, yet data on its use among Yemeni migrants in Germany remains limited.
MATERIAL AND METHODS:
This study examined khat consumption patterns among Yemeni migrants in Germany compared to a non-Yemeni control group. A total of 278 participants (159 Yemeni migrants and 119 non-Yemeni residents) completed an anonymous online survey assessing sociodemographic factors, substance use, and mental health, using validated scales (DASS-21, UCLA Loneliness Scale, SCL-90).
RESULTS:
Reported Khat use was prevalent among Yemeni migrants (63.5 % lifetime use), however retrospective assessments indicate a significant decline in frequent use post-migration. The fraction of participants reporting rare or no use increased from 30 % in Yemen to 75 % in Germany, while occasional use remained stable. No significant associations were found between khat use and psychological distress (depression, anxiety, stress, or psychotic symptoms). However, a significant negative correlation between khat use and loneliness (ρ = -0.29, p = 0.003). None of the control group had ever used khat, yet they reported significantly higher alcohol and cannabis consumption.
CONCLUSION:
While khat remains a key cultural practice in Yemeni migrants, none of the non-Yemeni residents ever consumed Khat. In contrast, non-Yemeni reported higher alcohol and cannabis use, underscoring sociocultural influences on substance use. As a pilot study with limited sample size and descriptive analyses, the findings are preliminary and should be interpreted with caution. Future research should explore the role of cultural adaptation and social integration in shaping substance use behaviors among migrant populations.
18
项与 Friedrich Schiller University of Jena 相关的新闻(医药)2025-07-01
SAN FRANCISCO and BERLIN, July 01, 2025 (GLOBE NEWSWIRE) -- T-knife Therapeutics, Inc., a biopharmaceutical company developing T cell receptor (TCR) engineered T cell therapies (TCR-T) to fight cancer, today announced the appointment of Christoph Broja, a Partner at EQT Life Sciences, to its Board of Directors.
“We are pleased to welcome Christoph to our board of directors,” stated Thomas M. Soloway, President and Chief Executive Officer. “Christoph brings a wealth of experience and insight from years of working at the forefront of biotech investing. EQT Life Sciences stands among Europe’s largest investors in the life sciences sector, with a strong track record of identifying and backing groundbreaking biotech innovations. We are fortunate to have his partnership as we work towards rapidly advancing our supercharged PRAME-targeted TCR-T, TK-6302, into the clinic -- with a CTA submission expected later this year.”
Mr. Broja commented, “T-knife has made remarkable progress developing next-generation technologies to engineer TCR-Ts that address the challenges of T cell fitness and persistence, key factors that have limited the full potential of this modality in the solid tumor setting. I am excited to join the board as the company is in transition to a clinical setting, working to demonstrate that TK-6302’s best-in-class preclinical profile translates into a therapy that delivers deep and durable responses in tumor indications with high unmet need.”
Mr. Soloway added, “I would also like to thank Geraldine O’Keeffe, who is leaving our board, for her steady commitment to the mission of T-knife. We wish Geraldine well as she continues her contributions within a new investment strategy at EQT, and to the important work of building and guiding the next wave of biotech companies that are defined by their mission to make a meaningful impact on patient care.”
Mr. Broja is a Partner at EQT Life Sciences in Munich, where he leads investments in biotech, pharmaceuticals, medical devices, and diagnostics, with a focus on early-stage and growth opportunities. Known for his collaborative, curiosity-driven approach, he is recognized for bringing an investor-first perspective to life sciences venture capital and for his leadership in advancing the European biotech ecosystem. He is currently a board member at Tubulis GmbH and previously served on the board of Cardior Pharmaceuticals, among others. Before joining EQT in 2022, Mr. Broja was a Principal at Gurnet Point Capital in Boston, where he contributed to investments across biopharma and molecular diagnostics and held board roles at several innovative healthcare companies. Prior to that, Mr. Broja worked at B-Flexion Capital in London, and he started his career as an investment analyst at the private equity firm Franz Haniel & Cie. in Germany. Mr. Broja holds a degree in Business Administration from Friedrich Schiller University Jena and is a Chartered Financial Analyst (CFA).
About T-knife TherapeuticsT-knife is a biopharmaceutical company dedicated to developing T cell receptor (TCR) engineered T cell therapies (TCR-Ts) to deliver broad, deep and durable responses to solid tumor cancer patients. The company’s unique approach leverages its proprietary platforms and synthetic biology capabilities to design the next-generation of supercharged TCR-Ts with best-in-class potential.
The company’s lead program, TK-6302, is a supercharged PRAME targeting TCR-T that includes novel enhancements to improve T cell fitness and persistence, to overcome the immunosuppressive tumor micro-environment, and to improve durability of response. The company plans to submit a Clinical Trial Application (CTA) in the fall of 2025 to initiate a Phase 1 clinical study of TK-6302 in 2026.
T-knife was founded by leading T cell and immunology experts utilizing technology developed at the Max Delbrück Center for Molecular Medicine together with Charité – Universitätsmedizin Berlin, is led by an experienced management team, and is supported by a leading group of international investors, including Andera Partners, EQT Life Sciences, RA Capital Management and Versant Ventures. For additional information, please visit the company’s website at www.t-knife.com.
T-knife Therapeutics, Inc. Camille Landis Chief Business Officer / Chief Financial Officer media@t-knife.com
高管变更细胞疗法临床1期
2024-12-03
Liom, formerly known as Spiden, a pioneer in non-invasive biomarker monitoring aiming to develop the first non-invasive glucose monitoring wearable, is thrilled to announce significant technological milestones and a successful kick-off of its Series A. PFÄFFIKON, SWITZERLAND / ACCESSWIRE / December 3, 2024 / Liom has continued its technological progress: it is the first and only company to demonstrate accurate non-invasive glucose measurements without the need for invasive per-subject calibration using a needle. This puts Liom ahead of the deep-pocketed, established players in the wearable business, such as Apple, Samsung and Google, that so far were not able to share comparable results. Liom has repeatedly demonstrated this capability throughout 2024 in a number of internal and external studies, which ranged from 3-6 hours and were conducted on >60 subjects so far. In a recent third-party validation study (i.e., external and prospective), Liom's proprietary benchtop system and AI algorithms demonstrated a MARD (Mean Absolute Relative Difference) of 14.5% without any per-subject calibration (publication pre-print available via: https://doi.org/10.1101/2024.08.17.24312052). MARD is the percentage error to the reference measurement, which in this case is a catheter-derived venous measurement. The company's light-& AI-only measurements show excellent agreement with reference blood glucose values for a wide range of glucose levels and time series. Using per-subject calibration, the MARD attained was even lower, at 7%. This performance is comparable to the first generation of needle-based CGMs, which after 10 years of optimization, have gradually reached the <10% MARD level. Currently, these devices, predominantly sold by the two medtech giants Abbott and Dexcom, dominate the strongly growing continuous glucose monitoring (CGM) market of USD >10bn that is attempting expansion towards healthy consumers, despite requiring replacement of its needle-based technology every 10-14 days. Liom sees significant potential for further improvement of its performance in the near-term, enabled by its purely light- and AI-driven approach that allows for rapid iteration. Prof. Dr. Lutz Heinemann, Founder and former CEO of leading CRO Profil, comments on Liom's recent progress: "The combination of Liom's innovative approach, scientific depth, interdisciplinary team, and impressive results are unique. I look forward to Liom's progress towards a product with confidence and optimism!"On top of these achievements, Liom also made significant headway regarding the miniaturization of its technology into a wearable form factor. Liom's miniaturization strategy is enabled by an innovative spectrometer design and a strong network of established suppliers in electronics and optics, which provides a clear pathway towards development of a wrist-worn product at cost and scale."These accomplishments reflect our strong track record of steadily and reliably making progress towards our goal of launching the ultimate wearable that monitors glucose non-invasively, integrated together with other health metrics", says Leo Grünstein, Liom's Founder & CEO. "We aim to help customers around the world take control of their health through non-invasive access to real-time biomarker data and actionable, evidence-based insights to improve their well-being and longevity."Liom has raised over USD 55m in equity funding to-date and employs a team of >80 FTE, most of whom are PhD scientists running Liom's deep-tech lab and clinical trial operations. This traction in funding reflects strong support from its existing investors, Board members, and new investors. The company now kicked-off a USD 50-70m Series A, of which USD >25m have already been secured. This will allow Liom to create and test its wrist-worn prototype in all of life's circumstances on 100+ people by end of 2025 and launch a pre-launch sales campaign in H1'26 where customers for the first time will be able to order Liom's "ultimate wearable" which will be shipped to them maximum 12 months after, latest by mid-2027. A waitlist sign-up for its launch is already available on Liom's website www.liom.com.Prof. Dr. Jürgen Popp, Professor of the Institute of Physical Chemistry at the University of Jena & Scientific Director of the Leibniz Institute of Photonic Technology, adds: "The innovative approach taken by Liom represents a leap forward in non-invasive glucose sensing. By combining advanced spectroscopy techniques with machine learning, they are addressing one of the most pressing challenges in preventative health. Their interdisciplinary team's expertise, coupled with promising clinical results demonstrated with their benchtop prototype, positions them at the forefront of this field. This technology has the potential to transform glucose monitoring and improve the quality of life for millions worldwide."About LiomFounded in 2017 by serial entrepreneur Leo Grünstein, Liom (ex-Spiden) is a Swiss health tech startup with offices in Pfäffikon SZ (Switzerland) and San Francisco (USA) employing over 80 team members. The company is dedicated to revolutionizing preventative and personalized health monitoring through a novel wearable, that enlightens users with unparalleled real-time biophysical feedback. This empowers uses to make optimal lifestyle choices for improved health and well-being. Liom's first product will be the world's first non-invasive glucose monitoring wearable that offers a comprehensive view of metabolic health. This device integrates non-invasive glucose monitoring and other health metrics, such as heart rate and movement. The product is designed for consumers looking to optimize an active, healthy lifestyle, improve their habits, or mitigate the risk of developing health conditions. Liom's ultimate vision is to expand its capabilities by measuring additional biomarkers, including macronutrients like lipids and proteins, as well as ketones, hydration, and lactate, leveraging its proprietary light- and AI-based technology. This will provide users with an even more comprehensive overview of their health and pave the way for even broader applications.Contact InformationLeo Grünstein Founder & CEO[email protected]Related ImagesSource: Liom
2024-10-17
COLD SPRING HARBOR, N.Y., Oct. 17, 2024 /PRNewswire/ -- Imagine you wake up in a hospital without a single memory of the last month. Doctors say you had a series of violent episodes and paranoid delusions. You'd become convinced you were suffering from bipolar disorder. Then, after a special test, a neurologist diagnoses you with a rare autoimmune disease called anti-NMDAR encephalitis. This is what happened to Susannah Cahalan, a New York Post reporter who would go on to write the best-selling memoir Brain on Fire: My Month of Madness.
Continue Reading
Cold Spring Harbor Laboratory’s Furukawa lab is studying an autoimmune disease called anti-NMDAR encephalitis in collaboration with Professor Christian Geis’ team at the University of Jena and the SYNABS research unit in Germany. Here, we see antibodies from a human anti-NMDAR encephalitis patient (purple) binding to NMDARs (green) in a mouse brain. Areas marked red indicate high levels of antibody binding.
Anti-NMDAR encephalitis can lead to hallucinations, blackouts, and psychosis, says Cold Spring Harbor Laboratory Professor Hiro Furukawa. It mostly affects women ages 25 to 35—the same age at which schizophrenia often presents itself. But what's happening in anti-NMDAR encephalitis is something else.
Furukawa specializes in NMDARs, brain receptors that play a critical role in cognition and memory. "In anti-NMDAR encephalitis, antibodies bind to those receptors and prevent them from working," he explains. As an autoimmune response, the brain becomes inflamed—hence, Brain on Fire.
While some treatments are available, their effectiveness varies depending on symptom severity. New research from the Furukawa lab may explain why. In a recent study, Furukawa and colleagues map how antibodies from three patients bind to NMDARs. They find that the way in which each of the three antibodies binds to NMDARs differs. The discovery marks an important step in gaining a fuller understanding of anti-NMDAR encephalitis, a condition first diagnosed in 2008. Furthermore, it suggests personalized medicine may be critical for treating this disease.
"Distinct binding patterns manifest in different functional regulation levels in NMDARs," Furukawa explains. "This affects neuronal activities. So, different binding sites may correspond to variations in patients' symptoms." Uncovering those correlations could lead to more precise therapeutic strategies. Imagine, for example, that scientists identify several binding sites common among encephalitis patients. Pharmacologists could then design new drugs to target these sites. But that's not all. Personalized medicine could also mean more accurate diagnoses, Furukawa says.
"It's still a rare disease, but it could be misdiagnosed or underdiagnosed. Therefore, we need to spread awareness. Could, for example, some schizophrenic patients have this disease? Could it be caused by antibodies?"
Currently, it's said that anti-NMDAR encephalitis affects one in 1.5 million people. Yet, in time, we may find it's more common than previously assumed. That's a scary thought. However, it could explain why existing psychiatric medicine does not work for some people diagnosed with bipolar disorder and other mental health conditions—a huge revelation for patients as well as the families and therapists who care for them.
About Cold Spring Harbor Laboratory
Founded in 1890, Cold Spring Harbor Laboratory has shaped contemporary biomedical research and education with programs in cancer, neuroscience, plant biology and quantitative biology. Home to eight Nobel Prize winners, the private, not-for-profit Laboratory employs 1,000 people including 600 scientists, students and technicians. For more information, visit
SOURCE Cold Spring Harbor Laboratory
WANT YOUR COMPANY'S NEWS FEATURED ON PRNEWSWIRE.COM?
440k+
Newsrooms &
Influencers
9k+
Digital Media
Outlets
270k+
Journalists
Opted In
GET STARTED
100 项与 Friedrich Schiller University of Jena 相关的药物交易
登录后查看更多信息
100 项与 Friedrich Schiller University of Jena 相关的转化医学
登录后查看更多信息
组织架构
使用我们的机构树数据加速您的研究。
登录
或
管线布局
2026年02月08日管线快照
管线布局中药物为当前组织机构及其子机构作为药物机构进行统计,早期临床1期并入临床1期,临床1/2期并入临床2期,临床2/3期并入临床3期
药物发现
2
7
临床前
其他
7
登录后查看更多信息
当前项目
| 药物(靶点) | 适应症 | 全球最高研发状态 |
|---|---|---|
HPV16 L1E7 CVLP ( HPV E7 ) | 宫颈上皮内瘤样病变 更多 | 临床前 |
AGU661 ( PGES ) | 疼痛 更多 | 临床前 |
BRP-187 ( 5-LOX x FLAP ) | 哮喘 更多 | 临床前 |
Garcinoic Acid ( NLRP3 ) | 炎症 更多 | 临床前 |
BRP-201 ( FLAP ) | 炎症 更多 | 临床前 |
登录后查看更多信息
药物交易
使用我们的药物交易数据加速您的研究。
登录
或
转化医学
使用我们的转化医学数据加速您的研究。
登录
或
营收
使用 Synapse 探索超过 36 万个组织的财务状况。
登录
或
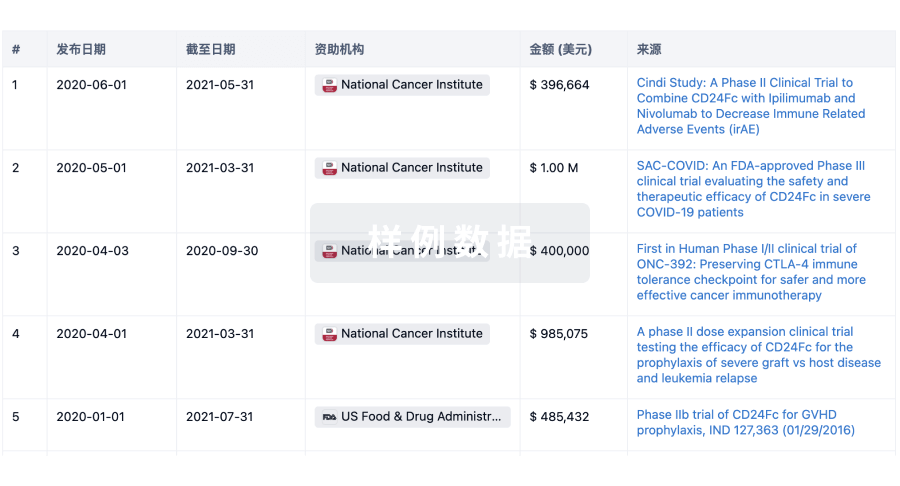
科研基金(NIH)
访问超过 200 万项资助和基金信息,以提升您的研究之旅。
登录
或
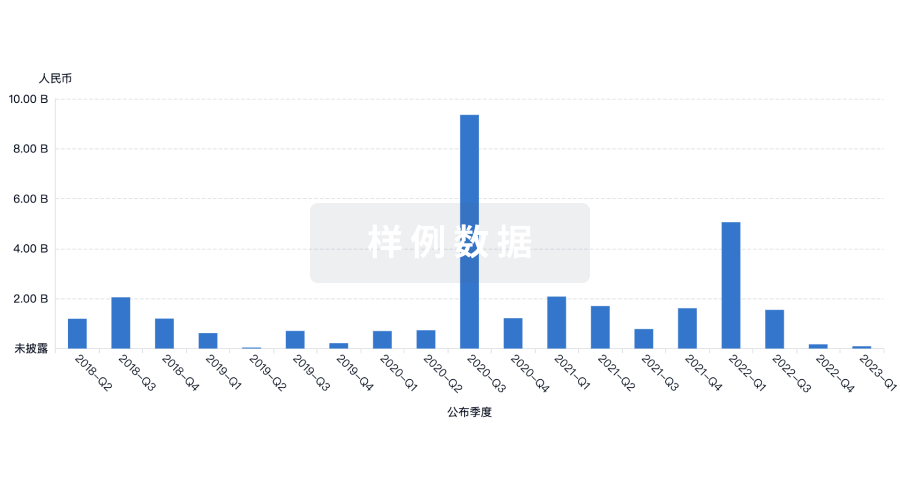
投资
深入了解从初创企业到成熟企业的最新公司投资动态。
登录
或
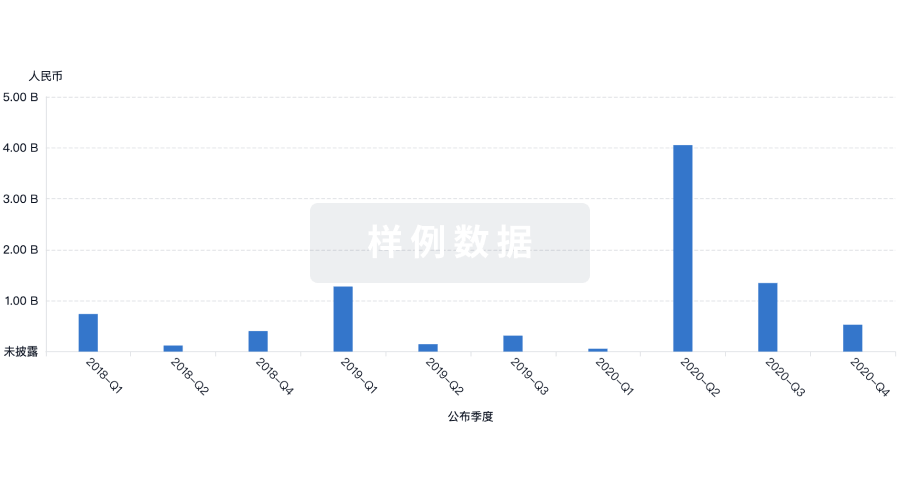
融资
发掘融资趋势以验证和推进您的投资机会。
登录
或
生物医药百科问答
全新生物医药AI Agent 覆盖科研全链路,让突破性发现快人一步
立即开始免费试用!
智慧芽新药情报库是智慧芽专为生命科学人士构建的基于AI的创新药情报平台,助您全方位提升您的研发与决策效率。
立即开始数据试用!
智慧芽新药库数据也通过智慧芽数据服务平台,以API或者数据包形式对外开放,助您更加充分利用智慧芽新药情报信息。
生物序列数据库
生物药研发创新
免费使用
化学结构数据库
小分子化药研发创新
免费使用

