预约演示
Breast Cancer Liquid Biopsy Testing Devices Market Size to Grow by USD 730.4 Mn, CTCs and Circulating Nucleic Acids to be Largest Revenue-generating Type Segment - Technavio
2022-11-08
NEW YORK, Nov. 8, 2022 /PRNewswire/ -- The breast cancer liquid biopsy testing devices market share growth by the
CTCs and circulating nucleic acids segment will be significant during the forecast period. Healthcare professionals use CTCs and circulating nucleic acids for different types of cancer, including breast, prostate, lung, and colorectal cancers. The growth of this segment is driven by factors such as increasing chances of an accurate snapshot of the genomic landscape, easy identification of cancer, and the increasing need to identify mutations causing metastases.
Continue Reading
Preview
来源: PRNewswire
Technavio has announced its latest market research report titled Global Breast Cancer Liquid Biopsy Testing Devices Market 2022-2026
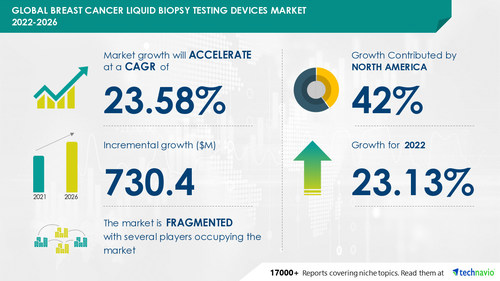
The breast cancer liquid biopsy testing devices market size is expected to grow by USD 730.4 million from 2021 to 2026. In addition, the growth momentum of the market will accelerate at a CAGR of 23.58% during the forecast period, according to Technavio. The report offers an up-to-date analysis of the market, and to know the exact growth variance and the Y-O-Y growth rate,
Request a FREE Sample Report.
Breast Cancer Liquid Biopsy Testing Devices Market 2022-2026: Scope
The report on the breast cancer liquid biopsy testing devices market covers the following areas:
Breast Cancer Liquid Biopsy Testing Devices Market size
Breast Cancer Liquid Biopsy Testing Devices Market trends
Breast Cancer Liquid Biopsy Testing Devices Market industry analysis
This study identifies technological advances as one of the prime reasons driving the breast cancer liquid biopsy testing devices market growth during the next few years. However, factors such as the high costs that are associated with liquid biopsy testing may challenge the market growth.
Subscribe to our "Basic Plan" billed annually at USD 5000 that enables you to download 5 reports and view 100 reports per month
Breast Cancer Liquid Biopsy Testing Devices Market 2022-2026: Segmentation
Type
CTCs and Circulating Nucleic Acids
Extracellular Vesicles
Geography
North America
Europe
Asia
Rest Of World (ROW)
Learn about the contribution of each segment summarized in concise infographics and thorough descriptions. View a FREE PDF Sample Report
Breast Cancer Liquid Biopsy Testing Devices Market 2022-2026: Vendor Analysis
We provide a detailed analysis of around 25 vendors operating in the breast cancer liquid biopsy testing devices market, including Agena Bioscience Inc., A. Menarini Industrie Farmaceutiche Riunite Srl, Exact Sciences Corp., Bio Rad Laboratories Inc., Fluxion Biosciences Inc., F. Hoffmann La Roche Ltd., Illumina Inc., Guardant Health Inc., Myriad Genetics Inc., Isogen Life Science BV, NeoGenomics Laboratories Inc., Natera Inc., OncoDNA SA, Novogene Corp., QIAGEN NV, Pfizer Inc., Sysmex Corp., SAGA Diagnostics AB, and Thermo Fisher Scientific Inc., among others, are some of the major market participants.
This report provides a full list of key vendors, their strategies, and latest developments. Buy Now for detailed vendor information
Breast Cancer Liquid Biopsy Testing Devices Market 2022-2026: Key Highlights
CAGR of the market during 2022-2026
Detailed information on factors that will help the breast cancer liquid biopsy testing devices market grow during the next five years
Approximation of the breast cancer liquid biopsy testing devices market size and its contribution to the parent market
Forecasts on upcoming trends and changes in consumer behavior
The growth of the global breast cancer liquid biopsy testing devices market
Analysis of the competitive landscape and detailed information on vendors
Comprehensive details of factors that will impede the growth of the breast cancer liquid biopsy testing devices market vendors
Related Reports
Breast Imaging Technologies Market by Type and Geography - Forecast and Analysis 2022-2026: The growing focus on courses and medical exhibitions for breast imaging products is a trend in the market. For instance, WORLD CLASS CME released a course on Breast Ultrasound with Tom Stavros in 2019. The objective of this course is to make the target audience understand the anatomic and histopathologic basis for ultrasound appearances, among others.
Breast Tissue Expander Market by Product and Geography - Forecast and Analysis 2022-2026: Technological advances are a trend in the market. The emergence of NGS in liquid biopsy procedures for breast tumors has led to a significant reduction in the cost of the procedures and improved their accuracy. For instance, in December 2020, Biocept, Inc. announced results from a prospective study that showed Target Selector was highly accurate in monitoring HER2 alterations in patients with metastatic breast cancer.
Browse Health Care Market Reports
Table Of Contents
1 Executive Summary
1.1 Market overview
Exhibit 01: Executive Summary – Chart on Market Overview
Exhibit 02: Executive Summary – Data Table on Market Overview
Exhibit 03: Executive Summary – Chart on Global Market Characteristics
Exhibit 04: Executive Summary – Chart on Market by Geography
Exhibit 05: Executive Summary – Chart on Market Segmentation by Type
Exhibit 06: Executive Summary – Chart on Incremental Growth
Exhibit 07: Executive Summary – Data Table on Incremental Growth
Exhibit 08: Executive Summary – Chart on Vendor Market Positioning
2 Market Landscape
2.1 Market ecosystem
Exhibit 09: Parent market
Exhibit 10: Market Characteristics
3 Market Sizing
3.1 Market definition
Exhibit 11: Offerings of vendors included in the market definition
3.2 Market segment analysis
Exhibit 12: Market segments
3.3 Market size 2021
3.4 Market outlook: Forecast for 2021-2026
Exhibit 13: Chart on Global - Market size and forecast 2021-2026 ($ million)
Exhibit 14: Data Table on Global - Market size and forecast 2021-2026 ($ million)
Exhibit 15: Chart on Global Market: Year-over-year growth 2021-2026 (%)
Exhibit 16: Data Table on Global Market: Year-over-year growth 2021-2026 (%)
4 Five Forces Analysis
4.1 Five forces summary
Exhibit 17: Five forces analysis - Comparison between 2021 and 2026
4.2 Bargaining power of buyers
Exhibit 18: Chart on Bargaining power of buyers – Impact of key factors 2021 and 2026
4.3 Bargaining power of suppliers
Exhibit 19: Bargaining power of suppliers – Impact of key factors in 2021 and 2026
4.4 Threat of new entrants
Exhibit 20: Threat of new entrants – Impact of key factors in 2021 and 2026
4.5 Threat of substitutes
Exhibit 21: Threat of substitutes – Impact of key factors in 2021 and 2026
4.6 Threat of rivalry
Exhibit 22: Threat of rivalry – Impact of key factors in 2021 and 2026
4.7 Market condition
Exhibit 23: Chart on Market condition - Five forces 2021 and 2026
5 Market Segmentation by Type
5.1 Market segments
Exhibit 24: Chart on Type - Market share 2021-2026 (%)
Exhibit 25: Data Table on Type - Market share 2021-2026 (%)
5.2 Comparison by Type
Exhibit 26: Chart on Comparison by Type
Exhibit 27: Data Table on Comparison by Type
5.3 CTCs and circulating nucleic acids - Market size and forecast 2021-2026
Exhibit 28: Chart on CTCs and circulating nucleic acids - Market size and forecast 2021-2026 ($ million)
Exhibit 29: Data Table on CTCs and circulating nucleic acids - Market size and forecast 2021-2026 ($ million)
Exhibit 30: Chart on CTCs and circulating nucleic acids - Year-over-year growth 2021-2026 (%)
Exhibit 31: Data Table on CTCs and circulating nucleic acids - Year-over-year growth 2021-2026 (%)
5.4 Extracellular vesicles - Market size and forecast 2021-2026
Exhibit 32: Chart on Extracellular vesicles - Market size and forecast 2021-2026 ($ million)
Exhibit 33: Data Table on Extracellular vesicles - Market size and forecast 2021-2026 ($ million)
Exhibit 34: Chart on Extracellular vesicles - Year-over-year growth 2021-2026 (%)
Exhibit 35: Data Table on Extracellular vesicles - Year-over-year growth 2021-2026 (%)
5.5 Market opportunity by Type
Exhibit 36: Market opportunity by Type ($ million)
6 Customer Landscape
6.1 Customer landscape overview
Exhibit 37: Analysis of price sensitivity, lifecycle, customer purchase basket, adoption rates, and purchase criteria
7 Geographic Landscape
7.1 Geographic segmentation
Exhibit 38: Chart on Market share by geography 2021-2026 (%)
Exhibit 39: Data Table on Market share by geography 2021-2026 (%)
7.2 Geographic comparison
Exhibit 40: Chart on Geographic comparison
Exhibit 41: Data Table on Geographic comparison
7.3 North America - Market size and forecast 2021-2026
Exhibit 42: Chart on North America - Market size and forecast 2021-2026 ($ million)
Exhibit 43: Data Table on North America - Market size and forecast 2021-2026 ($ million)
Exhibit 44: Chart on North America - Year-over-year growth 2021-2026 (%)
Exhibit 45: Data Table on North America - Year-over-year growth 2021-2026 (%)
7.4 Europe - Market size and forecast 2021-2026
Exhibit 46: Chart on Europe - Market size and forecast 2021-2026 ($ million)
Exhibit 47: Data Table on Europe - Market size and forecast 2021-2026 ($ million)
Exhibit 48: Chart on Europe - Year-over-year growth 2021-2026 (%)
Exhibit 49: Data Table on Europe - Year-over-year growth 2021-2026 (%)
7.5 Asia - Market size and forecast 2021-2026
Exhibit 50: Chart on Asia - Market size and forecast 2021-2026 ($ million)
Exhibit 51: Data Table on Asia - Market size and forecast 2021-2026 ($ million)
Exhibit 52: Chart on Asia - Year-over-year growth 2021-2026 (%)
Exhibit 53: Data Table on Asia - Year-over-year growth 2021-2026 (%)
7.6 Rest of World (ROW) - Market size and forecast 2021-2026
Exhibit 54: Chart on Rest of World (ROW) - Market size and forecast 2021-2026 ($ million)
Exhibit 55: Data Table on Rest of World (ROW) - Market size and forecast 2021-2026 ($ million)
Exhibit 56: Chart on Rest of World (ROW) - Year-over-year growth 2021-2026 (%)
Exhibit 57: Data Table on Rest of World (ROW) - Year-over-year growth 2021-2026 (%)
7.7 US - Market size and forecast 2021-2026
Exhibit 58: Chart on US - Market size and forecast 2021-2026 ($ million)
Exhibit 59: Data Table on US - Market size and forecast 2021-2026 ($ million)
Exhibit 60: Chart on US - Year-over-year growth 2021-2026 (%)
Exhibit 61: Data Table on US - Year-over-year growth 2021-2026 (%)
7.8 Germany - Market size and forecast 2021-2026
Exhibit 62: Chart on Germany - Market size and forecast 2021-2026 ($ million)
Exhibit 63: Data Table on Germany - Market size and forecast 2021-2026 ($ million)
Exhibit 64: Chart on Germany - Year-over-year growth 2021-2026 (%)
Exhibit 65: Data Table on Germany - Year-over-year growth 2021-2026 (%)
7.9 Canada - Market size and forecast 2021-2026
Exhibit 66: Chart on Canada - Market size and forecast 2021-2026 ($ million)
Exhibit 67: Data Table on Canada - Market size and forecast 2021-2026 ($ million)
Exhibit 68: Chart on Canada - Year-over-year growth 2021-2026 (%)
Exhibit 69: Data Table on Canada - Year-over-year growth 2021-2026 (%)
7.10 China - Market size and forecast 2021-2026
Exhibit 70: Chart on China - Market size and forecast 2021-2026 ($ million)
Exhibit 71: Data Table on China - Market size and forecast 2021-2026 ($ million)
Exhibit 72: Chart on China - Year-over-year growth 2021-2026 (%)
Exhibit 73: Data Table on China - Year-over-year growth 2021-2026 (%)
7.11 France - Market size and forecast 2021-2026
Exhibit 74: Chart on France - Market size and forecast 2021-2026 ($ million)
Exhibit 75: Data Table on France - Market size and forecast 2021-2026 ($ million)
Exhibit 76: Chart on France - Year-over-year growth 2021-2026 (%)
Exhibit 77: Data Table on France - Year-over-year growth 2021-2026 (%)
7.12 UK - Market size and forecast 2021-2026
Exhibit 78: Chart on UK - Market size and forecast 2021-2026 ($ million)
Exhibit 79: Data Table on UK - Market size and forecast 2021-2026 ($ million)
Exhibit 80: Chart on UK - Year-over-year growth 2021-2026 (%)
Exhibit 81: Data Table on UK - Year-over-year growth 2021-2026 (%)
7.13 Market opportunity by geography
Exhibit 82: Market opportunity by geography ($ million)
8 Drivers, Challenges, and Trends
8.1 Market drivers
8.2 Market challenges
8.3 Impact of drivers and challenges
Exhibit 83: Impact of drivers and challenges in 2021 and 2026
8.4 Market trends
9 Vendor Landscape
9.1 Overview
9.2 Vendor landscape
Exhibit 84: Overview on Criticality of inputs and Factors of differentiation
9.3 Landscape disruption
Exhibit 85: Overview on factors of disruption
9.4 Industry risks
Exhibit 86: Impact of key risks on business
10 Vendor Analysis
10.1 Vendors covered
Exhibit 87: Vendors covered
10.2 Market positioning of vendors
Exhibit 88: Matrix on vendor position and classification
10.3 A. Menarini Industrie Farmaceutiche Riunite Srl
Exhibit 89: A. Menarini Industrie Farmaceutiche Riunite Srl - Overview
Exhibit 90: A. Menarini Industrie Farmaceutiche Riunite Srl - Product / Service
Exhibit 91: A. Menarini Industrie Farmaceutiche Riunite Srl - Key offerings
10.4 Exact Sciences Corp.
Exhibit 92: Exact Sciences Corp. - Overview
Exhibit 93: Exact Sciences Corp. - Product / Service
Exhibit 94: Exact Sciences Corp. - Key offerings
Exhibit 95: F. Hoffmann La Roche Ltd. - Overview
Exhibit 96: F. Hoffmann La Roche Ltd. - Business segments
Exhibit 97: F. Hoffmann La Roche Ltd. - Key news
Exhibit 98: F. Hoffmann La Roche Ltd. - Key offerings
Exhibit 99: F. Hoffmann La Roche Ltd. - Segment focus
10.6 Illumina Inc.
Exhibit 100: Illumina Inc. - Overview
Exhibit 101: Illumina Inc. - Business segments
Exhibit 102: Illumina Inc. - Key news
Exhibit 103: Illumina Inc. - Key offerings
Exhibit 104: Illumina Inc. - Segment focus
Exhibit 105: Isogen Life Science BV - Overview
Exhibit 106: Isogen Life Science BV - Product / Service
Exhibit 107: Isogen Life Science BV - Key offerings
10.8 Myriad Genetics Inc.
Exhibit 108: Myriad Genetics Inc. - Overview
Exhibit 109: Myriad Genetics Inc. - Product / Service
Exhibit 110: Myriad Genetics Inc. - Key offerings
10.9 Natera Inc.
Exhibit 111: Natera Inc. - Overview
Exhibit 112: Natera Inc. - Product / Service
Exhibit 113: Natera Inc. - Key offerings
10.10 Novogene Corp.
Exhibit 114: Novogene Corp. - Overview
Exhibit 115: Novogene Corp. - Product / Service
Exhibit 116: Novogene Corp. - Key offerings
10.11 QIAGEN NV
Exhibit 117: QIAGEN NV - Overview
Exhibit 118: QIAGEN NV - Product / Service
Exhibit 119: QIAGEN NV - Key news
Exhibit 120: QIAGEN NV - Key offerings
Exhibit 121: Thermo Fisher Scientific Inc. - Overview
Exhibit 122: Thermo Fisher Scientific Inc. - Business segments
Exhibit 123: Thermo Fisher Scientific Inc. - Key news
Exhibit 124: Thermo Fisher Scientific Inc. - Key offerings
Exhibit 125: Thermo Fisher Scientific Inc. - Segment focus
11 Appendix
11.1 Scope of the report
11.2 Inclusions and exclusions checklist
Exhibit 126: Inclusions checklist
Exhibit 127: Exclusions checklist
11.3 Currency conversion rates for US$
Exhibit 128: Currency conversion rates for US$
11.4 Research methodology
Exhibit 129: Research methodology
Exhibit 130: Validation techniques employed for market sizing
Exhibit 131: Information sources
11.5 List of abbreviations
Exhibit 132: List of abbreviations
About Us
Technavio is a leading global technology research and advisory company. Their research and analysis focus on emerging market trends and provide actionable insights to help businesses identify market opportunities and develop effective strategies to optimize their market positions. With over 500 specialized analysts, Technavio's report library consists of more than 17,000 reports and counting, covering 800 technologies, spanning across 50 countries. Their client base consists of enterprises of all sizes, including more than 100 Fortune 500 companies. This growing client base relies on Technavio's comprehensive coverage, extensive research, and actionable market insights to identify opportunities in existing and potential markets and assess their competitive positions within changing market scenarios.
Contact
Technavio Research
Jesse Maida
Media & Marketing Executive
US: +1 844 364 1100
UK: +44 203 893 3200
Email: [email protected]
Website: www.technavio.com/
SOURCE Technavio
更多内容,请访问原始网站
文中所述内容并不反映新药情报库及其所属公司任何意见及观点,如有版权侵扰或错误之处,请及时联系我们,我们会在24小时内配合处理。

靶点
药物
-生物医药百科问答
全新生物医药AI Agent 覆盖科研全链路,让突破性发现快人一步


立即开始免费试用!
智慧芽新药情报库是智慧芽专为生命科学人士构建的基于AI的创新药情报平台,助您全方位提升您的研发与决策效率。
立即开始数据试用!
智慧芽新药库数据也通过智慧芽数据服务平台,以API或者数据包形式对外开放,助您更加充分利用智慧芽新药情报信息。