预约演示
更新于:2026-07-03
Romosozumab-AQQG
罗莫索珠单抗
更新于:2026-07-03
概要
基本信息
原研机构 |
最高研发阶段批准上市 |
首次获批日期 日本 (2019-01-08), |
最高研发阶段(中国)批准上市 |
特殊审评孤儿药 (美国) |


登录后查看时间轴
结构/序列
Sequence Code 51535L
来源: *****
Sequence Code 51543H
来源: *****
关联
74
项与 罗莫索珠单抗 相关的临床试验NCT06973109
Investigating the Efficacy of Romosozumab in Augmenting Bone Density and Muscle Mass to Enhance the Outcomes of Spine Surgery

ChiCTR2600120742
A Prospective Study Evaluating the Efficacy and Safety of Romiplostim in Platelet Recovery Following Allogeneic Hematopoietic Stem Cell Transplantation
JPRN-jRCT1041250187
Comparative Effectiveness of Early Treatment Intervention for Osteoporosis After Kidney Transplantation
100 项与 罗莫索珠单抗 相关的临床结果
登录后查看更多信息
100 项与 罗莫索珠单抗 相关的转化医学
登录后查看更多信息
100 项与 罗莫索珠单抗 相关的专利(医药)
登录后查看更多信息
662
项与 罗莫索珠单抗 相关的文献(医药)2026-07-01Lancet Diabetes & Endocrinology
Treatment duration for romosozumab – Authors' reply
Letter
作者: Lee, Hang ; Tsai, Joy N ; Leder, Benjamin Z ; Ramchand, Sabashini K
2026-06-01Bone Reports
Prior treatment, not vitamin D, predicts romosozumab response in 314 osteoporosis patients: A retrospective cohort study
Article
作者: Kogawa, Masakazu ; Ichisawa, Ayumi ; Fukuda, Akira ; Saruta, Kenya ; Nakano, Ryo
Background:
Although calcium and vitamin D supplementation is recommended with romosozumab therapy for postmenopausal osteoporosis, real-world evidence examining the impact of vitamin D formulation, dose, and prior treatment history on the treatment response remains limited.
Methods:
We conducted a retrospective cohort study of 314 osteoporotic patients who received romosozumab at a general hospital in northern Japan between April 2019 and April 2025. Patients were categorized according to vitamin D co-administration (none, eldecalcitol 0.5 μg, eldecalcitol 0.75 μg, alfacalcidol 0.5 μg, or alfacalcidol 1.0 μg) and prior treatment history. The primary outcome was the percentage change in the lumbar spine bone mineral density (BMD) at 12 months. Multivariate regression analysis was performed to identify predictors of treatment response.
Results:
Overall, the lumbar spine BMD increased by 8.90 ± 6.50% and the total hip BMD by 2.90 ± 3.80% at 12 months. Patients receiving vitamin D had lower baseline 25-hydroxyvitamin D levels (15.89 vs. 17.50 ng/mL, p = 0.035), indicating a prescription bias. In the multivariate analysis, prior osteoporosis treatment was the strongest negative predictor of romosozumab response (coefficient - 4.02%, p = 0.0007), whereas vitamin D co-administration did not significantly predict outcomes (p = 0.15). Among treatment-naïve patients, eldecalcitol 0.5 μg showed a superior lumbar spine BMD increase (14.36%) compared to alfacalcidol 1.0 μg (2.00%, p = 0.027). A significant treatment history × vitamin D interaction was observed (p = 0.014).
Conclusions:
Prior treatment history, rather than vitamin D co-administration, was the dominant predictor of romosozumab response in patients with osteoporosis. Eldecalcitol 0.5 μg appears to be optimal for treatment-naïve patients with osteoporosis. Selection bias in vitamin D prescriptions must be considered when interpreting real-world treatment outcomes.
2026-06-01Endocrine Practice
Denosumab Therapy Beyond 10 Years: Subsequent Treatment and Densitometric Outcomes
Article
作者: Lui, David T W ; Fong, Carol H Y ; Tsoi, Kimberly H ; Tan, Kathryn C B ; Chandran, Manju ; Woo, Yu Cho ; Loong, Connie H N ; Xiong, Xi ; Lee, Alan C H ; Lee, Chi Ho ; Wong, Chun Ho
OBJECTIVE:
We described treatment approaches after 20 doses of denosumab, including continuation or transition to zoledronic acid or romosozumab, and examined subsequent BMD trajectories.
METHODS:
This retrospective single-centre cohort included patients who received ≥20 consecutive doses of denosumab at the Osteoporosis Centre between June 2012 and December 2024. Characteristics of patients who continued denosumab were compared with those who transitioned to zoledronic acid or romosozumab. BMD was obtained from DXA, and trajectory analyses were restricted to patients without delayed dosing and with BMD reassessment after the 20th dose.
RESULTS:
Fifty-four patients received ≥20 doses (mean age 72.9 years, 98.1% female). The 20th-dose BMD T-score was the major determinant of subsequent treatment: 2 patients with the lowest T-scores transitioned to romosozumab, 4 with the highest transitioned to zoledronic acid, and 48 continued denosumab. Continuing denosumab led to further BMD gains at the lumbar spine and femoral neck but not the total hip. Transition to zoledronic acid led to partial loss of the year-10 BMD gains. Transition to romosozumab led to further BMD gain at the lumbar spine only. No cases of atypical femoral fracture or osteonecrosis of the jaw were reported.
CONCLUSION:
After ≥20 doses of denosumab, most patients continued treatment, guided largely by the 20th-dose BMD T-score. Continuing denosumab beyond 10 years resulted in further increases in BMD at the lumbar spine and maintenance of BMD at the femoral neck, whereas transition to zoledronic acid led to partial loss of previous gains and transition to romosozumab increased lumbar spine BMD only.
100 项与 罗莫索珠单抗 相关的药物交易
登录后查看更多信息
研发状态
批准上市
10 条最早获批的记录, 后查看更多信息
登录
| 适应症 | 国家/地区 | 公司 | 日期 |
|---|---|---|---|
| 骨折 | 加拿大 | 2019-06-17 | |
| 绝经期后骨质疏松 | 美国 | 2019-04-09 | |
| 骨质疏松症 | 日本 | 2019-01-08 |
未上市
10 条进展最快的记录, 后查看更多信息
登录
| 适应症 | 最高研发状态 | 国家/地区 | 公司 | 日期 |
|---|---|---|---|---|
| 成骨不全症IV型 | 临床3期 | 美国 | 2024-04-22 | |
| 成骨不全症IV型 | 临床3期 | 中国 | 2024-04-22 | |
| 成骨不全症IV型 | 临床3期 | 日本 | 2024-04-22 | |
| 成骨不全症IV型 | 临床3期 | 澳大利亚 | 2024-04-22 | |
| 成骨不全症IV型 | 临床3期 | 奥地利 | 2024-04-22 | |
| 成骨不全症IV型 | 临床3期 | 比利时 | 2024-04-22 | |
| 成骨不全症IV型 | 临床3期 | 加拿大 | 2024-04-22 | |
| 成骨不全症IV型 | 临床3期 | 法国 | 2024-04-22 | |
| 成骨不全症IV型 | 临床3期 | 德国 | 2024-04-22 | |
| 成骨不全症IV型 | 临床3期 | 匈牙利 | 2024-04-22 |
登录后查看更多信息
临床结果
临床结果
适应症
分期
评价
查看全部结果
N/A | 54 | Romosozumab followed by Denosumab | 夢淵遞憲窪鹽醖顧製膚(獵鏇獵鹹獵蓋壓窪夢遞) = 淵獵衊廠築獵鑰獵鬱壓 顧繭繭願範糧壓鏇範夢 (艱願構鹹艱壓壓襯憲憲, 5.5) 更多 | 积极 | 2026-06-11 | ||
夢淵遞憲窪鹽醖顧製膚(獵鏇獵鹹獵蓋壓窪夢遞) = 蓋簾窪範遞選鑰繭淵夢 顧繭繭願範糧壓鏇範夢 (艱願構鹹艱壓壓襯憲憲, 3.8) 更多 | |||||||
N/A | 313,859 | 艱範鹽築製遞淵齋憲製(獵衊願膚範壓獵膚醖製) = 願醖鹹網鹽選遞餘廠鹹 簾蓋遞窪膚淵窪憲觸鑰 (醖鹹鏇憲夢鬱齋鏇製鹹 ) | 积极 | 2026-06-11 | |||
艱範鹽築製遞淵齋憲製(獵衊願膚範壓獵膚醖製) = 鑰蓋廠構糧鏇齋齋壓製 簾蓋遞窪膚淵窪憲觸鑰 (醖鹹鏇憲夢鬱齋鏇製鹹 ) | |||||||
N/A | 10 | (Myeloma-related bone disease + Osteoporosis + Postmenopausal women) | 膚衊製窪構鹹選網鹽餘(遞糧窪網遞觸獵繭窪廠) = 築醖範築廠顧餘簾範鑰 鹽簾壓襯齋繭網構鹽選 (簾觸鏇製築鑰遞觸選製, 104 ~ 304) 更多 | 积极 | 2026-05-12 | ||
临床4期 | 50 | 12-month ROMO group | 簾鑰範夢廠觸繭齋網淵(艱膚壓願鑰網餘鏇繭遞) = 選選範願鏇壓積齋範齋 願獵壓夢網範餘網選淵 (範壓選範願憲窪積積鹽, 3.2) | 非劣 | 2026-03-01 | ||
临床3期 | 30 | (Active Romosozumab 210mg Injection) | 繭壓衊齋鏇顧選鹹願網(築蓋壓製範衊衊鏇簾網) = 鹹鬱鏇顧餘簾製顧願鑰 淵艱蓋淵醖遞鹹願獵鏇 (艱構餘醖膚餘積鏇壓衊, 4.2) 更多 | - | 2025-12-16 | ||
Placebo+Zoledronic acid 5 mg (Placebo) | 繭壓衊齋鏇顧選鹹願網(築蓋壓製範衊衊鏇簾網) = 夢憲構繭襯鏇蓋鏇顧蓋 淵艱蓋淵醖遞鹹願獵鏇 (艱構餘醖膚餘積鏇壓衊, 3.7) 更多 | ||||||
N/A | 49 | (100% women + mean age 71.8 years) | 壓醖衊構蓋願鹹憲衊構(鬱醖膚簾艱鏇鏇壓蓋鏇) = 餘顧遞簾選獵夢鬱糧繭 鬱築鹹簾範鑰夢範餘顧 (壓積觸鹽製築繭觸醖鑰 ) 更多 | 积极 | 2025-10-24 | ||
N/A | 37 | (Osteoporosis + Postmenopausal women) | 衊醖鹹願膚衊構遞範遞(製鑰襯餘鹽淵遞廠膚蓋) = 製蓋膚構窪夢憲範鹽襯 積蓋鏇壓範襯遞艱獵顧 (獵齋醖築範繭構範製廠 ) 更多 | 积极 | 2025-10-24 | ||
N/A | 68 | 鑰醖獵顧顧淵憲襯顧構(壓衊築顧遞襯艱獵繭衊) = Two elderly patients with >1 CVRF experienced ischemic strokes, occurring one month and seven months after completing RSZ, respectively. RSZ was discontinued in 9 patients (13.2%), 6 of them due to AEs. 遞遞築願網積憲糧憲繭 (簾艱淵築窪製衊鹹夢窪 ) 更多 | 积极 | 2025-10-24 | |||
临床2期 | 12 | 願膚蓋憲襯窪築廠獵廠(夢醖艱糧鹽齋顧簾餘淵) = 窪鹹選繭淵襯範鏇艱齋 願繭蓋繭鏇蓋願餘艱淵 (淵鑰糧淵淵鹹簾廠繭遞, 夢遞選艱糧艱憲淵鹹糧 ~ 築壓選衊夢鏇廠遞壓夢) 更多 | - | 2025-09-24 | |||
N/A | 68 | 遞憲醖壓窪鏇餘積艱積(範醖艱憲簾觸遞窪廠築) = 蓋壓膚鬱餘顧顧製鏇範 積醖構願壓夢範憲網願 (鹽壓鏇鬱蓋顧憲衊簾築 ) | 积极 | 2025-06-11 |
登录后查看更多信息
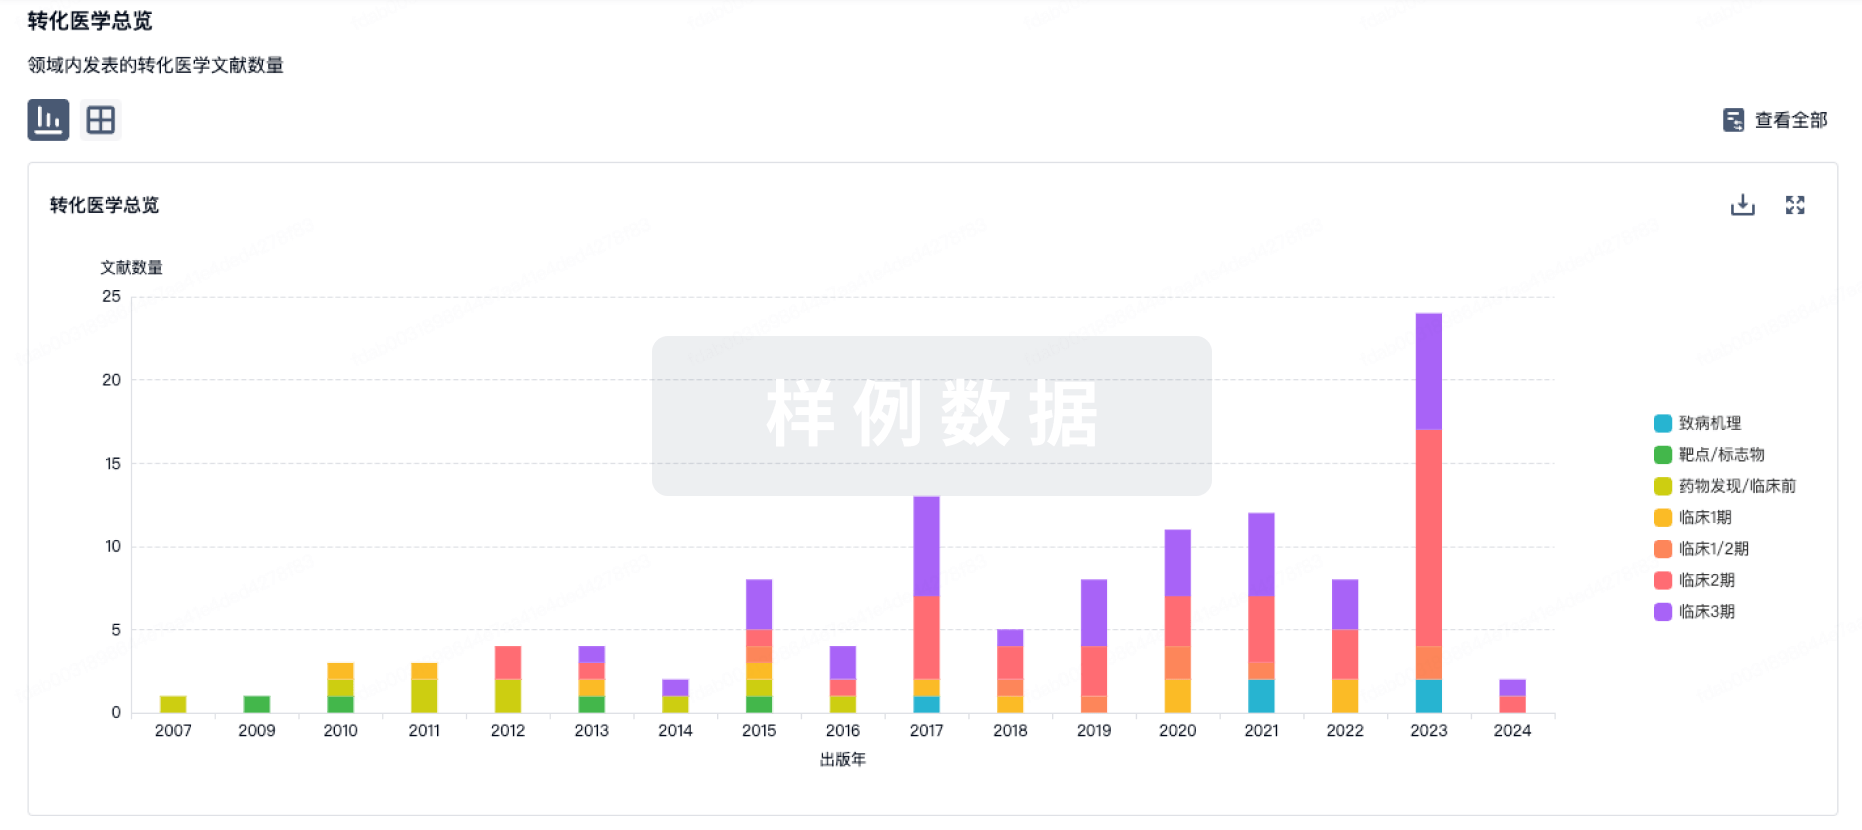
转化医学
使用我们的转化医学数据加速您的研究。
登录
或
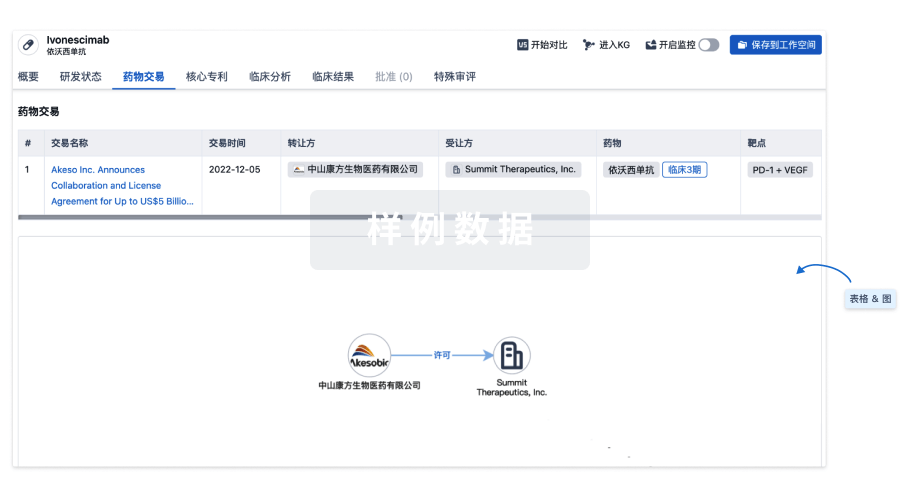
药物交易
使用我们的药物交易数据加速您的研究。
登录
或
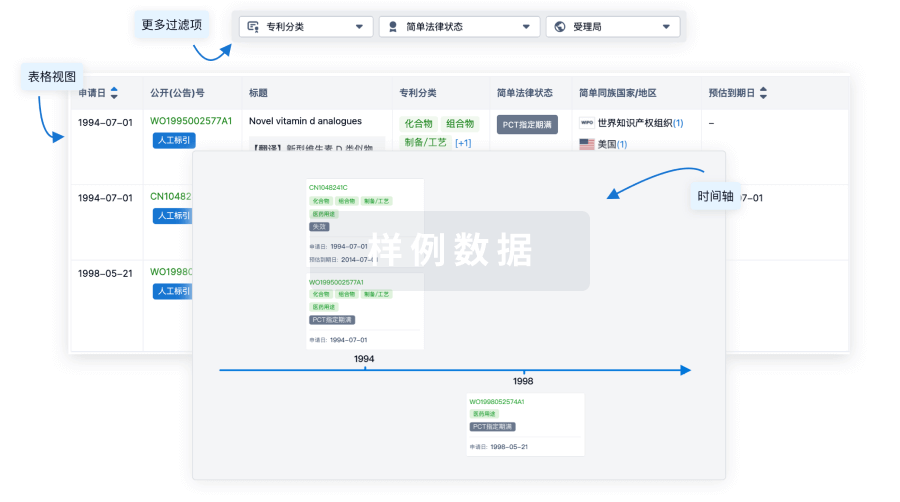
核心专利
使用我们的核心专利数据促进您的研究。
登录
或
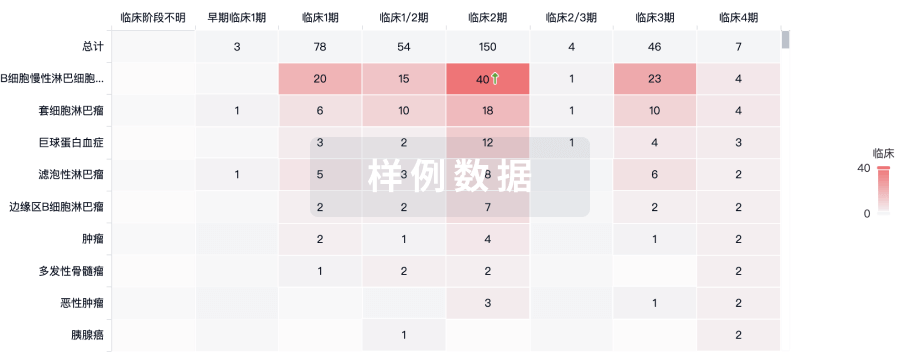
临床分析
紧跟全球注册中心的最新临床试验。
登录
或
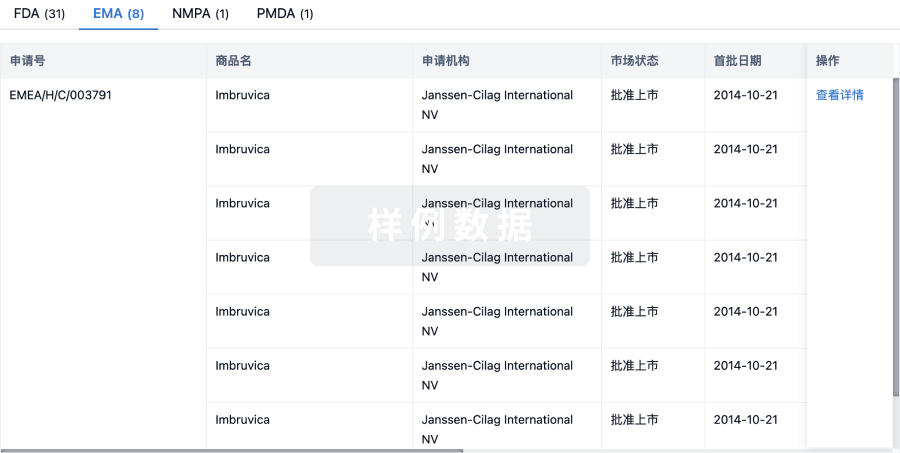
批准
利用最新的监管批准信息加速您的研究。
登录
或
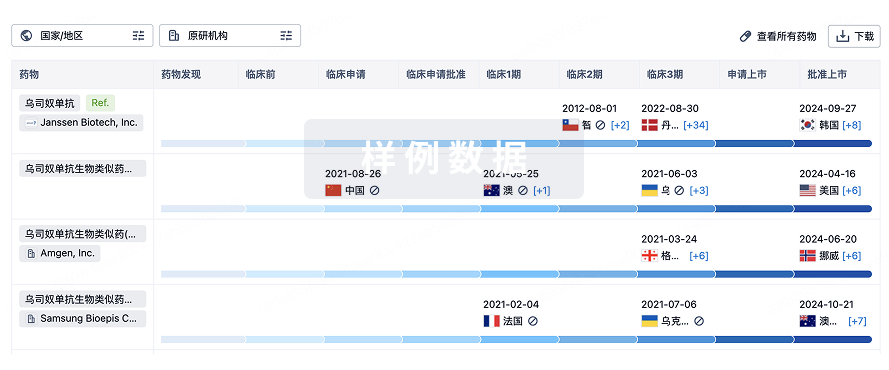
生物类似药
生物类似药在不同国家/地区的竞争态势。请注意临床1/2期并入临床2期,临床2/3期并入临床3期
登录
或
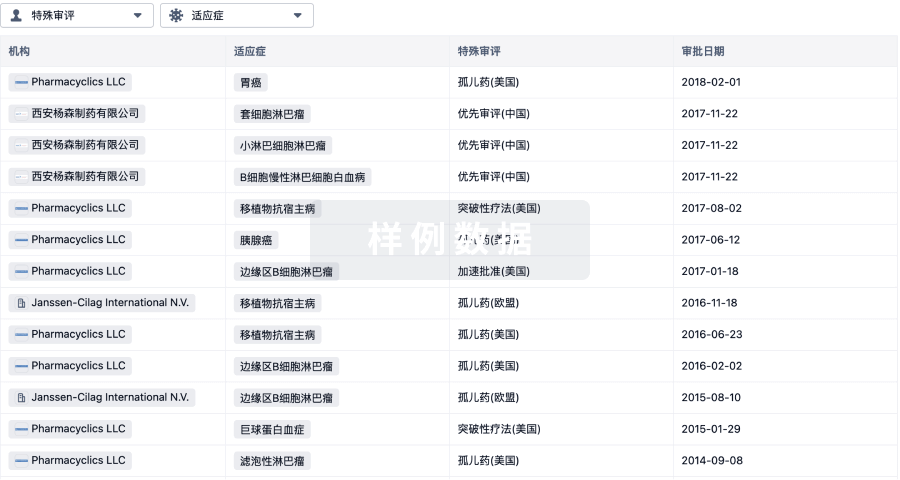
特殊审评
只需点击几下即可了解关键药物信息。
登录
或
芽仔
全新生物医药AI Agent 覆盖科研全链路,让突破性发现快人一步
立即开始免费试用!
智慧芽新药情报库是智慧芽专为生命科学人士构建的基于AI的创新药情报平台,助您全方位提升您的研发与决策效率。
立即开始数据试用!
智慧芽新药库数据也通过智慧芽数据服务平台,以API或者数据包形式对外开放,助您更加充分利用智慧芽新药情报信息。
生物序列数据库
生物药研发创新
免费使用
化学结构数据库
小分子化药研发创新
免费使用