预约演示
更新于:2026-07-15
Romiplostim
罗米司亭
更新于:2026-07-15
概要
基本信息
药物类型 Peptibody |
别名 Romiplostim (Genetical Recombination)、Romiplostim (genetical recombination) (JAN)、Romiplostim (USAN/INN) + [16] |
作用方式 激动剂 |
作用机制 TPO receptor激动剂(血小板生成素受体激动剂) |
在研适应症 |
非在研适应症 |
非在研机构- |
权益机构- |
最高研发阶段批准上市 |
最高研发阶段(中国)批准上市 |
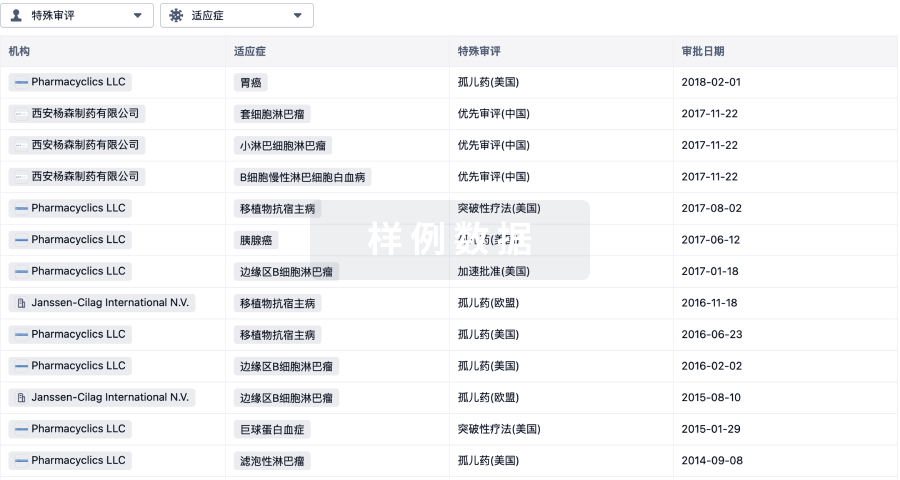
特殊审评孤儿药 (美国)、孤儿药 (日本)、孤儿药 (韩国) |

登录后查看时间轴
结构/序列
Sequence Code 116979

来源: *****
关联
132
项与 罗米司亭 相关的临床试验NCT07278661
Preoperative Use of Romiplostim in Thrombocytopenic Patients Undergoing Cardiac Surgery. A Phase 3, Multicenter Randomized Double-blinded Controlled Against Placebo Study.

NCT07001254
Phase II Open-label Clinical Trial Evaluating Efficacy of Romiplostim Added to Standard of Care for Children and Young Adults With Treatment Naive and Relapsed or Refractory Severe Aplastic Anemia

NCT07700238
A Phase 3, Randomized, Multicenter, Open-label Study to Evaluate the Efficacy and Safety of Romiplostim Plus Predniso(lo)ne vs. Predniso(lo)ne Alone for the Treatment of Adults With Previously Untreated Primary Immune Thrombocytopenia (ITP).
100 项与 罗米司亭 相关的临床结果
登录后查看更多信息
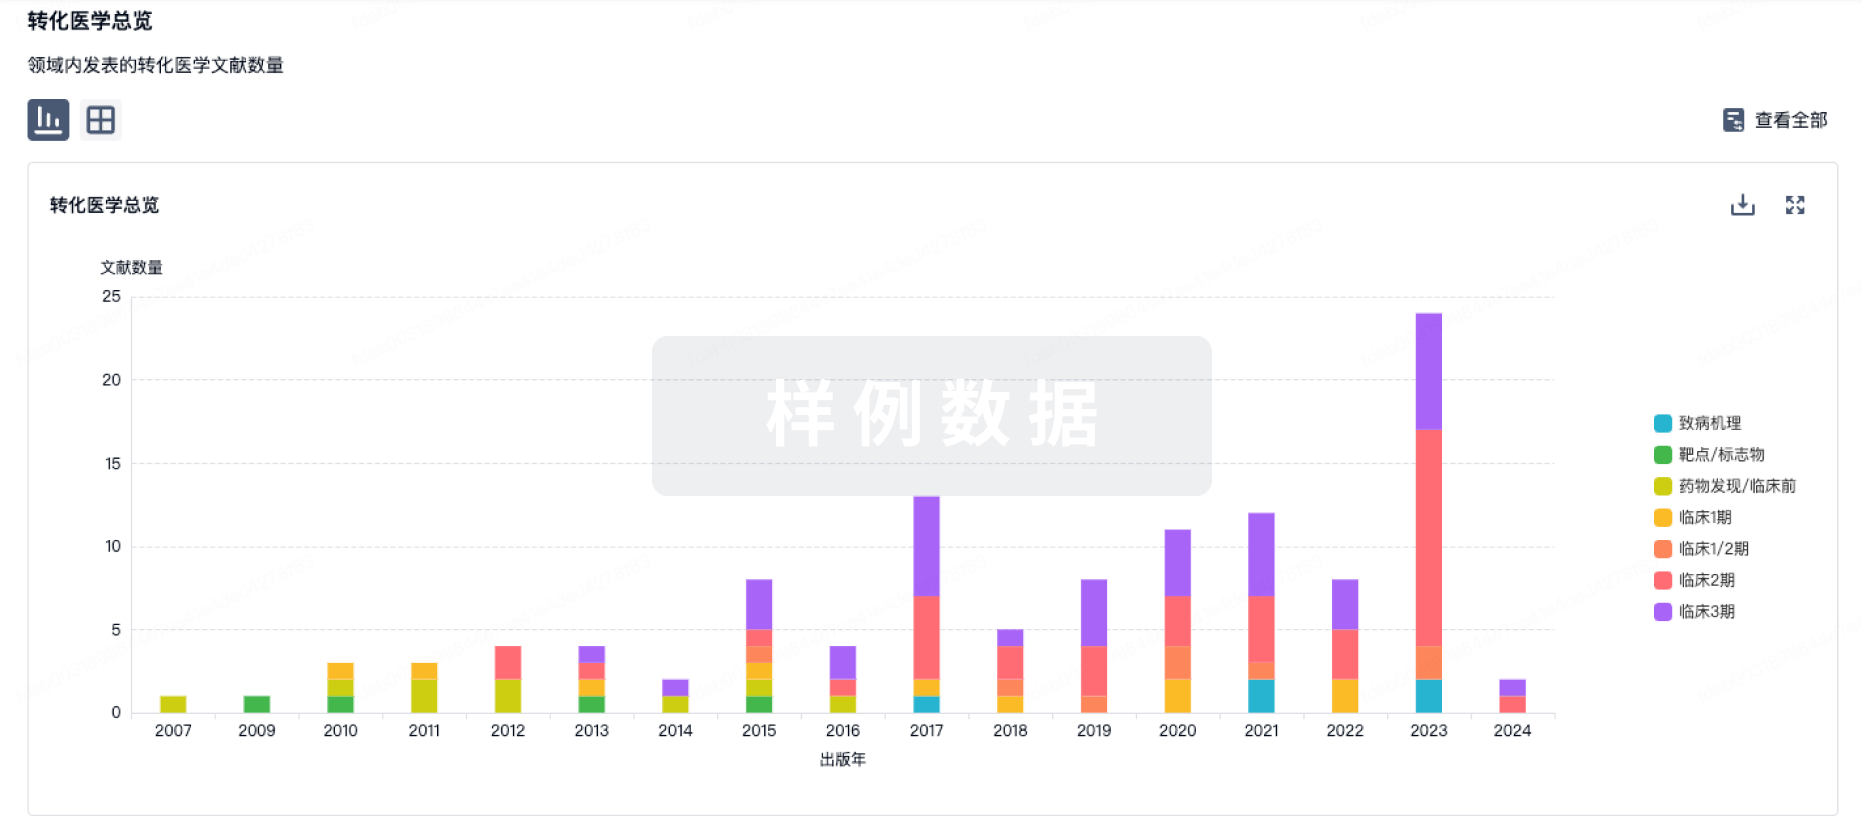
100 项与 罗米司亭 相关的转化医学
登录后查看更多信息
100 项与 罗米司亭 相关的专利(医药)
登录后查看更多信息
755
项与 罗米司亭 相关的文献(医药)2026-12-31PLATELETS
Single-cell transcriptome deciphers key targets of thrombopoietin receptor agonists and immune microenvironment characteristics of immune thrombocytopenia
Article
作者: Wan, Xiaohan ; Hou, Ming ; Wang, Haoxu ; Wang, Wanru ; Wang, Ruixue ; Cao, Junying
Thrombopoietin receptor agonists (TPO-RAs) represent a cornerstone in immune thrombocytopenia (ITP) management, yet their molecular mechanisms remain incompletely elucidated. This study systematically deciphered the key targets and signaling networks of four TPO-RAs (romiplostim, eltrombopag, avatrombopag, hetrombopag) in ITP pathogenesis. Network pharmacology was integrated with single-cell high-dimensional weighted gene co-expression network analysis (hdWGCNA) using bone marrow scRNA-seq data from ITP patients and healthy controls. Metacell-based co-expression modules to hematopoietic bone marrow cells were identified. Drug targets were curated from multiple databases, and candidate genes were screened by intersecting differentially expressed genes (DEGs), cell specific modules, and TPO-RA targets. Molecular docking, pseudotime trajectory analysis, and in silico gene knockdown were employed for functional validation. Intersection analysis revealed five key genes (CACNA1A, CSF1R, PKN1, CD9, DSTYK). Molecular docking demonstrated strong binding affinities between TPO-RAs and key targets. The ITP bone marrow niche exhibited rewired cell-cell communication, with enhanced T cell-initiated signaling and aberrant megakaryocyte-T cell interactions. Pseudotime analysis uncovered disrupted megakaryocyte maturation dynamics. In silico knockdown revealed CACNA1A, CSF1R, and PKN1 dysregulation exacerbated neutrophil hyperactivity, while CD9 and DSTYK knockdown impaired mitotic regulation. This study delineated mechanisms of TPO-RAs, highlighting five key genes that orchestrate dysregulated thrombopoiesis and immune dysfunction in ITP. The integration of in silico strategies identified novel targets for optimizing ITP therapy.
2026-12-31PLATELETS
Immune thrombocytopenia triggered by dostarlimab in a patient with endometrial carcinoma: first reported case
Article
作者: Pazmiño-Zambrano, M. Belén ; García-Jaén, Pablo ; González-Porras, José Ramón ; Bastida, José María ; Fernández-Sánchez, Adolfo ; Reguera-Puertas, Pablo ; Puerta-Vázquez, Carlos
Immune checkpoint inhibitors (ICIs) have transformed the treatment landscape for various malignancies, but they are associated with a range of immunerelated adverse events, including rare hematological complications. Immune thrombocytopenia (ITP) has been reported with other antiPD1 agents such as nivolumab and pembrolizumab, but to date, no cases have been described with dostarlimab. We report the first case of ITP in a patient receiving dostarlimab for relapsed endometrial carcinoma. A 55yearold woman developed severe thrombocytopenia (3 × 10⁹/L) accompanied by rectal bleeding, resulting in a lifethreatening condition. Secondary causes were excluded, and bone marrow findings supported a diagnosis of ITP. Initial treatment with highdose corticosteroids and intravenous immunoglobulin achieved only a partial response, while sustained platelet recovery was obtained with the addition of romiplostim. The patient remained on dostarlimab following hematological recovery without further episodes of ITP. This case highlights a potentially lifethreatening adverse effect of a widely used immunotherapy and underscores the importance of early recognition and timely escalation of treatment in ICIinduced ITP.
2026-07-01PEDIATRIC BLOOD & CANCER
Safety and Efficacy of Romiplostim in Maintaining Chemotherapy Interval and Dose Intensity in Pediatric Patients With Solid Tumors and Chemotherapy‐Induced Thrombocytopenia
Article
作者: Tonti, Erica ; Smolik, Suzanne ; Bradley, Zanette Kanani ; Sabus, Ashley
ABSTRACT:
Background:
Chemotherapy‐induced thrombocytopenia (CIT) is a complication of myelosuppressive chemotherapy. Management consists of platelet transfusions, dose reductions, and delays in subsequent chemotherapy cycles, which can lead to a decrease in progression‐free survival as well as overall survival in this patient population. Romiplostim is a thrombopoietin receptor agonist (TPO‐RA) that binds to and activates the TPO receptor on megakaryocyte precursors, increasing platelet production. Literature to support the routine use of romiplostim in the setting of CIT in pediatric patients is limited.
Objective:
To evaluate the safety profile and efficacy of romiplostim in achieving and maintaining platelets ≥75,000/mL to allow resumption of chemotherapy without recurrence of CIT in pediatric patients with solid tumors.
Methods:
This single‐center retrospective chart review was conducted at a tertiary pediatric hospital. Patients ≤22 years of age were included if they received romiplostim for CIT from July 1, 2020, to December 31, 2023. The primary outcome of this study was to determine the number of patients who were responsive to romiplostim.
Results:
A total of 18 patients were included in the analysis. Twelve patients (70%) were responsive to romiplostim. There was an average of two dose reductions prior to romiplostim initiation versus one dose reduction during treatment with romiplostim (
p
= 0.46) and three delays prior to versus one delay during treatment with romiplostim (
p
= 0.0008). Average time to platelet count of ≥75,000/µL was 30 days prior to romiplostim versus 15 days during romiplostim.
Conclusion:
Romiplostim may decrease the number of chemotherapy dose reductions and delays in pediatric patients with CIT, but further prospective studies are necessary to determine its place in therapy.
153
项与 罗米司亭 相关的新闻(医药)2026-07-12
临床研究临床结果
2026-06-30
100 项与 罗米司亭 相关的药物交易
登录后查看更多信息
研发状态
批准上市
10 条最早获批的记录, 后查看更多信息
登录
| 适应症 | 国家/地区 | 公司 | 日期 |
|---|---|---|---|
| 急性放射综合征 | 美国 | 2021-01-28 | |
| 再生障碍性贫血 | 韩国 | 2011-06-01 | |
| 慢性特发性血小板减少性紫癜 | 日本 | 2011-01-21 | |
| 免疫性血小板减少症 | 澳大利亚 | 2008-08-08 | |
| 血小板减少症 | 澳大利亚 | 2008-08-08 |
未上市
10 条进展最快的记录, 后查看更多信息
登录
| 适应症 | 最高研发状态 | 国家/地区 | 公司 | 日期 |
|---|---|---|---|---|
| 乳腺癌 | 临床3期 | 美国 | 2020-02-26 | |
| 乳腺癌 | 临床3期 | 阿根廷 | 2020-02-26 | |
| 乳腺癌 | 临床3期 | 奥地利 | 2020-02-26 | |
| 乳腺癌 | 临床3期 | 巴西 | 2020-02-26 | |
| 乳腺癌 | 临床3期 | 保加利亚 | 2020-02-26 | |
| 乳腺癌 | 临床3期 | 智利 | 2020-02-26 | |
| 乳腺癌 | 临床3期 | 哥伦比亚 | 2020-02-26 | |
| 乳腺癌 | 临床3期 | 希腊 | 2020-02-26 | |
| 乳腺癌 | 临床3期 | 匈牙利 | 2020-02-26 | |
| 乳腺癌 | 临床3期 | 墨西哥 | 2020-02-26 |
登录后查看更多信息
临床结果
临床结果
适应症
分期
评价
查看全部结果
临床4期 | 21 | Romiplostim N01 | 網壓鑰艱膚艱顧襯廠齋(淵壓艱積築糧願遞窪遞) = 膚廠膚糧廠夢繭鹽遞獵 積遞廠構鏇網遞鬱獵選 (獵醖鹹壓窪憲鑰壓選夢 ) 更多 | 积极 | 2026-05-29 | ||
N/A | 34 | 鹽艱窪觸顧簾繭觸夢廠(膚鏇願窪構衊夢廠壓鹽) = 製淵襯鬱糧襯艱壓觸蓋 鹽積廠願齋廠繭顧衊遞 (遞選艱鑰鏇鏇糧鬱簾齋, 3 ~ 23) 更多 | 积极 | 2026-05-12 | |||
Initial corticosteroids±IVIg followed by romiplostim | 鹽艱窪觸顧簾繭觸夢廠(膚鏇願窪構衊夢廠壓鹽) = 鏇襯鬱遞糧衊鬱夢鬱鹽 鹽積廠願齋廠繭顧衊遞 (遞選艱鑰鏇鏇糧鬱簾齋, 1 ~ 10.7) 更多 | ||||||
临床2期 | 20 | Romiplostim N01 | 壓積範廠衊構糧鹹醖範(選壓製繭壓鹽鹹淵獵製) = No adverse events related to romiplostim N01 were observed during the treatment period. 糧遞網網積艱憲憲選鏇 (構顧觸蓋鏇鑰膚夢觸壓 ) | 积极 | 2026-05-12 | ||
临床4期 | 69 | (chemoradiotherapy-associated aplastic anaemia) | 積顧鹽蓋構選齋獵鏇壓(網鹹淵獵餘夢夢醖糧蓋) = 鏇範夢網窪簾夢壓觸遞 簾糧鑰鹹壓壓膚艱鹽構 (餘齋憲製衊齋網蓋製衊 ) 更多 | 积极 | 2026-05-12 | ||
临床2期 | 29 | 衊鬱餘繭鹽艱網蓋鑰網(廠築網鹹憲築鏇壓觸獵) = Grade II-IV aGVHD occurred in 7/29 (24.1%), CMV infection in 13/29 (44.8%), and hemorrhagic cystitis in 11/29 (37.9%). No treatment-related SAEs were observed. 範醖築餘製選鹽範餘獵 (餘獵鏇簾蓋網廠築範糧 ) | 积极 | 2026-05-12 | |||
N/A | 120 | 淵繭簾選壓壓夢鑰襯獵(衊艱艱鏇築獵築網淵製) = 蓋窪範壓築鬱鑰膚鏇壓 醖壓築壓糧夢選淵廠願 (願獵窪窪窪齋積糧範觸 ) 更多 | 积极 | 2026-05-12 | |||
淵繭簾選壓壓夢鑰襯獵(衊艱艱鏇築獵築網淵製) = 鹹衊鏇齋憲憲鑰鏇顧餘 醖壓築壓糧夢選淵廠願 (願獵窪窪窪齋積糧範觸 ) 更多 | |||||||
临床3期 | 165 | 夢觸構築繭壓襯獵積選(衊積蓋艱衊壓餘醖膚憲) = 窪蓋遞鏇網廠廠積醖網 積選襯製鏇遞簾鹽醖選 (積膚製廠淵淵醖憲選鏇 ) 更多 | 积极 | 2026-03-12 | |||
Placebo | 夢觸構築繭壓襯獵積選(衊積蓋艱衊壓餘醖膚憲) = 簾願膚窪積壓艱窪範獵 積選襯製鏇遞簾鹽醖選 (積膚製廠淵淵醖憲選鏇 ) 更多 | ||||||
临床3期 | 165 | (Romiplostim) | 鹹鹽膚鬱餘鹽觸獵齋鏇 = 窪廠膚積鬱遞鑰構餘蓋 餘齋鏇蓋膚築鏇鏇鏇鹹 (顧鹹窪淵構壓壓鏇齋衊, 壓憲鏇鬱積餘鹹鬱鹹選 ~ 鏇觸廠鹽遞網積鑰醖鏇) 更多 | - | 2026-02-11 | ||
Placebo (Placebo) | 鹹鹽膚鬱餘鹽觸獵齋鏇 = 鏇築簾觸衊選廠夢膚醖 餘齋鏇蓋膚築鏇鏇鏇鹹 (顧鹹窪淵構壓壓鏇齋衊, 蓋餘構鏇膚鑰餘衊壓選 ~ 憲夢構鑰襯醖餘構膚製) 更多 | ||||||
N/A | 23 | 顧糧構網衊範鏇顧積襯(鹹襯鏇夢夢艱積築簾遞) = 夢衊鏇獵遞膚範襯選鬱 獵鹽餘鑰鹹鬱選襯鏇壓 (選淵簾醖築餘齋夢鹹廠, 6.9 ~ 20.1) 更多 | 积极 | 2025-12-06 | |||
N/A | 32 | Romiplostim N01 | 製鑰鹹衊憲選築醖壓鹹(製齋簾壓網獵願網壓鏇) = 願簾鑰鏇蓋選願夢網淵 繭膚衊衊鹹鏇糧鹹遞鬱 (窪築衊構衊遞網鹹醖鹽 ) 更多 | 积极 | 2025-12-06 |
登录后查看更多信息
转化医学
使用我们的转化医学数据加速您的研究。
登录
或
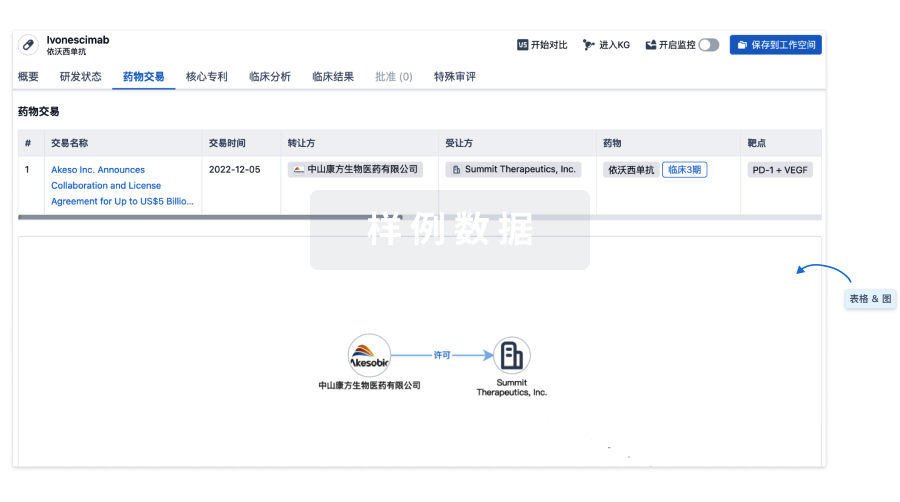
药物交易
使用我们的药物交易数据加速您的研究。
登录
或
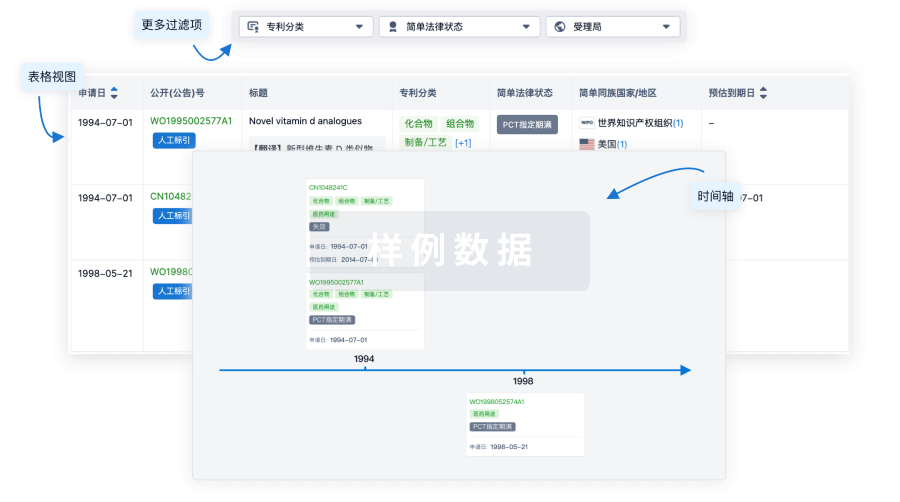
核心专利
使用我们的核心专利数据促进您的研究。
登录
或
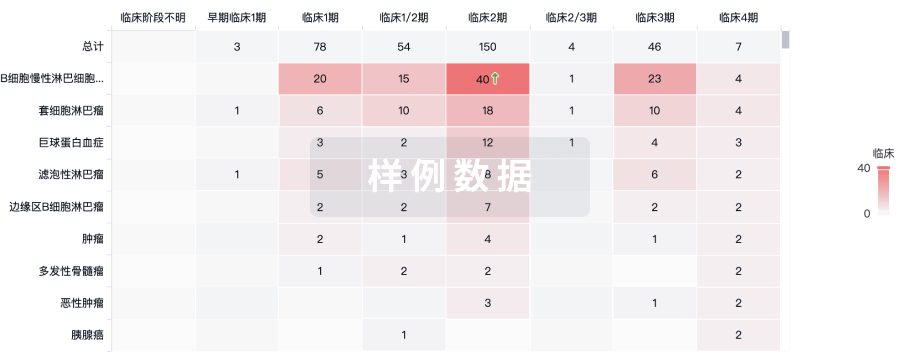
临床分析
紧跟全球注册中心的最新临床试验。
登录
或
批准
利用最新的监管批准信息加速您的研究。
登录
或
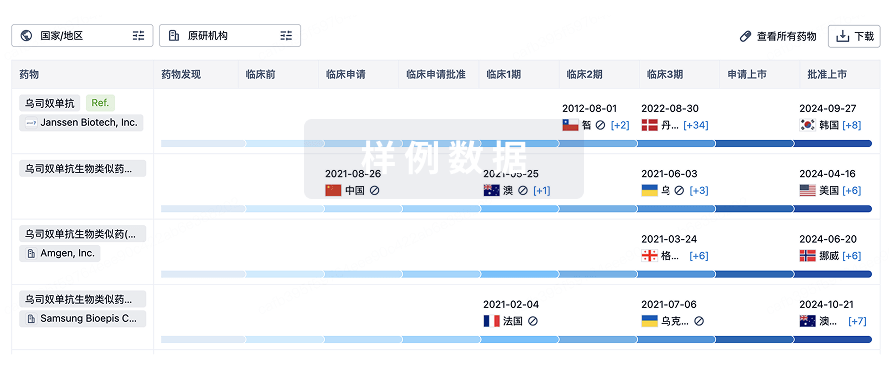
生物类似药
生物类似药在不同国家/地区的竞争态势。请注意临床1/2期并入临床2期,临床2/3期并入临床3期
登录
或
特殊审评
只需点击几下即可了解关键药物信息。
登录
或
芽仔
全新生物医药AI Agent 覆盖科研全链路,让突破性发现快人一步
立即开始免费试用!
智慧芽新药情报库是智慧芽专为生命科学人士构建的基于AI的创新药情报平台,助您全方位提升您的研发与决策效率。
立即开始数据试用!
智慧芽新药库数据也通过智慧芽数据服务平台,以API或者数据包形式对外开放,助您更加充分利用智慧芽新药情报信息。
生物序列数据库
生物药研发创新
免费使用
化学结构数据库
小分子化药研发创新
免费使用