预约演示
Testosterone Replacement Therapy Market to Record a CAGR of 3.1%, Rise in Novel Therapeutic Approaches to be a Key Trend - Technavio
2022-09-26
仿制药
NEW YORK, Sept. 26, 2022 /PRNewswire/ -- One of the key trends in the testosterone replacement therapy market is the
rise in novel therapeutic approaches. Metabolic syndrome can result in testosterone deficiency. It can be treated with anti-inflammatory drugs, which are also used to treat testosterone deficiency. The advent of new therapeutic approaches is leading to frequent market changes. Vendors are focusing on developing alternative treatment options. Thus, the growing focus of vendors on therapeutic approaches is expected to lead to the entry of new products in the global testosterone replacement therapy market, which will drive market growth.
Continue Reading
Preview
来源: PRNewswire
Technavio has announced its latest market research report titled Global Testosterone Replacement Therapy Market 2022-2026
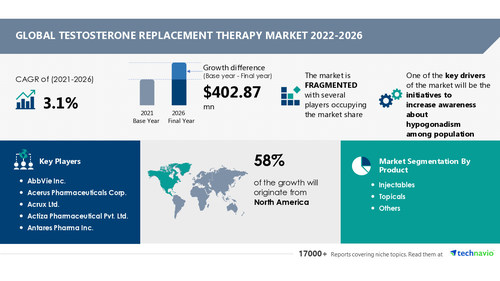
The testosterone replacement therapy market size is expected to grow by USD 402.87 million from 2021 to 2026. In addition, the growth momentum of the market will accelerate at a CAGR of 3.1% during the forecast period, according to Technavio.
Get a comprehensive report summary describing the market size and forecast along with research methodology. The FREE sample report is available in PDF format
The initiatives to raise awareness about hypogonadism among the population are driving the growth of the testosterone replacement therapy market. However, factors such as the availability of generics may challenge market growth.
Testosterone Replacement Therapy Market: Product Landscape
By product, the market has been segmented into injectables, topicals, and others. The
injectables segment will be the largest contributor to market growth during the forecast period. This growth is attributed to factors such as the prevalence of testosterone deficiency. Some of the major conditions that have been identified as risk factors for testosterone deficiency include diabetes, obesity, metabolic syndrome, and dyslipidemia. Therefore, the rise in the prevalence of testosterone deficiency is expected to accelerate the growth of the global testosterone replacement therapy market during the forecast period.
Testosterone Replacement Therapy Market: Geographic Landscape
By geography, the market has been segmented into North America, Europe, Asia, and the Rest of the World (ROW).
North America is expected to have lucrative growth during the forecast period. About 58% of the market's overall growth is expected to originate from the region. The US and Canada are the key countries for the testosterone replacement therapy market in North America. The growth of the region is attributed to factors such as the rising number of cases of hypogonadism and raising awareness about the treatment of testosterone deficiency and erectile dysfunction.
Companies Covered
Actiza Pharmaceutical Pvt. Ltd.
This report provides a full list of key vendors, their strategies, and the latest developments. Request a FREE PDF Sample Now
What our reports offer
Market share assessments for the regional and country-level segments
Strategic recommendations for the new entrants
Covers market data for 2022, 2022, until 2026
Market trends (opportunities, drivers, threats, challenges, investment opportunities, and recommendations)
Strategic recommendations in key business segments based on the market estimations
Competitive landscaping highlighting the key common trends
Company profiling with detailed strategies, recent developments, and financials
Supply chain trends recording the latest technological advancements
Related Reports
Sexually Transmitted Diseases (STD) Treatment Market by Service and Geography - Forecast and Analysis 2022-2026: The sexually transmitted diseases (STD) treatment market share is expected to increase by USD 13.48 billion from 2021 to 2026.
Sexual Enhancement Supplements Market by Product and Geography - Forecast and Analysis 2022-2026: The sexual enhancement supplements market share is expected to increase by USD 801.29 million from 2021 to 2026.
Browse Health Care Market Reports
Table of Contents
1 Executive Summary
1.1 Market overview
Exhibit 01: Executive Summary – Chart on Market Overview
Exhibit 02: Executive Summary – Data Table on Market Overview
Exhibit 03: Executive Summary – Chart on Global Market Characteristics
Exhibit 04: Executive Summary – Chart on Market by Geography
Exhibit 05: Executive Summary – Chart on Market Segmentation by Product
Exhibit 06: Executive Summary – Chart on Incremental Growth
Exhibit 07: Executive Summary – Data Table on Incremental Growth
Exhibit 08: Executive Summary – Chart on Vendor Market Positioning
2 Market Landscape
2.1 Market ecosystem
Exhibit 09: Parent market
Exhibit 10: Market Characteristics
3 Market Sizing
3.1 Market definition
Exhibit 11: Offerings of vendors included in the market definition
3.2 Market segment analysis
Exhibit 12: Market segments
3.3 Market size 2021
3.4 Market outlook: Forecast for 2021-2026
Exhibit 13: Chart on Global - Market size and forecast 2021-2026 ($ million)
Exhibit 14: Data Table on Global - Market size and forecast 2021-2026 ($ million)
Exhibit 15: Chart on Global Market: Year-over-year growth 2021-2026 (%)
Exhibit 16: Data Table on Global Market: Year-over-year growth 2021-2026 (%)
4 Five Forces Analysis
4.1 Five forces summary
Exhibit 17: Five forces analysis - Comparison between 2021 and 2026
4.2 Bargaining power of buyers
Exhibit 18: Chart on Bargaining power of buyers – Impact of key factors 2021 and 2026
4.3 Bargaining power of suppliers
Exhibit 19: Bargaining power of suppliers – Impact of key factors in 2021 and 2026
4.4 Threat of new entrants
Exhibit 20: Threat of new entrants – Impact of key factors in 2021 and 2026
4.5 Threat of substitutes
Exhibit 21: Threat of substitutes – Impact of key factors in 2021 and 2026
4.6 Threat of rivalry
Exhibit 22: Threat of rivalry – Impact of key factors in 2021 and 2026
4.7 Market condition
Exhibit 23: Chart on Market condition - Five forces 2021 and 2026
5 Market Segmentation by Product
5.1 Market segments
Exhibit 24: Chart on Product - Market share 2021-2026 (%)
Exhibit 25: Data Table on Product - Market share 2021-2026 (%)
5.2 Comparison by Product
Exhibit 26: Chart on Comparison by Product
Exhibit 27: Data Table on Comparison by Product
5.3 Injectables - Market size and forecast 2021-2026
Exhibit 28: Chart on Injectables - Market size and forecast 2021-2026 ($ million)
Exhibit 29: Data Table on Injectables - Market size and forecast 2021-2026 ($ million)
Exhibit 30: Chart on Injectables - Year-over-year growth 2021-2026 (%)
Exhibit 31: Data Table on Injectables - Year-over-year growth 2021-2026 (%)
5.4 Topicals - Market size and forecast 2021-2026
Exhibit 32: Chart on Topicals - Market size and forecast 2021-2026 ($ million)
Exhibit 33: Data Table on Topicals - Market size and forecast 2021-2026 ($ million)
Exhibit 34: Chart on Topicals - Year-over-year growth 2021-2026 (%)
Exhibit 35: Data Table on Topicals - Year-over-year growth 2021-2026 (%)
5.5 Others - Market size and forecast 2021-2026
Exhibit 36: Chart on Others - Market size and forecast 2021-2026 ($ million)
Exhibit 37: Data Table on Others - Market size and forecast 2021-2026 ($ million)
Exhibit 38: Chart on Others - Year-over-year growth 2021-2026 (%)
Exhibit 39: Data Table on Others - Year-over-year growth 2021-2026 (%)
5.6 Market opportunity by Product
Exhibit 40: Market opportunity by Product ($ million)
6 Customer Landscape
6.1 Customer landscape overview
Exhibit 41: Analysis of price sensitivity, lifecycle, customer purchase basket, adoption rates, and purchase criteria
7 Geographic Landscape
7.1 Geographic segmentation
Exhibit 42: Chart on Market share by geography 2021-2026 (%)
Exhibit 43: Data Table on Market share by geography 2021-2026 (%)
7.2 Geographic comparison
Exhibit 44: Chart on Geographic comparison
Exhibit 45: Data Table on Geographic comparison
7.3 North America - Market size and forecast 2021-2026
Exhibit 46: Chart on North America - Market size and forecast 2021-2026 ($ million)
Exhibit 47: Data Table on North America - Market size and forecast 2021-2026 ($ million)
Exhibit 48: Chart on North America - Year-over-year growth 2021-2026 (%)
Exhibit 49: Data Table on North America - Year-over-year growth 2021-2026 (%)
7.4 Europe - Market size and forecast 2021-2026
Exhibit 50: Chart on Europe - Market size and forecast 2021-2026 ($ million)
Exhibit 51: Data Table on Europe - Market size and forecast 2021-2026 ($ million)
Exhibit 52: Chart on Europe - Year-over-year growth 2021-2026 (%)
Exhibit 53: Data Table on Europe - Year-over-year growth 2021-2026 (%)
7.5 Asia - Market size and forecast 2021-2026
Exhibit 54: Chart on Asia - Market size and forecast 2021-2026 ($ million)
Exhibit 55: Data Table on Asia - Market size and forecast 2021-2026 ($ million)
Exhibit 56: Chart on Asia - Year-over-year growth 2021-2026 (%)
Exhibit 57: Data Table on Asia - Year-over-year growth 2021-2026 (%)
7.6 Rest of World (ROW) - Market size and forecast 2021-2026
Exhibit 58: Chart on Rest of World (ROW) - Market size and forecast 2021-2026 ($ million)
Exhibit 59: Data Table on Rest of World (ROW) - Market size and forecast 2021-2026 ($ million)
Exhibit 60: Chart on Rest of World (ROW) - Year-over-year growth 2021-2026 (%)
Exhibit 61: Data Table on Rest of World (ROW) - Year-over-year growth 2021-2026 (%)
7.7 US - Market size and forecast 2021-2026
Exhibit 62: Chart on US - Market size and forecast 2021-2026 ($ million)
Exhibit 63: Data Table on US - Market size and forecast 2021-2026 ($ million)
Exhibit 64: Chart on US - Year-over-year growth 2021-2026 (%)
Exhibit 65: Data Table on US - Year-over-year growth 2021-2026 (%)
7.8 Canada - Market size and forecast 2021-2026
Exhibit 66: Chart on Canada - Market size and forecast 2021-2026 ($ million)
Exhibit 67: Data Table on Canada - Market size and forecast 2021-2026 ($ million)
Exhibit 68: Chart on Canada - Year-over-year growth 2021-2026 (%)
Exhibit 69: Data Table on Canada - Year-over-year growth 2021-2026 (%)
7.9 Germany - Market size and forecast 2021-2026
Exhibit 70: Chart on Germany - Market size and forecast 2021-2026 ($ million)
Exhibit 71: Data Table on Germany - Market size and forecast 2021-2026 ($ million)
Exhibit 72: Chart on Germany - Year-over-year growth 2021-2026 (%)
Exhibit 73: Data Table on Germany - Year-over-year growth 2021-2026 (%)
7.10 UK - Market size and forecast 2021-2026
Exhibit 74: Chart on UK - Market size and forecast 2021-2026 ($ million)
Exhibit 75: Data Table on UK - Market size and forecast 2021-2026 ($ million)
Exhibit 76: Chart on UK - Year-over-year growth 2021-2026 (%)
Exhibit 77: Data Table on UK - Year-over-year growth 2021-2026 (%)
7.11 China - Market size and forecast 2021-2026
Exhibit 78: Chart on China - Market size and forecast 2021-2026 ($ million)
Exhibit 79: Data Table on China - Market size and forecast 2021-2026 ($ million)
Exhibit 80: Chart on China - Year-over-year growth 2021-2026 (%)
Exhibit 81: Data Table on China - Year-over-year growth 2021-2026 (%)
7.12 Market opportunity by geography
Exhibit 82: Market opportunity by geography ($ million)
8 Drivers, Challenges, and Trends
8.1 Market drivers
8.2 Market challenges
8.3 Impact of drivers and challenges
Exhibit 83: Impact of drivers and challenges in 2021 and 2026
8.4 Market trends
9 Vendor Landscape
9.1 Overview
9.2 Vendor landscape
Exhibit 84: Overview on Criticality of inputs and Factors of differentiation
9.3 Landscape disruption
Exhibit 85: Overview on factors of disruption
9.4 Industry risks
Exhibit 86: Impact of key risks on business
10 Vendor Analysis
10.1 Vendors covered
Exhibit 87: Vendors covered
10.2 Market positioning of vendors
Exhibit 88: Matrix on vendor position and classification
10.3 AbbVie Inc.
Exhibit 89: AbbVie Inc. - Overview
Exhibit 90: AbbVie Inc. - Product / Service
Exhibit 91: AbbVie Inc. - Key offerings
Exhibit 92: Acerus Pharmaceuticals Corp. - Overview
Exhibit 93: Acerus Pharmaceuticals Corp. - Product / Service
Exhibit 94: Acerus Pharmaceuticals Corp. - Key offerings
10.5 Antares Pharma Inc.
Exhibit 95: Antares Pharma Inc. - Overview
Exhibit 96: Antares Pharma Inc. - Product / Service
Exhibit 97: Antares Pharma Inc. - Key news
Exhibit 98: Antares Pharma Inc. - Key offerings
10.6 Bayer AG
Exhibit 99: Bayer AG - Overview
Exhibit 100: Bayer AG - Business segments
Exhibit 101: Bayer AG - Key offerings
Exhibit 102: Bayer AG - Segment focus
Exhibit 103: Clarus Therapeutics Inc. - Overview
Exhibit 104: Clarus Therapeutics Inc. - Product / Service
Exhibit 105: Clarus Therapeutics Inc. - Key offerings
10.8 Eli Lilly and Co.
Exhibit 106: Eli Lilly and Co. - Overview
Exhibit 107: Eli Lilly and Co. - Product / Service
Exhibit 108: Eli Lilly and Co. - Key offerings
10.9 Endo International Plc
Exhibit 109: Endo International Plc - Overview
Exhibit 110: Endo International Plc - Business segments
Exhibit 111: Endo International Plc - Key news
Exhibit 112: Endo International Plc - Key offerings
Exhibit 113: Endo International Plc - Segment focus
10.10 Novartis AG
Exhibit 114: Novartis AG - Overview
Exhibit 115: Novartis AG - Business segments
Exhibit 116: Novartis AG - Key offerings
Exhibit 117: Novartis AG - Segment focus
10.11 Pfizer Inc.
Exhibit 118: Pfizer Inc. - Overview
Exhibit 119: Pfizer Inc. - Product / Service
Exhibit 120: Pfizer Inc. - Key news
Exhibit 121: Pfizer Inc. - Key offerings
10.12 The Simple Pharma Co. UK Ltd.
Exhibit 122: The Simple Pharma Co. UK Ltd. - Overview
Exhibit 123: The Simple Pharma Co. UK Ltd. - Product / Service
Exhibit 124: The Simple Pharma Co. UK Ltd. - Key offerings
11 Appendix
11.1 Scope of the report
11.2 Inclusions and exclusions checklist
Exhibit 125: Inclusions checklist
Exhibit 126: Exclusions checklist
11.3 Currency conversion rates for US$
Exhibit 127: Currency conversion rates for US$
11.4 Research methodology
Exhibit 128: Research methodology
Exhibit 129: Validation techniques employed for market sizing
Exhibit 130: Information sources
11.5 List of abbreviations
Exhibit 131: List of abbreviations
About Us
Technavio is a leading global technology research and advisory company. Their research and analysis focus on emerging market trends and provide actionable insights to help businesses identify market opportunities and develop effective strategies to optimize their market positions. With over 500 specialized analysts, Technavio's report library consists of more than 17,000 reports and counting, covering 800 technologies, spanning across 50 countries. Their client base consists of enterprises of all sizes, including more than 100 Fortune 500 companies. This growing client base relies on Technavio's comprehensive coverage, extensive research, and actionable market insights to identify opportunities in existing and potential markets and assess their competitive positions within changing market scenarios.
Contact
Technavio Research
Jesse Maida
Media & Marketing Executive
US: +1 844 364 1100
UK: +44 203 893 3200
Email: [email protected]
Website: www.technavio.com/
SOURCE Technavio
更多内容,请访问原始网站
文中所述内容并不反映新药情报库及其所属公司任何意见及观点,如有版权侵扰或错误之处,请及时联系我们,我们会在24小时内配合处理。
靶点
-药物
-生物医药百科问答
全新生物医药AI Agent 覆盖科研全链路,让突破性发现快人一步


立即开始免费试用!
智慧芽新药情报库是智慧芽专为生命科学人士构建的基于AI的创新药情报平台,助您全方位提升您的研发与决策效率。
立即开始数据试用!
智慧芽新药库数据也通过智慧芽数据服务平台,以API或者数据包形式对外开放,助您更加充分利用智慧芽新药情报信息。