预约演示
Cytomegalovirus (CMV) Therapeutics Market to grow by USD 332.21 Mn in 2026, Growing Risk Factors For CMV to Boost the Market Growth - Technavio
2022-10-06
NEW YORK, Oct. 6, 2022 /PRNewswire/ -- The
cytomegalovirus (CMV) therapeutics market is expected to grow by
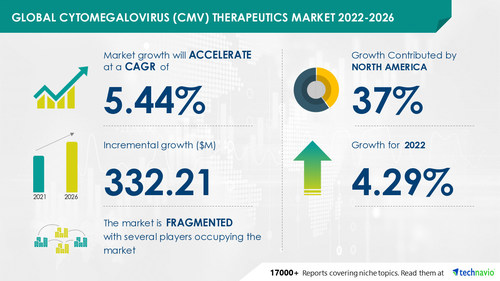
USD 332.21 million during 2021-2026 according to the latest market research report by Technavio. As per Technavio, the reformulation of drugs will have a positive impact on the market and contribute to its growth significantly over the forecast period. This research report also analyzes other significant trends and market drivers that will influence market growth.
Cytomegalovirus (CMV) Therapeutics Market Regional Analysis
Continue Reading
Preview
来源: PRNewswire
Technavio has announced its latest market research report titled Global Cytomegalovirus (CMV) Therapeutics Market 2022-2026
North America will account for 37% of market growth. Cytomegalovirus (CMV) treatments are primarily sold in the US and Canada North America. Compared to the rest of the world, this region's market will increase more quickly (ROW). The cytomegalovirus (CMV) therapeutics market will increase in North America over the forecast period due to the high sales of authorized therapies and the considerable prevalence of various kinds of CMV in nations like the US.
Request Free Sample Report.
Cytomegalovirus (CMV) Therapeutics Market: Segmentation Analysis
Route of administration
Oral
Parenteral
Others
Geography
North America
Europe
Asia
Rest of World (ROW)
The oral sector will significantly increase its market share for cytomegalovirus (CMV) therapies during the anticipated period. In the upcoming years, the presence of F. Hoffmann-La Roche and its cutting-edge medication VALCYTE will fuel market expansion in this niche. The US FDA later granted it marketing permission for the prevention of CMV in patients who have undergone kidney, heart, or kidney-pancreas transplantation after it first gained the necessary approval for the treatment of CMV retinitis in patients with acquired AIDS.
Buy Sample Report.
Market Drivers
The
expanding risk factors for CMV are one of the major reasons boosting the global cytomegalovirus (CMV) treatments market. CMV is more prevalent in populations with inadequate immunity, such as those living with HIV. Although the incidence rate has decreased, there is still a significant unmet market demand because of the high prevalence, which is thought to affect around 37 million people globally, and the paucity of licensed medicines.
The danger of CMV infection is further increased by the rising number of hematopoietic stem cell transplant (HSCT) procedures performed for diverse causes. Another known risk factor for CMV is chemotherapy. During the anticipated period, all of these elements are anticipated to fuel market expansion.
Download Free Sample Report.
Market Trends
Another major market trend for CMV therapies that are anticipated to have a favorable effect on the sector throughout the forecast period is the reformulation of medications. Vendors are creating medications in multiple forms in order to offer treatment options and guarantee the high efficacy of their products.
Cytomegalovirus (CMV) Therapeutics Market Vendors
Fresenius SE and Co. KGaA
Related Reports
Stem Cell Umbilical Cord Blood (UCB) Market by End-user and Geography - Forecast and Analysis 2022-2026
Lennox-Gastaut Syndrome Treatment Market by Type and Geography - Forecast and Analysis 2022-2026
Table of Contents
1 Executive Summary
1.1 Market Overview
Exhibit 01: Executive Summary – Chart on Market Overview
Exhibit 02: Executive Summary – Data Table on Market Overview
Exhibit 03: Executive Summary – Chart on Global Market Characteristics
Exhibit 04: Executive Summary – Chart on Market by Geography
Exhibit 05: Executive Summary – Chart on Market Segmentation by Route of Administration
Exhibit 06: Executive Summary – Chart on Incremental Growth
Exhibit 07: Executive Summary – Data Table on Incremental Growth
Exhibit 08: Executive Summary – Chart on Vendor Market Positioning
2 Market Landscape
2.1 Market ecosystem
Exhibit 09: Parent market
Exhibit 10: Market Characteristics
3 Market Sizing
3.1 Market definition
Exhibit 11: Offerings of vendors included in the market definition
3.2 Market segment analysis
Exhibit 12: Market segments
3.3 Market size 2021
3.4 Market outlook: Forecast for 2021-2026
Exhibit 13: Chart on Global - Market size and forecast 2021-2026 ($ million)
Exhibit 14: Data Table on Global - Market size and forecast 2021-2026 ($ million)
Exhibit 15: Chart on Global Market: Year-over-year growth 2021-2026 (%)
Exhibit 16: Data Table on Global Market: Year-over-year growth 2021-2026 (%)
4 Five Forces Analysis
4.1 Five forces summary
Exhibit 17: Five forces analysis - Comparison between2021 and 2026
4.2 Bargaining power of buyers
Exhibit 18: Chart on Bargaining power of buyers – Impact of key factors 2021 and 2026
4.3 Bargaining power of suppliers
Exhibit 19: Bargaining power of suppliers – Impact of key factors in 2021 and 2026
4.4 Threat of new entrants
Exhibit 20: Threat of new entrants – Impact of key factors in 2021 and 2026
4.5 Threat of substitutes
Exhibit 21: Threat of substitutes – Impact of key factors in 2021 and 2026
4.6 Threat of rivalry
Exhibit 22: Threat of rivalry – Impact of key factors in 2021 and 2026
4.7 Market condition
Exhibit 23: Chart on Market condition - Five forces 2021 and 2026
5 Market Segmentation by Route of Administration
5.1 Market segments
Exhibit 24: Chart on Route of Administration - Market share 2021-2026 (%)
Exhibit 25: Data Table on Route of Administration - Market share 2021-2026 (%)
5.2 Comparison by Route of Administration
Exhibit 26: Chart on Comparison by Route of Administration
Exhibit 27: Data Table on Comparison by Route of Administration
5.3 Oral - Market size and forecast 2021-2026
Exhibit 28: Chart on Oral - Market size and forecast 2021-2026 ($ million)
Exhibit 29: Data Table on Oral - Market size and forecast 2021-2026 ($ million)
Exhibit 30: Chart on Oral - Year-over-year growth 2021-2026 (%)
Exhibit 31: Data Table on Oral - Year-over-year growth 2021-2026 (%)
5.4 Parenteral - Market size and forecast 2021-2026
Exhibit 32: Chart on Parenteral - Market size and forecast 2021-2026 ($ million)
Exhibit 33: Data Table on Parenteral - Market size and forecast 2021-2026 ($ million)
Exhibit 34: Chart on Parenteral - Year-over-year growth 2021-2026 (%)
Exhibit 35: Data Table on Parenteral - Year-over-year growth 2021-2026 (%)
5.5 Others - Market size and forecast 2021-2026
Exhibit 36: Chart on Others - Market size and forecast 2021-2026 ($ million)
Exhibit 37: Data Table on Others - Market size and forecast 2021-2026 ($ million)
Exhibit 38: Chart on Others - Year-over-year growth 2021-2026 (%)
Exhibit 39: Data Table on Others - Year-over-year growth 2021-2026 (%)
5.6 Market opportunity by Route of Administration
Exhibit 40: Market opportunity by Route of Administration ($ million)
6 Customer Landscape
6.1 Customer landscape overview
Exhibit 41: Analysis of price sensitivity, lifecycle, customer purchase basket, adoption rates, and purchase criteria
7 Geographic Landscape
7.1 Geographic segmentation
Exhibit 42: Chart on Market share by geography 2021-2026 (%)
Exhibit 43: Data Table on Market share by geography 2021-2026 (%)
7.2 Geographic comparison
Exhibit 44: Chart on Geographic comparison
Exhibit 45: Data Table on Geographic comparison
7.3 North America - Market size and forecast 2021-2026
Exhibit 46: Chart on North America - Market size and forecast 2021-2026 ($ million)
Exhibit 47: Data Table on North America - Market size and forecast 2021-2026 ($ million)
Exhibit 48: Chart on North America - Year-over-year growth 2021-2026 (%)
Exhibit 49: Data Table on North America - Year-over-year growth 2021-2026 (%)
7.4 Europe - Market size and forecast 2021-2026
Exhibit 50: Chart on Europe - Market size and forecast 2021-2026 ($ million)
Exhibit 51: Data Table on Europe - Market size and forecast 2021-2026 ($ million)
Exhibit 52: Chart on Europe - Year-over-year growth 2021-2026 (%)
Exhibit 53: Data Table on Europe - Year-over-year growth 2021-2026 (%)
7.5 Asia - Market size and forecast 2021-2026
Exhibit 54: Chart on Asia - Market size and forecast 2021-2026 ($ million)
Exhibit 55: Data Table on Asia - Market size and forecast 2021-2026 ($ million)
Exhibit 56: Chart on Asia - Year-over-year growth 2021-2026 (%)
Exhibit 57: Data Table on Asia - Year-over-year growth 2021-2026 (%)
7.6 Rest of World (ROW) - Market size and forecast 2021-2026
Exhibit 58: Chart on Rest of World (ROW) - Market size and forecast 2021-2026 ($ million)
Exhibit 59: Data Table on Rest of World (ROW) - Market size and forecast 2021-2026 ($ million)
Exhibit 60: Chart on Rest of World (ROW) - Year-over-year growth 2021-2026 (%)
Exhibit 61: Data Table on Rest of World (ROW) - Year-over-year growth 2021-2026 (%)
7.7 US - Market size and forecast 2021-2026
Exhibit 62: Chart on US - Market size and forecast 2021-2026 ($ million)
Exhibit 63: Data Table on US - Market size and forecast 2021-2026 ($ million)
Exhibit 64: Chart on US - Year-over-year growth 2021-2026 (%)
Exhibit 65: Data Table on US - Year-over-year growth 2021-2026 (%)
7.8 Denmark - Market size and forecast 2021-2026
Exhibit 66: Chart on Denmark - Market size and forecast 2021-2026 ($ million)
Exhibit 67: Data Table on Denmark - Market size and forecast 2021-2026 ($ million)
Exhibit 68: Chart on Denmark - Year-over-year growth 2021-2026 (%)
Exhibit 69: Data Table on Denmark - Year-over-year growth 2021-2026 (%)
7.9 China - Market size and forecast 2021-2026
Exhibit 70: Chart on China - Market size and forecast 2021-2026 ($ million)
Exhibit 71: Data Table on China - Market size and forecast 2021-2026 ($ million)
Exhibit 72: Chart on China - Year-over-year growth 2021-2026 (%)
Exhibit 73: Data Table on China - Year-over-year growth 2021-2026 (%)
7.10 Canada - Market size and forecast 2021-2026
Exhibit 74: Chart on Canada - Market size and forecast 2021-2026 ($ million)
Exhibit 75: Data Table on Canada - Market size and forecast 2021-2026 ($ million)
Exhibit 76: Chart on Canada - Year-over-year growth 2021-2026 (%)
Exhibit 77: Data Table on Canada - Year-over-year growth 2021-2026 (%)
7.11 India - Market size and forecast 2021-2026
Exhibit 78: Chart on India - Market size and forecast 2021-2026 ($ million)
Exhibit 79: Data Table on India - Market size and forecast 2021-2026 ($ million)
Exhibit 80: Chart on India - Year-over-year growth 2021-2026 (%)
Exhibit 81: Data Table on India - Year-over-year growth 2021-2026 (%)
7.12 Market opportunity by geography
Exhibit 82: Market opportunity by geography ($ million)
8 Drivers, Challenges, and Trends
8.1 Market drivers
8.2 Market challenges
8.3 Impact of drivers and challenges
Exhibit 83: Impact of drivers and challenges in 2021 and 2026
8.4 Market trends
9 Vendor Landscape
9.1 Overview
9.2 Vendor landscape
Exhibit 84: Overview on Criticality of inputs and Factors of differentiation
9.3 Landscape disruption
Exhibit 85: Overview on factors of disruption
9.4 Industry risks
Exhibit 86: Impact of key risks on business
10 Vendor Analysis
10.1 Vendors covered
Exhibit 87: Vendors covered
10.2 Market positioning of vendors
Exhibit 88: Matrix on vendor position and classification
10.3 AstraZeneca Plc
Exhibit 89: AstraZeneca Plc - Overview
Exhibit 90: AstraZeneca Plc - Product / Service
Exhibit 91: AstraZeneca Plc - Key news
Exhibit 92: AstraZeneca Plc - Key offerings
Exhibit 93: Bausch Health Companies Inc. - Overview
Exhibit 94: Bausch Health Companies Inc. - Business segments
Exhibit 95: Bausch Health Companies Inc. - Key news
Exhibit 96: Bausch Health Companies Inc. - Key offerings
Exhibit 97: Bausch Health Companies Inc. - Segment focus
10.5 Chimerix Inc.
Exhibit 98: Chimerix Inc. - Overview
Exhibit 99: Chimerix Inc. - Product / Service
Exhibit 100: Chimerix Inc. - Key offerings
Exhibit 101: Exela Pharma Sciences LLC - Overview
Exhibit 102: Exela Pharma Sciences LLC - Product / Service
Exhibit 103: Exela Pharma Sciences LLC - Key offerings
Exhibit 104: F. Hoffmann La Roche Ltd. - Overview
Exhibit 105: F. Hoffmann La Roche Ltd. - Business segments
Exhibit 106: F. Hoffmann La Roche Ltd. - Key news
Exhibit 107: F. Hoffmann La Roche Ltd. - Key offerings
Exhibit 108: F. Hoffmann La Roche Ltd. - Segment focus
Exhibit 109: Fortress Biotech Inc. - Overview
Exhibit 110: Fortress Biotech Inc. - Business segments
Exhibit 111: Fortress Biotech Inc. - Key offerings
Exhibit 112: Fortress Biotech Inc. - Segment focus
10.9 Gilead Sciences Inc.
Exhibit 113: Gilead Sciences Inc. - Overview
Exhibit 114: Gilead Sciences Inc. - Product / Service
Exhibit 115: Gilead Sciences Inc. - Key news
Exhibit 116: Gilead Sciences Inc. - Key offerings
10.10 Merck and Co. Inc.
Exhibit 117: Merck and Co. Inc. - Overview
Exhibit 118: Merck and Co. Inc. - Business segments
Exhibit 119: Merck and Co. Inc. - Key news
Exhibit 120: Merck and Co. Inc. - Key offerings
Exhibit 121: Merck and Co. Inc. - Segment focus
Exhibit 122: Takeda Pharmaceutical Co. Ltd. - Overview
Exhibit 123: Takeda Pharmaceutical Co. Ltd. - Product / Service
Exhibit 124: Takeda Pharmaceutical Co. Ltd. - Key news
Exhibit 125: Takeda Pharmaceutical Co. Ltd. - Key offerings
Exhibit 126: Teva Pharmaceutical Industries Ltd. - Overview
Exhibit 127: Teva Pharmaceutical Industries Ltd. - Business segments
Exhibit 128: Teva Pharmaceutical Industries Ltd. - Key news
Exhibit 129: Teva Pharmaceutical Industries Ltd. - Key offerings
Exhibit 130: Teva Pharmaceutical Industries Ltd. - Segment focus
11 Appendix
11.1 Scope of the report
11.2 Inclusions and exclusions checklist
Exhibit 131: Inclusions checklist
Exhibit 132: Exclusions checklist
11.3 Currency conversion rates for US$
Exhibit 133: Currency conversion rates for US$
11.4 Research methodology
Exhibit 134: Research methodology
Exhibit 135: Validation techniques employed for market sizing
Exhibit 136: Information sources
11.5 List of abbreviations
Exhibit 137: List of abbreviations
About Technavio
Technavio is a leading global technology research and advisory company. Their research and analysis focus on emerging market trends and provides actionable insights to help businesses identify market opportunities and develop effective strategies to optimize their market positions.
With over 500 specialized analysts, Technavio's report library consists of more than 17,000 reports and counting, covering 800 technologies, spanning across 50 countries. Their client base consists of enterprises of all sizes, including more than 100 Fortune 500 companies. This growing client base relies on Technavio's comprehensive coverage, extensive research, and actionable market insights to identify opportunities in existing and potential markets and assess their competitive positions within changing market scenarios.
Contacts
Technavio Research
Jesse Maida
Media & Marketing Executive
US: +1 844 364 1100
UK: +44 203 893 3200
Email:
[email protected]
Website:
www.technavio.com/
SOURCE Technavio
更多内容,请访问原始网站
文中所述内容并不反映新药情报库及其所属公司任何意见及观点,如有版权侵扰或错误之处,请及时联系我们,我们会在24小时内配合处理。
靶点
-药物
-生物医药百科问答
全新生物医药AI Agent 覆盖科研全链路,让突破性发现快人一步


立即开始免费试用!
智慧芽新药情报库是智慧芽专为生命科学人士构建的基于AI的创新药情报平台,助您全方位提升您的研发与决策效率。
立即开始数据试用!
智慧芽新药库数据也通过智慧芽数据服务平台,以API或者数据包形式对外开放,助您更加充分利用智慧芽新药情报信息。